Abstract
Soluble karyopherins of the importin-β (impβ) family use RanGTP to transport cargos directionally through the nuclear pore complex (NPC). Whether impβ or RanGTP regulate the permeability of the NPC itself has been unknown. In this study, we identify a stable pool of impβ at the NPC. A subpopulation of this pool is rapidly turned-over by RanGTP, likely at Nup153. Impβ, but not transportin-1 (TRN1), alters the pore's permeability in a Ran-dependent manner, suggesting that impβ is a functional component of the NPC. Upon reduction of Nup153 levels, inert cargos more readily equilibrate across the NPC yet active transport is impaired. When purified impβ or TRN1 are mixed with Nup153 in vitro, higher-order, multivalent complexes form. RanGTP dissolves the impβ•Nup153 complexes but not those of TRN1•Nup153. We propose that impβ and Nup153 interact at the NPC's nuclear face to form a Ran-regulated mesh that modulates NPC permeability.
🔬 Techniques
🔭 Microscopes
🧬 Organisms
💻 Software
✨ Fluorophores
🧪 Sample Preparation
🔬 Cell Lines
🏭 Microscope Brands
🧪 Reagent Suppliers
🔴 Lasers
📷 Detectors
🔎 Objectives
💻 Software Details
📋 Protocols
💻 Code & Software
💾 Data Repositories
🏛️ Research Organizations (ROR)
Affiliated research institutions:
📋 Methods
Plasmids; protein expression and purification Plasmid construction Plasmids were synthesized using the SLIC procedure ( Li and Elledge, 2007 ). DNA primers were purchased from Elim Biopharmeuticals, Inc. XL1-Blue chemically competent Escherichia coli cells were transformed and selected for by antibiotic resistance. Plasmids were purified using the Qiagen QIAprep Spin Miniprep Kit and sequenced. Constructs and Plasmids are listed in Supplementary file 1 .
Protein expression and purification
Proteins were expressed and purified as detailed previously ( Lowe et al., 2010 ). Briefly, E. coli (BL21 DE3) were transformed with the appropriate plasmid and grown in 1 l of LB media with the appropriate antibiotic. The cells were grown at 37°C to an A600 of ∼0.6 and then cooled to room temperature. Protein expression was induced with 0.5 mM IPTG overnight. Biotinylated proteins were expressed in the presence of 0.1 mM biotin and a biotin ligase. Cells were harvested by centrifugation at 5000× g at 4°C for 15 min, and the pellet was resuspended in PBS (pH 7.4) containing 20 mM imidazole, 1 mM β-mercaptoethanol, and protease inhibitors (Complete Protease Inhibitor Cocktail Tablet, Roche Diagnostics Corporation, Indianopolis, IN). Proteins were purified by Ni-NTA affinity chromatography, followed by size-exclusion chromatography (Superdex 75, GE Healthcare, Pittsburgh, PA). Proteins were typically dialysed into XB buffer (10 mM HEPES pH 7.7, 1 mM MgCl 2 , 100 mM KCl, 50 mM sucrose), flash frozen in liquid nitrogen, and stored at −80°C. Protein purity was judged by SDS-PAGE, and concentrations determined by UV absorbance (using calculated extinction coefficients) or Bradford assays. Nucleotide loading of Ran was performed as described previously ( Askjaer et al., 1999 ). Briefly, Ran was incubated for 40 min on ice with 6 mM EDTA and a 50-fold excess of nucleotide (GDP or GTP). The reaction was stopped with a final concentration of 25 mM MgCl 2 added slowly (in four portions in 1 min intervals). The protein was then dialysed against 30 mM potassium phosphate pH 7.6, 2 mM Mg-acetate, 2 mM GDP or GTP, 7% glycerol, and 2 mM β-mercaptoethanol, at 4°C overnight. For Nup153FG purification, the cell lysate was run over a 5-ml GSTrap HP column (GE Healthcare) equilibrated in PBS. Bound protein was eluted with 10 mM reduced glutathione in 50 mM TrisHCl pH 8.0. The sample was concentrated and loaded onto a HiPrep 16/60 Sephacryl S-300 High Resolution size exclusion column (GE Healthcare) equilibrated in 25 mM HEPES pH 7.5, 400 mM NaCl, 10% glycerol, 1 mM DTT, flash frozen, and stored at −80°C. Labeling, imaging buffers, cell culture, and import assays Protein and antibody fluorescent dye labeling Purified proteins were labeled for dSTORM using N-hydroxysuccinimidyl esters of Alexa649, Cy5, or additionally with Alexa 405/488/532 for multicolor STORM, according to the manufacturers' protocols. Antibodies were purchased from Abcam (Cambridge, UK): Anti-Nup153 antibody [SA1] [ab96462], Anti-RanBP2 antibody [ab64276], Donkey polyclonal Secondary antibody to Rabbit IgG—H&L [ab6701], Donkey polyclonal Secondary antibody to Mouse IgG—H&L [ab6707].
Show full methods section
Plasmids; protein expression and purification Plasmid construction Plasmids were synthesized using the SLIC procedure ( Li and Elledge, 2007 ). DNA primers were purchased from Elim Biopharmeuticals, Inc. XL1-Blue chemically competent Escherichia coli cells were transformed and selected for by antibiotic resistance. Plasmids were purified using the Qiagen QIAprep Spin Miniprep Kit and sequenced. Constructs and Plasmids are listed in Supplementary file 1 .
Protein expression and purification
Proteins were expressed and purified as detailed previously ( Lowe et al., 2010 ). Briefly, E. coli (BL21 DE3) were transformed with the appropriate plasmid and grown in 1 l of LB media with the appropriate antibiotic. The cells were grown at 37°C to an A600 of ∼0.6 and then cooled to room temperature. Protein expression was induced with 0.5 mM IPTG overnight. Biotinylated proteins were expressed in the presence of 0.1 mM biotin and a biotin ligase. Cells were harvested by centrifugation at 5000× g at 4°C for 15 min, and the pellet was resuspended in PBS (pH 7.4) containing 20 mM imidazole, 1 mM β-mercaptoethanol, and protease inhibitors (Complete Protease Inhibitor Cocktail Tablet, Roche Diagnostics Corporation, Indianopolis, IN). Proteins were purified by Ni-NTA affinity chromatography, followed by size-exclusion chromatography (Superdex 75, GE Healthcare, Pittsburgh, PA). Proteins were typically dialysed into XB buffer (10 mM HEPES pH 7.7, 1 mM MgCl 2 , 100 mM KCl, 50 mM sucrose), flash frozen in liquid nitrogen, and stored at −80°C. Protein purity was judged by SDS-PAGE, and concentrations determined by UV absorbance (using calculated extinction coefficients) or Bradford assays. Nucleotide loading of Ran was performed as described previously ( Askjaer et al., 1999 ). Briefly, Ran was incubated for 40 min on ice with 6 mM EDTA and a 50-fold excess of nucleotide (GDP or GTP). The reaction was stopped with a final concentration of 25 mM MgCl 2 added slowly (in four portions in 1 min intervals). The protein was then dialysed against 30 mM potassium phosphate pH 7.6, 2 mM Mg-acetate, 2 mM GDP or GTP, 7% glycerol, and 2 mM β-mercaptoethanol, at 4°C overnight. For Nup153FG purification, the cell lysate was run over a 5-ml GSTrap HP column (GE Healthcare) equilibrated in PBS. Bound protein was eluted with 10 mM reduced glutathione in 50 mM TrisHCl pH 8.0. The sample was concentrated and loaded onto a HiPrep 16/60 Sephacryl S-300 High Resolution size exclusion column (GE Healthcare) equilibrated in 25 mM HEPES pH 7.5, 400 mM NaCl, 10% glycerol, 1 mM DTT, flash frozen, and stored at −80°C. Labeling, imaging buffers, cell culture, and import assays Protein and antibody fluorescent dye labeling Purified proteins were labeled for dSTORM using N-hydroxysuccinimidyl esters of Alexa649, Cy5, or additionally with Alexa 405/488/532 for multicolor STORM, according to the manufacturers' protocols. Antibodies were purchased from Abcam (Cambridge, UK): Anti-Nup153 antibody [SA1] [ab96462], Anti-RanBP2 antibody [ab64276], Donkey polyclonal Secondary antibody to Rabbit IgG—H&L [ab6701], Donkey polyclonal Secondary antibody to Mouse IgG—H&L [ab6707].
Antibody labeling protocol
HeLa cells were washed three times with PBS and then fixed in 4% PFA for 15 min. The PFA was removed and the cells were washed 3 × 2 min in PBS with agitation (70 RPM on a rotary shaker). Cells were permeabilized with 0.5% Triton X-100 for 5 min at RT followed by 3 × 2 min PBS washes. The cells were incubated in blocking buffer (PBS + 10% vol/vol goat/donkey serum + 1.25 mg/ml BSA) for 1 hr at RT. The antibodies were diluted according to manufacturers' suggestions in blocking buffer. The cells were incubated with the primary antibody for 30 min, washed 3 × 5 min with blocking buffer, incubated with the secondary antibody for 30 min, and washed 3 × 5 min with PBS. STORM and dSTORM imaging buffers Imaging was performed using the following buffer conditions: 10/100 mM mercaptoethylamine (Sigma–Aldrich), 0.5 mg/ml glucose oxidase (Sigma–Aldrich, St. Louis, MO), 0.2% vol/vol catalase (Sigma–Aldrich), 10% wt/vol D-Glucose in PBS pH 7.4.
Cell culture
HeLa cells were cultured in DMEM media supplemented with 10% FBS. Cells were plated on glass-bottomed (size 0 thickness) poly-lysine-coated chambers (MatTek Corporation, Ashland, MA) at a seeding concentration of 2.5 × 10 5 cells/ml the day prior to use.
Import assays
Import assays were performed as reported previously ( Lowe et al., 2010 ). The buffers used were PBS (137 mM NaCl, 2.7 mM KCl, 8 mM Na 2 HPO 4 , 2 mM KH 2 PO 4 , pH 7.4), permeabilization buffer (50 mM HEPES, 50 mM KOAc, 8 mM MgCl 2 , pH 7.3), and transport buffer (20 mM HEPES, 110 mM KOAc, 5 mM NaOAc, 2 mM MgOAc, 2 mM DTT, pH 7.3). The cell permeabilization protocol is based on that of Adam et al. (1990) . The cells were washed for 3 × 2 min with PBS, followed by a 2-min wash with permeabilization buffer, followed by a 5-min permeabilization with digitonin (Sigma–Aldrich) at a concentration of 50 μg/ml supplemented with an energy regenerating system of 100 µM ATP (Roche), 100 μM GTP (Roche), 4 mM creatine phosphate (Roche), and 20 U/ml creatine kinase (Roche) in permeabilization buffer. The digitonin was subsequently removed by washing for 3 × 3 min with transport buffer. After the final wash, excess liquid was removed and the appropriate experimental reaction mix was quickly added to the nuclei. Control experiments with fluorescently (FITC) labeled dextrans (70 kDa) were used to confirm that the nuclear envelope remained intact following the digitonin permeabilization. Active nuclear import assays Digitonin-permeabilized HeLa cells were treated with an active nuclear import reaction mix containing a fluorescent import cargo probe, importin-β (various concentrations), RanGDP (5 μM), NTF2 (4 µM), and an energy regenerating system (2 mM GTP, 0.1 mM ATP, 4 mM creatine phosphate, and 20 µ/ml creatine kinase) in transport buffer. Import reactions proceeded at room temperature for 20 min before the cells were fixed with a 4% PFA solution for 15 min and washed 3 × 2 min with PBS. Cells were then imaged using a Zeiss LSM 700 confocal laser scanning microscope (Carl Zeiss AG, Oberkochen, Germany). Passive nuclear import assays Digitonin-permeabilized HeLa cells were treated with a passive nuclear import reaction mix containing a fluorescent passive import probe (either 1xGFP, 2xGFP, or 3xGFP) and also (depending on the experimental condition) importin-ß (1 µM), RanGDP (5 µM), NTF2 (4 µM), and an energy regenerating system (2 mM GTP, 0.1 mM ATP, 4 mM creatine phosphate, and 20 µ/ml creatine kinase) in transport buffer. Passive import reactions were imaged live for 15 min (at 20 s intervals) using a Zeiss 700 LSM laser scanning confocal microscope.
RNA knockdown
RNA interference was used to knock down protein expression of Nup153 using an siRNA corresponding to nucleotides 2593–2615 of human Nup153 (5′-AAGGCAGACUCUACCAAAUGUdTdT-3′) ( Harborth et al., 2001 ; Zhou and Pante, 2010 ). HeLa cells were plated in glass-bottom dishes (MatTek) at a density of 1.25 × 10 5 cells/dish (2 ml volume) the day prior to siRNA transfection. Lipofectamine RNAiMAX Transfection Reagent (Invitrogen, Carlsbad, CA) was used following the manufacturer's protocol. Briefly, 5 µl of Lipofectamine reagent was diluted 50-fold into Opti-MEM I Reduced Serum Media (Invitrogen). 75 pmol of siRNA was diluted into an equal volume of Opti-MEM media. The Lipofectamine and siRNA were then mixed together, incubated at room temperature for 10 min, and then added to the cells. Cells were used for experiments ∼48 hr after transfection as no noticeable difference was observed past 48 hr. Knockdown efficiency was determined to be about 70% using immunofluorescence (measured to be 68%) and Western blot (measured to be 72%) ( Figure 3—figure supplement 2 ).
General imaging hardware and analysis
Confocal imaging, photoconversion, and bleaching Imaging was performed on a Zeiss 700 confocal laser scanning microscope. GFP constructs were imaged using the 488 nm laser. Photo-convertible mEos2 constructs were imaged in two separate channels, with localized photoactivation performed using the 405 nm laser.
Confocal time-series analysis
Image analysis was performed using custom-written MATLAB (The MathWorks Inc., Natick, MA) scripts for quantifying fluorescence intensities. Briefly, a mean value of intranuclear fluorescence intensity was calculated for each nucleus in the image using an automated nucleus segmentation algorithm. For passive import assays, the nuclear fluorescence intensity value was normalized against the background fluorescence intensity.
Photobleaching hardware
FRAP was performed on a custom built microscope ( Figure 1—figure supplement 2 ). The microscope allows one to perform simultaneous high-speed widefield imaging with a controlled diffraction limited bleaching/photoconversion spot at the center of the field of view. Briefly, four lasers (100 mW 405 nm Coherent Cube, and 100 mW 488, 514 and 561 nm Coherent Sapphires, Coherent Inc., Santa Clara, CA) were combined and expanded to a similar beam diameter. Each laser was under the controller of a shutter. Half-wave plates allow for adjustment of polarization. A polarizing beam splitting cube (PBS) splits the beam into two ‘arms’. The ‘focused spot’ arm passes via a matched pair of convex lenses (f = 50 mm), one of which is mounted on a Z-translation stage to modify the focal depth position. An additional shutter in this arm allows for control of timing of the activation. The ‘imaging’ arm has an additional lens (f = 200 mm) in order to focus the beam at the back focal plane of the objective (BFP). The two paths are recombined using a second PBS and pass through a quarter wave plate before the remainder of the TIRF lens system to the objective (Olympus 60× 1.49 N.A. TIRF apochromatic objective, Olympus Corporation, Tokyo, Japan) via a multi-edge dichroic filter (Semrock Inc., Rochester, NY). An actively cooled EMCCD camera (iXon+ or iXon Ultra, Andor Technology, Belfast, UK) was coupled to the camera port of the microscope via an additional magnifier. Sample positioning was controlled via a motorized stage with an additional XYZ-Nanopositioning stage (Physik Instrumente, Karlsruhe, Germany) for fine control. All software to control the microscope was written in C++.
FRAP analysis
Images were processed using custom written MATLAB code, which automated identification of the cell and of the nuclear envelope. The image processing code generates masks for the bleached and unbleached portions of the nuclear envelope as well as the background. These masks were used to extract raw intensity traces for the three regions. Raw intensity traces for the photobleached region of the nuclear envelope were normalized using the unbleached portion of the nuclear envelope to correct for ‘background’ bleaching caused by the imaging laser. We then scaled the recovery curve such that the initial pre-photobleach value is 1 and the value immediately after the photobleaching pulse zero. Normalized recovery traces were then used to compute mean recovery trace for each experimental condition.
Photoconversion analysis
Images were processed using a custom-written MATLAB script that locates the cell in the field of view and creates a mask for the region corresponding to the nuclear envelope and the photoconverted region of the envelope. The mask for the photoconverted region of the nuclear envelope was used to compute the mean intensity in this region in both red and green channels at each time point. The red channel intensity of the region of interest prior to photoconversion (frames 1–4) was averaged to determine the background, which was typically undetectably low. The 405 nm photoconversion laser pulse increases the red intensity, which then decays as the photoconverted molecules leave the pore. The red and green traces provide quantitative information about the kinetics of imp-β turnover in the pore.
Super-resolution hardware and algorithms
STORM/dSTORM imaging All super-resolution imaging was performed on a custom built microscope, based on a Nikon TE-2000 base. Three lasers (100 mW 488 nm Coherent Sapphire, 100 mW 532 nm Coherent Compass, and 100 mW 640 nm Coherent Cube), each with their own shutter control, were expanded to the same diameter and combined using a series of dichroic mirrors into a single free-space beam. Half-wave plates were used to adjust the polarization before passing the beams through an Acousto-Optical Tunable Filter (AOTF, AA Optoelectronics, France) to quickly modulate laser power. The combined beams were again expanded and passed through a quarter-wave plate to circularly polarize the beam. For two-color STORM imaging experiments, we added an additional 405 nm laser (100 mW Coherent Cube), via an optical fiber. The free beam then passed through the TIRF lenses and was focused directly onto the back focal plane of the objective (Olympus 60× or 100× 1.49 N.A. TIRF apochromatic objective) via a multi-edge dichroic filter (Semrock). We used the HILO method of illumination ( Tokunaga et al., 2008 ) to image a thin plane through the nucleus. An actively cooled EMCCD camera (iXon+ or iXon Ultra) was coupled to the camera port of the microscope via an additional magnifier. Laser shutter, AOTF, and camera firing were synchronized using a Data Translation DT9834 data acquisition module. Sample positioning was controlled via a micrometer stage with a XY-Nanopositioning stage (Mad City Labs Inc., Madison, WI or Physik Instrumente). Focal drift during image acquisition was corrected using an Objective Z-Nanopositioning stage (Mad City Labs or Physik Instrumente). Camera acquisition was at 40–120 Hz. All software to control the microscope was written in C++ and Python. Data analysis was performed in MATLAB, C++, or Python. The source code for the microscope control software is available at https://github.com/jliphard/OctopusScopeControl.git and other materials (such as MATLAB scripts) are available at http://liphardtlab.stanford.edu/materials.html and at https://github.com/quantumjot/ . Sub-pixel localization of single-molecules For a sub-wavelength diameter fluorescent molecule, fitting of the point spread function (PSF) to a Gaussian function yields the highest accuracy and precision of localization ( Cheezum et al., 2001 ). Each PSF in successive STORM/dSTORM movie frames was fitted to a symmetrical 2D Gaussian function: f ( x , y ) ≈ A e − ( ( x − x 0 ) 2 2 σ x 2 + ( y − y 0 ) 2 2 σ y 2 ) + B , where A is the amplitude, B is the background, x 0 and y 0 are the mean x and y positions, and σ x and σ y are the standard deviations in x and y (where x = y for symmetrical Gaussian functions).
Drift correction
Drift correction was split into two parts: (i) Real-time focus locking performed during the imaging and (ii) post-imaging translational drift correction: Real-time focus lock Fluorescent beads (0.2 µm Yellow-Green FluoSpheres, Invitrogen) were immobilized to the glass surface of the chamber. The relative z-displacement of the equatorial imaging plane of the nucleus to the surface beads was measured. Imaging proceeded by alternating between imaging the surface beads and correcting for focus drift at the sample surface, and moving up to the imaging plane and performing dSTORM/STORM imaging. Typically, focus drift was stabilized during the experiment, to within ∼50 nm using this method.
XYZ stage translational drift correction
By tracking the fiducial markers at the sample surface plane over time, we can filter and interpolate their trajectories in order to correct the imaging plane movie sequences. We used the interpolated mean fiducial position in order to perform a per-frame drift correction. Typically, translational drift over the experiment was stabilized to
📊 Figures
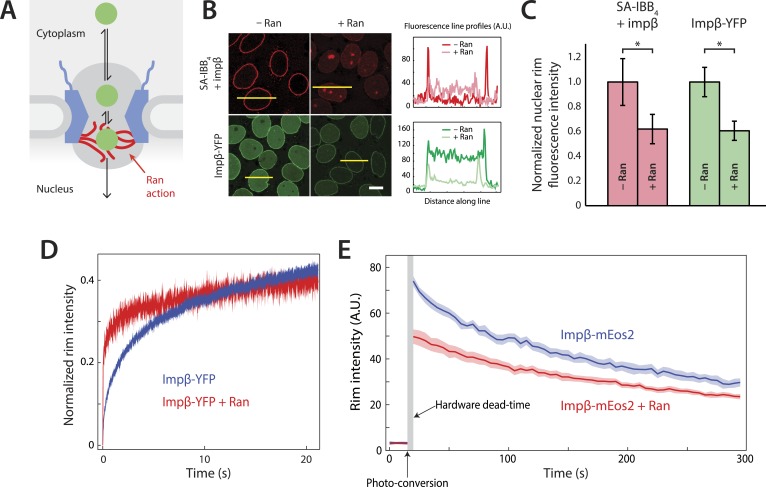
Figure 1.
Effect of Ran on impu03b2 binding affinity and turnover at the NPC.
( A ) Schematic of the NPC showing the location of the Ran-dependent exit step for cargo-receptor complexes. ( B ) Representative images of cargo-receptor complexes and impu03b2-YFP stalled within the...
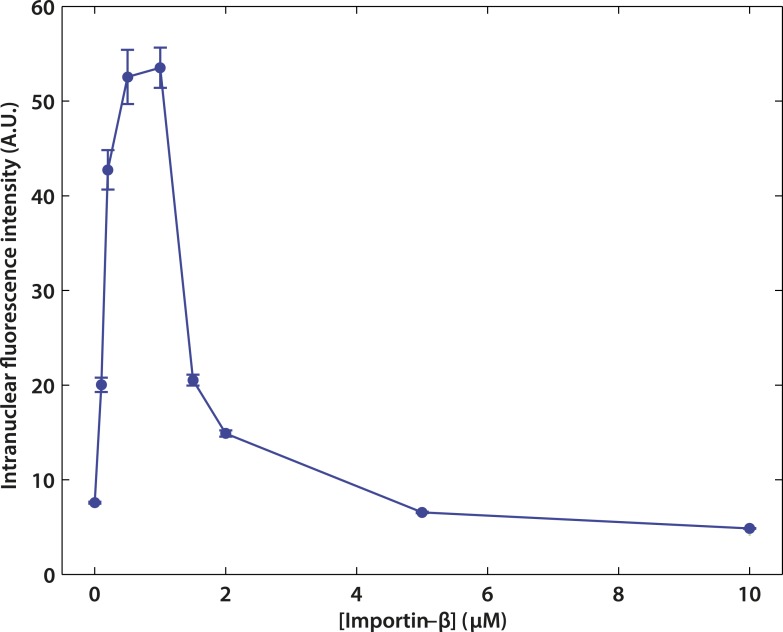
Figure 1u2014figure supplement 1.
Effect of impu03b2 concentration on active transport.
The optimum concentration was u223c1 u03bcM. At low impu03b2 concentrations, cargou2022impu03b2 complex formation is limited by impu03b2 availability, leading to low import levels. At high impu03b2 co...
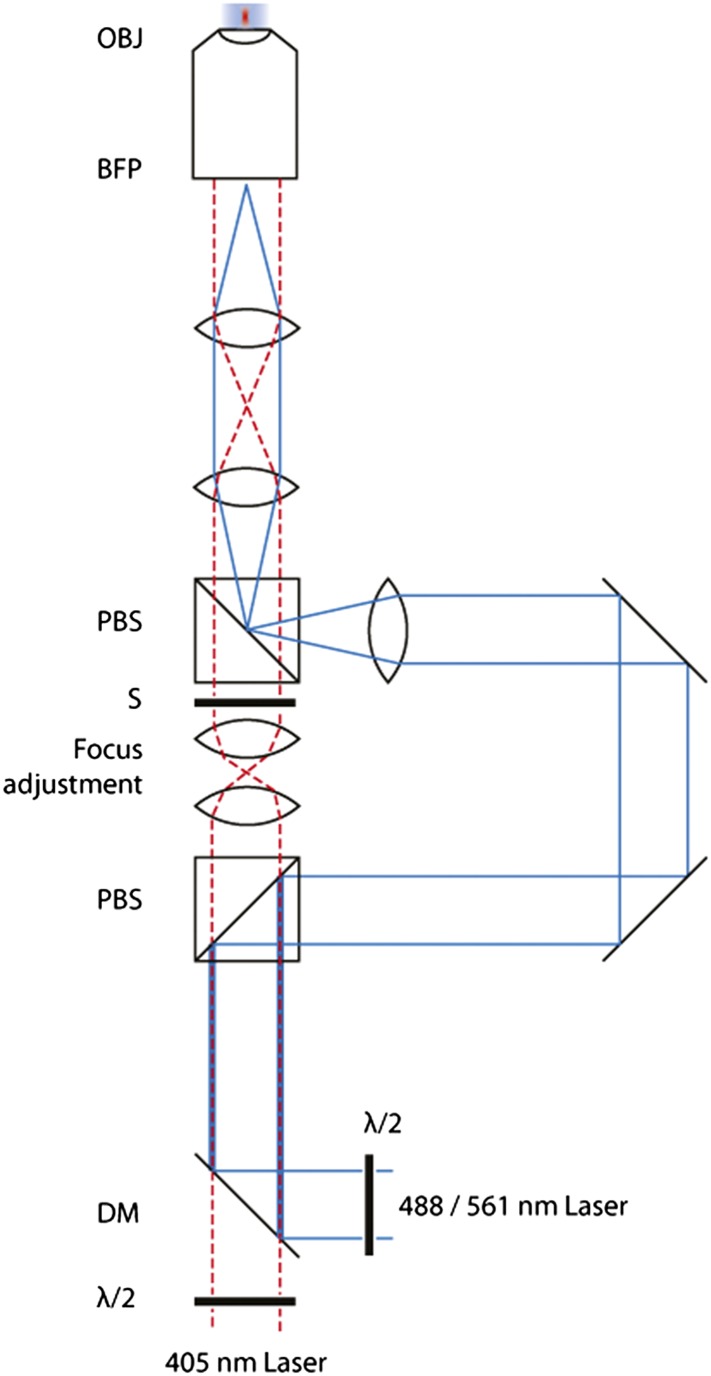
Figure 1u2014figure supplement 2.
Schematic of the FRAP microscope.
Lasers are combined and passed through a Polarizing Beam Splitter (PBS) whereupon the polarized light is split into two paths. By adjusting the half-wave plates, one can adjust the amount of light thr...
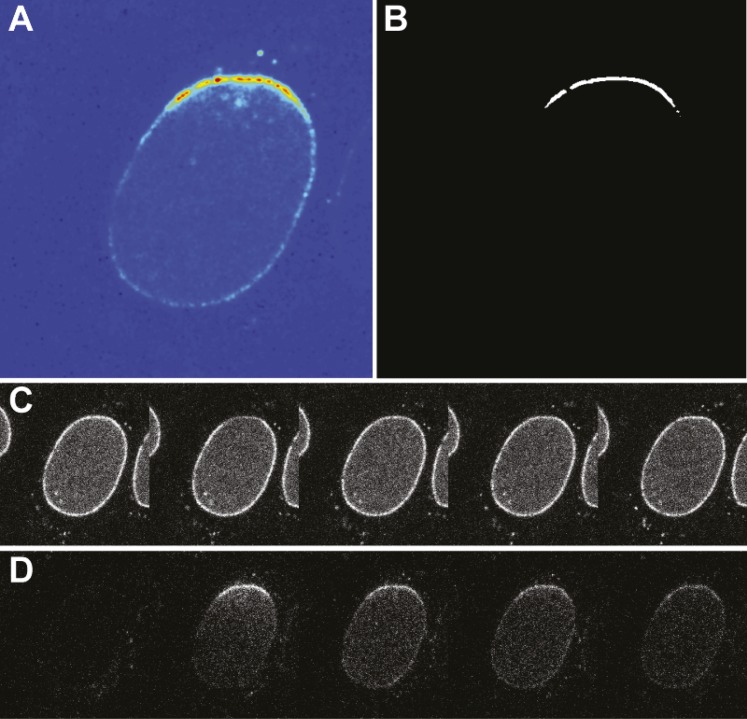
Figure 1u2014figure supplement 3.
Photoconversion experiment details.
( A ) False-color image of the photoswitched region within a single nucleus. ( B ) Mask generated for photoswitched region of the nuclear envelope. ( C ) Timecourse of the green channel at time points...
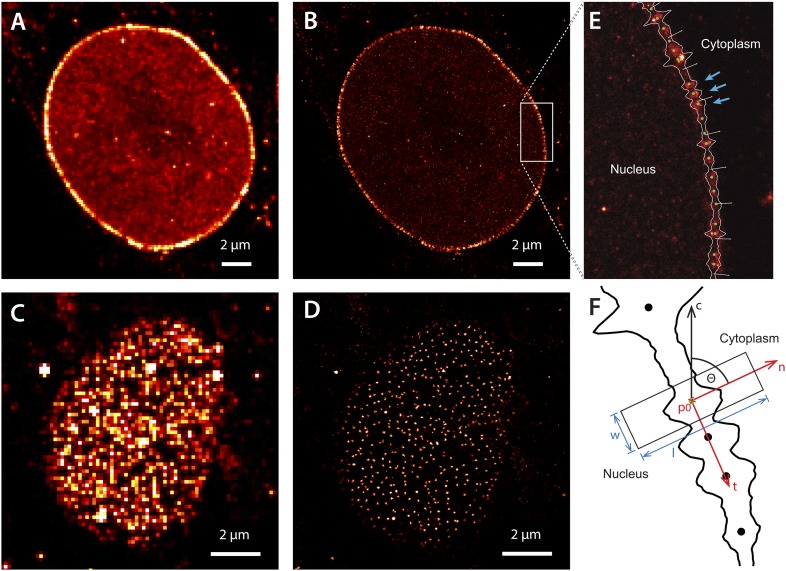
Figure 2.
Super-resolution imaging of Alexa647-labeled impu03b2 in digitonin-permeabilized HeLa cells.
( A ) Simulated widefield impu03b2 localization at the equatorial plane of the nucleus and ( B ) corresponding dSTORM image. Mean localization precision is 12 nm. ( C and D ) Corresponding widefield a...
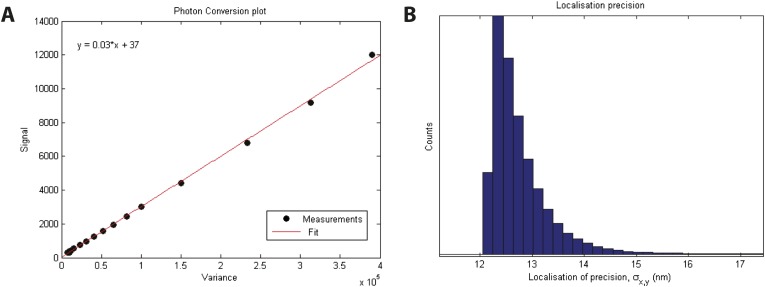
Figure 2u2014figure supplement 1.
Localization precision.
( A ) Calibration of EMCCD camera for photon conversion factor. ( B ) Histogram of calculated localization precisions from dSTORM image data. The median value of localization precision (positional err...
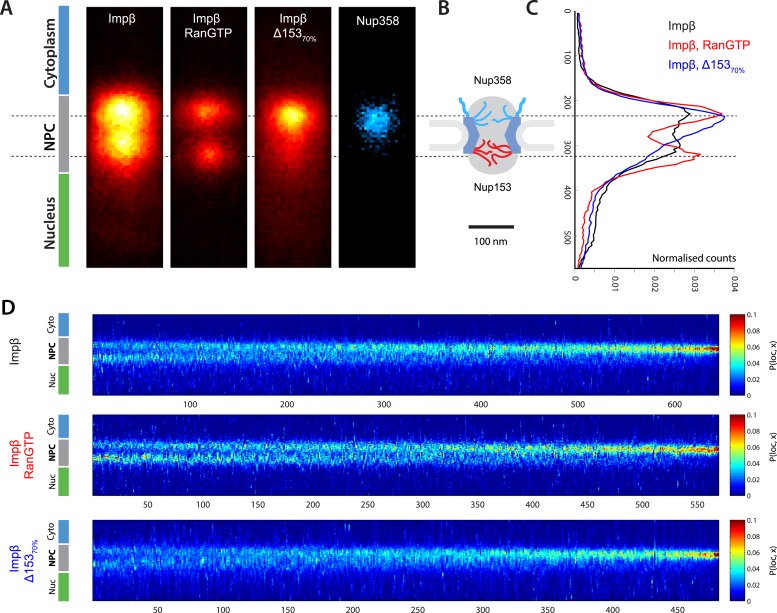
Figure 3.
Localization microscopy of impu03b2 spatial organisation and its Ran-dependence.
( A ) 2D histograms of impu03b2 density in the NPC under different conditions. To generate these panels, we sum all localizations for a given condition and divide by the number of NPCs per condition. ...
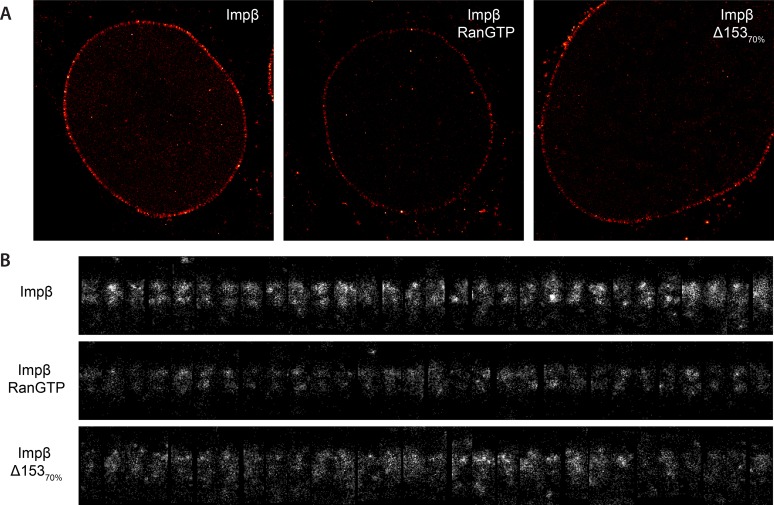
Figure 3u2014figure supplement 1.
Examples of raw localization data for each of the conditions.
( A ) Total raw localizations for each of the conditions presented in Figure 3 . Note the strongly reduced number of localizations in the Ran+GTP case. Each image is plotted on the same intensity scal...
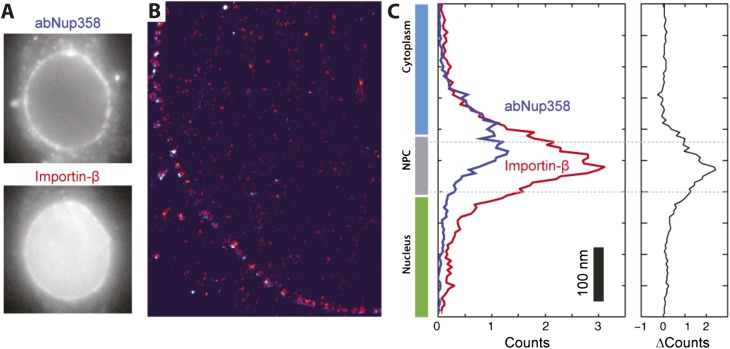
Figure 3u2014figure supplement 2.
Two color STORM imaging.
( A ) Widefield imaging of STORM labeled abNup358 and impu03b2. ( B ) Two-color STORM showing abNup358 labeled in blue and impu03b2 labeled in red. The antibody again Nup358 localizes toward the cytop...
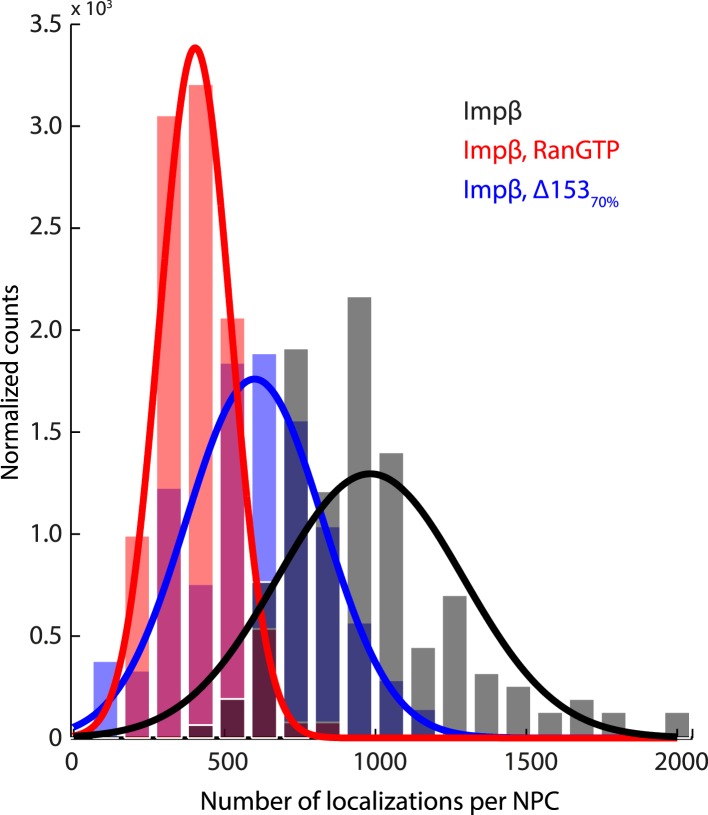
Figure 3u2014figure supplement 3.
Histogram of the number of raw localizations per NPC structure.
Measured from the dSTORM data in Figure 3u2014figure supplement 1 . Each distribution is fitted to a Gaussian distribution (plotted as a bold line), to show the decrease in the number of localizations...
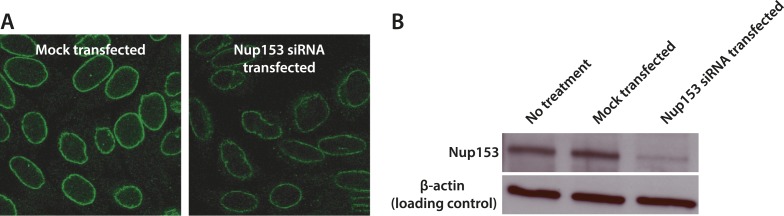
Figure 3u2014figure supplement 4.
Quantification of siRNA knockdown of Nup153.
( A ) Immunofluorescence labeling of Nup153 in mock transfected and Nup153 siRNA-transfected HeLa cells. ( B ) Nup153 Western blot assay for HeLa cells that were not transfected, mock transfected, or ...
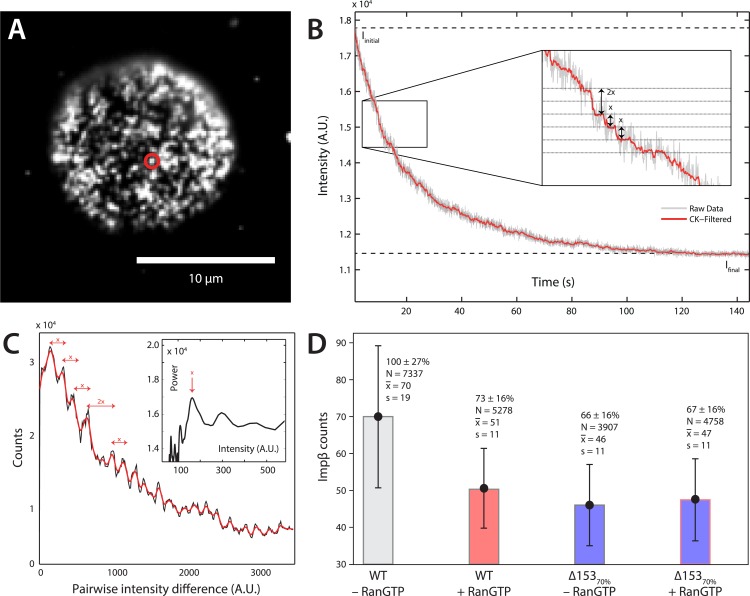
Figure 4.
Photobleach step-counting of impu03b2 at the NPC.
( A ) A 200-frame average image of impu03b2-mCherry at the basal envelope of the nucleus. Individual NPCs can be identified (example highlighted in red). ( B ) Fluorescence intensity vs time trace for...
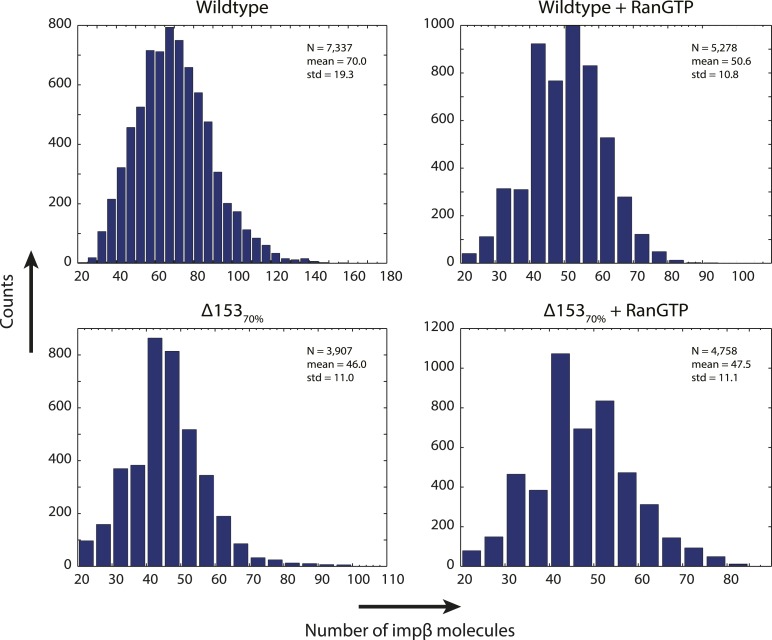
Figure 4u2014figure supplement 1.
Distribution of count values.
Histogram of the count values for four conditions (wild type or u0394153 70% cells with and without RanGTP) with a bin size of five molecules. Numbers of pores analyzed, means, and standard deviations...
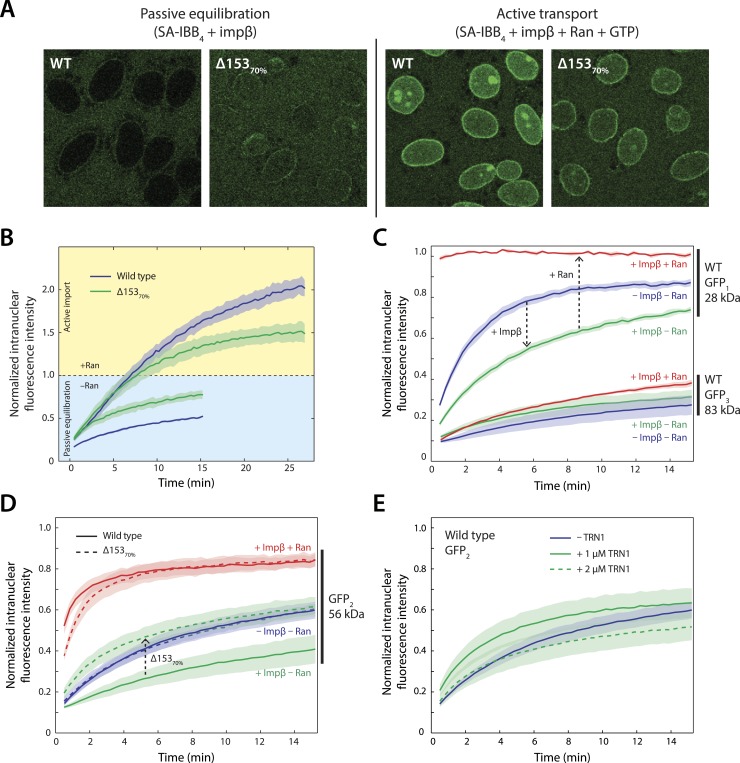
Figure 5.
Effect of Nup153 reduction on active transport and passive equilibration.
( A ) Confocal fluorescence microscopy images showing the change in distribution of a fluorescently labeled 220 kDa SA-IBB 4 cargo as a function of Nup153 knockdown. ( B ) Reduction of Nup153 enables ...
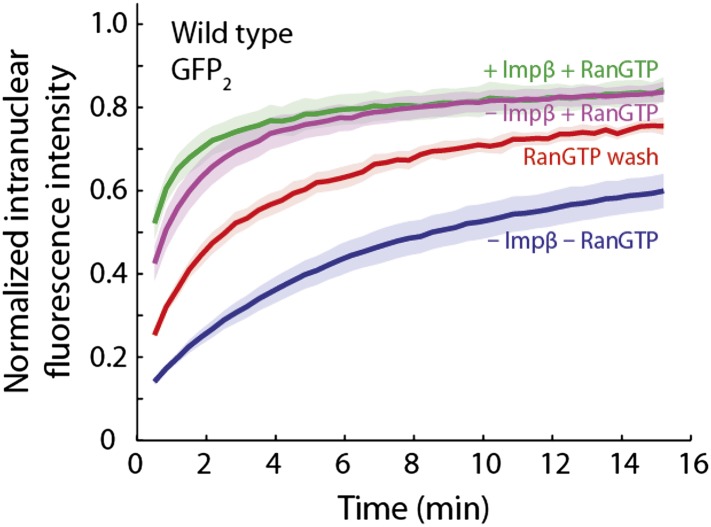
Figure 5u2014figure supplement 1.
RanGTP and a Ran u2018washu2019 increase the passive equilibration of GFP 2 into wild type nuclei even when no impu03b2 is present.
In the GFP 2 passive equilibration assays, it was intriguing that RanGTP made the pore more permeable than when impu03b2 was excluded. We hypothesized that perhaps there was a significant amount of en...
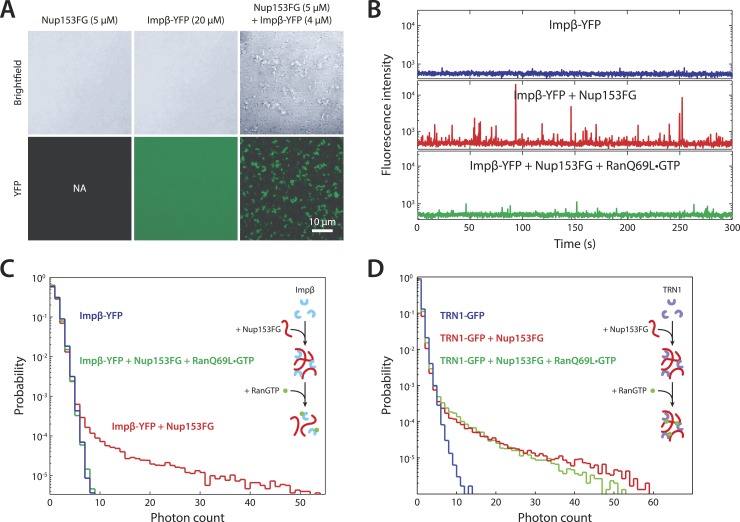
Figure 6.
In vitro formation of large RanGTP-reversible impu03b2u2022Nup153FG complexes.
( A ) Confocal images of impu03b2u2022Nup153FG complexes. Brightfield and YFP fluorescence images of Nup153FG (left), impu03b2-YFP (center), and Nup153FG + impu03b2-YFP (right). Complexes form only wh...
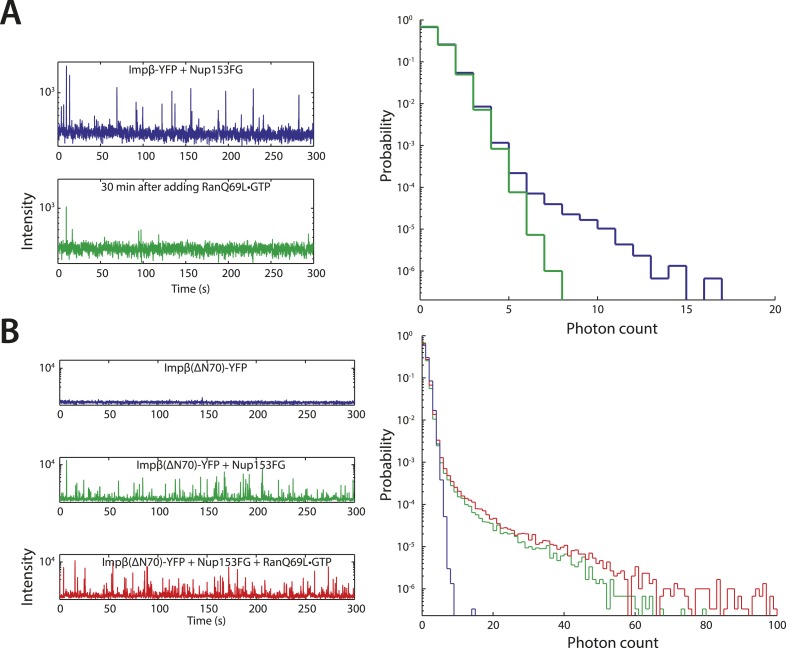
Figure 6u2014figure supplement 1.
Additional fluctuation traces.
( A ) RanQ69Lu2022GTP can dissolve existing aggregates. To determine whether RanGTP can dissolve aggregates that have already formed and not just prevent aggregate formation, impu03b2-YFPu2022Nup153 a...
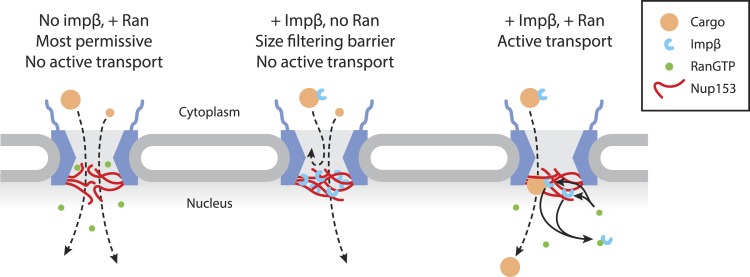
Figure 7.
Model of Ran-sensitive impu03b2u2022Nup153 interactions at the nuclear face of the NPC.
In this model, multivalent interaction of impu03b2 with Nup153 yields a cross-linked mesh that restricts the movement of inert molecules and cargo-receptor complexes. This impu03b2u2022Nup153 barrier ...
Figure images are served from the NIH/NLM PubMed Central Open Access Subset or Europe PMC; copyright remains with the publishers and authors.
💬 Discussion
0 commentsNo comments yet. Be the first to start a discussion!
Leave a Comment