Abstract
AbstractTwo-photon excitation with temporally focused pulses can be combined with phase-modulation approaches, such as computer-generated holography and generalized phase contrast, to efficiently distribute light into two-dimensional, axially confined, user-defined shapes. Adding lens-phase modulations to 2D-phase holograms enables remote axial pattern displacement as well as simultaneous pattern generation in multiple distinct planes. However, the axial confinement linearly degrades with lateral shape area in previous reports where axially shifted holographic shapes were not temporally focused. Here we report an optical system using two spatial light modulators to independently control transverse- and axial-target light distribution. This approach enables simultaneous axial translation of single or multiple spatiotemporally focused patterns across the sample volume while achieving the axial confinement of temporal focusing. We use the system's capability to photoconvert tens of Kaede-expressing neurons with single-cell resolution in live zebrafish larvae.
🔬 Techniques
🔭 Microscopes
🧬 Organisms
💻 Software
✨ Fluorophores
🧪 Sample Preparation
🏭 Microscope Brands
🧪 Reagent Suppliers
🔴 Lasers
📷 Detectors
🎨 Filters
💻 Software Details
🏛️ Research Organizations (ROR)
Affiliated research institutions:
📋 Methods
Two-SLM optical set-up The optical system, schematically depicted in Fig. 1 and Supplementary Fig. 11 , was built around a commercial Olympus IX71 inverted microscope, modified in order to accommodate two opposite-facing objectives, OBJ1 and OBJ2, for excitation and fluorescence collection, respectively. To this end, the condenser lens of the microscope was substituted with a dielectric mirror and an Olympus LUMPLFL60xW/IR2, NA 0.90 objective (OBJ1). The expanded (× 10) beam of a Ti:Sapphire laser (MaiTai Deep-See, Spectra-Physics) covered the active area of a first LCOS-SLM (X10468-07, Hamamatsu Photonics; SLM1), which modulated the phase of the incoming beam to create a first image of the desired intensity pattern on the diffraction grating (830 l/mm, 53004ZD02-035R, Richardson Gratings; G) for TF through the lens L1 ( f 1 =500 mm). 2D-phase holograms were calculated using a standard GS algorithm 20 33 . The first diffraction order was subsequently collimated by lens L2 ( f 2 =500 mm) and impinged on a second SLM (X10468-07, Hamamatsu Photonics; SLM2), which was imaged at the back focal plane of the excitation objective, OBJ1, via a 2:1 telescope (lenses L3, f 3 =1,000 mm and L4, f 4 =500 mm). Suppression of the zero-order spot arising from SLM1 was achieved by using two cylindrical lenses ( f L1 =1,000 mm and f L2 =−1,000 mm) oriented at +45° and −45° with respect to the grating lines 64 . Holographic light patterns generated at the sample volume illuminated a thin spin-coated fluorescent layer of rhodamine-6G in polymethyl methacrylate 2% w/v in chloroform and the induced fluorescence was imaged on a CCD camera (CoolSNAP HQ2, Roper Scientific) through OBJ2 (Olympus UPLSAPO60XW, NA 1.2). For 3D reconstruction of illumination volumes, OBJ2 was fixed and focused on the fluorescent layer, while OBJ1 was moved along the axial direction with a piezo positioner of 1 mm range when working in closed loop (PI N-725.2A PIFOC). The two SLMs, the CCD camera, the piezo positioner, lasers and other electronic components of the set-up were controlled by a custom-developed interface in LabVIEW. GS-based algorithms were run in MATLAB. When the set-up was used for generation of multiplane holographic patterns (not temporally focused) a mirror replaced the diffraction grating, and SLM2 was either used in reflectance mode by applying only the flatness correction phase mask of the device or was replaced by a mirror. Both the grating and SLM2 were mounted on magnetic bases enabling fast switching between the different configurations. The multiplane GS algorithm used in this case was run in a custom-designed C++ software interface, Wavefront Designer 20 .
Show full methods section
Two-SLM optical set-up The optical system, schematically depicted in Fig. 1 and Supplementary Fig. 11 , was built around a commercial Olympus IX71 inverted microscope, modified in order to accommodate two opposite-facing objectives, OBJ1 and OBJ2, for excitation and fluorescence collection, respectively. To this end, the condenser lens of the microscope was substituted with a dielectric mirror and an Olympus LUMPLFL60xW/IR2, NA 0.90 objective (OBJ1). The expanded (× 10) beam of a Ti:Sapphire laser (MaiTai Deep-See, Spectra-Physics) covered the active area of a first LCOS-SLM (X10468-07, Hamamatsu Photonics; SLM1), which modulated the phase of the incoming beam to create a first image of the desired intensity pattern on the diffraction grating (830 l/mm, 53004ZD02-035R, Richardson Gratings; G) for TF through the lens L1 ( f 1 =500 mm). 2D-phase holograms were calculated using a standard GS algorithm 20 33 . The first diffraction order was subsequently collimated by lens L2 ( f 2 =500 mm) and impinged on a second SLM (X10468-07, Hamamatsu Photonics; SLM2), which was imaged at the back focal plane of the excitation objective, OBJ1, via a 2:1 telescope (lenses L3, f 3 =1,000 mm and L4, f 4 =500 mm). Suppression of the zero-order spot arising from SLM1 was achieved by using two cylindrical lenses ( f L1 =1,000 mm and f L2 =−1,000 mm) oriented at +45° and −45° with respect to the grating lines 64 . Holographic light patterns generated at the sample volume illuminated a thin spin-coated fluorescent layer of rhodamine-6G in polymethyl methacrylate 2% w/v in chloroform and the induced fluorescence was imaged on a CCD camera (CoolSNAP HQ2, Roper Scientific) through OBJ2 (Olympus UPLSAPO60XW, NA 1.2). For 3D reconstruction of illumination volumes, OBJ2 was fixed and focused on the fluorescent layer, while OBJ1 was moved along the axial direction with a piezo positioner of 1 mm range when working in closed loop (PI N-725.2A PIFOC). The two SLMs, the CCD camera, the piezo positioner, lasers and other electronic components of the set-up were controlled by a custom-developed interface in LabVIEW. GS-based algorithms were run in MATLAB. When the set-up was used for generation of multiplane holographic patterns (not temporally focused) a mirror replaced the diffraction grating, and SLM2 was either used in reflectance mode by applying only the flatness correction phase mask of the device or was replaced by a mirror. Both the grating and SLM2 were mounted on magnetic bases enabling fast switching between the different configurations. The multiplane GS algorithm used in this case was run in a custom-designed C++ software interface, Wavefront Designer 20 .
Two-colour HiLo imaging system
High-resolution multiplane fluorescence imaging of zebrafish larvae was achieved by coupling an optical set-up for two-colour HiLo microscopy 46 to the Olympus IX71 microscope. Two continuous wave 473-nm (Laser Quantum, Ciel 350 mW) and 561-nm (CNI laser, MGL-N-561-500 mW) lasers were co-aligned in the same optical path with the dichroic mirror D2 (Semrock, Di02-R514) and collimated with lenses L6 ( f 6 =125 mm), L7 ( f 7 =150 mm) and L10 ( f 10 =35 mm) to illuminate an oscillating diffuser plate (Optotune LSR-3005-10) that was imaged through lenses L8 ( f 8 =75 mm) and L9 ( f 9 =200 mm) at the back aperture of the excitation objective, OBJ1 ( Supplementary Fig. 11 ). The D1 dichroic mirror reflected the collected fluorescence to a CMOS camera (Hamamatsu Photonics, Orca Flash 4.0-V2) through the appropriate filter cube (FC2) for green (dichroic mirror Semrock FF495-Di02, emission filter Semrock FF01-520/35-25) or red fluorescence (dichroic mirror Semrock Di02-R561, emission filter Semrock FF595-Di02). The sectioned image was computed with custom scripts written in MATLAB 65 . The cutoff frequency used to merge the low- and high-frequency components was chosen such as k c ≈0.1 k low , where k low is the frequency of the low-pass filter applied to the uniform illumination image. With those parameters, we measured an axial resolution of 3.2-μm FWHM for the emitted fluorescence ( Supplementary Fig. 11b ). The axial resolution was measured using a Rhodamine-6G thin layer. First, we recorded a z -stack with uniform illumination (oscillating diffuser on) and then with speckle illumination (oscillating diffuser off). The two stacks were then processed in MATLAB to generate an axially resolved HiLo z -stack using algorithms previously described 34 65 . The axial resolution shown in Supplementary Fig. 11 is the axial resolution measured on the processed HiLo z -stack. 2P galvo-based scanning imaging system 2P imaging of photoconverted zebrafish larvae in the brain performed by a mode-locked Ti-Sapphire laser source (Coherent Chameleon Vision II, pulse width 140 fs, tuning range 680–1,080 nm). The femtosecond pulsed beam was raster-scanned on the sample via a pair of xy galvanometric mirrors (3 mm aperture, 6215H series, Cambridge Technology) imaged at the back aperture of the microscope objective (× 40 W APO NIR, Nikon) through an afocal telescope (scan lens: f =100 mm, tube lens: f =300 mm). Galvanometric mirrors were driven by two servo drivers (MicroMax series 671, Cambridge Technology) controlled by a Digital/Analog converter board (PCI-6110, National Instrument). Emitted fluorescence was collected by a fibre-coupled detection scheme 66 . The fibre exit was imaged on two photomultiplier tubes GaAsP (H10770-40 SEL, Hamamatsu Photonics, active area 5 mm) by a set of three matching asphere lenses ( f =23.5 mm, Melles Griot #LAG-32.5-23.5-C). Following the fibre exit, fluorescence light was filtered with an infrared-light-blocking filter (FF01-750sp, Semrock), split into two channels by a dichroic mirror (FF555-Di03, Semrock) and detected through two emission filters (FF01-510/84 and FF02-617/73, Semrock). The whole system was built around a commercial upright microscope (SliceScope, Scientifica). 2P imaging laser power was tuned by combining an electrically controlled liquid crystal variable phase retarder (LRC-200-IR1, Meadowlark Optics) and a polarizer cube (BB-050-IR1, Meadowlark Optics) at the exit of the laser source. Green and red fluorescence z -stacks of photoconverted Kaede in the zebrafish brain were acquired by scanning the excitation beam (780 nm) at 0.74 Hz (full frame) and averaging 10–20 frames for each plane.
Photoconversion protocol
First, a HiLo z-stack in the green channel (200 × 200 × 100 μm 3 ) was recorded to map the location of neuronal cells for photoconversion. On the basis of these images, we calculated phase holograms that produced the corresponding 2D or 3D illumination patterns. We typically used 5-μm-diameter holographic spots to target single cells and 30–35-μm-diameter holographic spots to target sets of neurons. In order to quantify the efficiency of photoconversion, we also recorded the corresponding z-stack in the red channel before photoconversion. Simultaneous 2P photoconversion ( λ phot =800 nm) of all targets was performed while monitoring the fluorescence in the red channel. We typically observed a tenfold increase of red fluorescence in the targeted cells. Photoconversion during fluorescence imaging was minimized by keeping the total acquisition time below 2 min and laser power at the sample plane below 20 mW. To minimize thermal damage during photoconversion, we delivered trains of 50-ms pulses, low laser intensity ∼0.04–4.0 mW μm −2 (power densities are always given relatively to the area of the spots' surface) for periods of time that ranged from 200 ms to a few hundred seconds depending on the laser intensity.
Transgenic lines
Experiments were performed on Danio rerio larvae between 2 and 6 days post fertilization following procedures approved by the Institutional Ethics Committee Darwin in the ‘Institut du Cerveau et de la Moelle épinière' (ICM). AB and TL strains of wild-type (WT) larvae were obtained from laboratory's stock of adults. Embryos and larvae were raised in an incubator at 28.5 °C until shortly before recordings were performed. For photoconversion experiments, we used Tg(HuC:gal4; UAS:kaede) 43 where the HuC promoter drives pan-neuronal expression of Gal4 and Kaede at the larval stage. Tg(pkd2l1:gal4; UAS:ChR2-H134R-mCherry; UAS:GCaMP5G) 65 67 were used for combination of optogenetics and calcium imaging in Supplementary Data . Before performing image acquisitions, embryos were dechorionated and screened for fluorescence at 1 days post fertilization. Larvae screened for Kaede fluorescence were later embedded laterally in 1.5% agarose. Larvae were anaesthetized in 0.02% tricain (MS-222, Sigma-Aldrich, USA).
Data availability
The data that support the findings of this study are available from the corresponding author upon request.
Photoconversion protocol
First, a HiLo z-stack in the green channel (200 × 200 × 100 μm 3 ) was recorded to map the location of neuronal cells for photoconversion. On the basis of these images, we calculated phase holograms that produced the corresponding 2D or 3D illumination patterns. We typically used 5-μm-diameter holographic spots to target single cells and 30–35-μm-diameter holographic spots to target sets of neurons. In order to quantify the efficiency of photoconversion, we also recorded the corresponding z-stack in the red channel before photoconversion. Simultaneous 2P photoconversion ( λ phot =800 nm) of all targets was performed while monitoring the fluorescence in the red channel. We typically observed a tenfold increase of red fluorescence in the targeted cells. Photoconversion during fluorescence imaging was minimized by keeping the total acquisition time below 2 min and laser power at the sample plane below 20 mW. To minimize thermal damage during photoconversion, we delivered trains of 50-ms pulses, low laser intensity ∼0.04–4.0 mW μm −2 (power densities are always given relatively to the area of the spots' surface) for periods of time that ranged from 200 ms to a few hundred seconds depending on the laser intensity.
Supplementary Material Supplementary Information Supplementary Figures 1-14, Supplementary Notes 1-3 and Supplementary References. Supplementary Movie 1 3D-CGH, Volumetric reconstruction of three-dimensional distribution of 5-μm diameter holographic spots.
📊 Figures
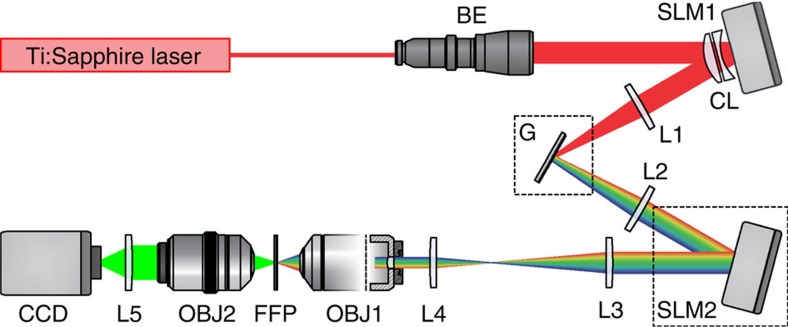
Figure 1
Experimental set-up for 3D-CGH-TF.
The output beam of a Ti:Sapphire laser is magnified using a beam expander (BE) and projected on a first SLM (SLM1). SLM1 modulates the beam's phase so that light forms a user-defined intensity pattern...
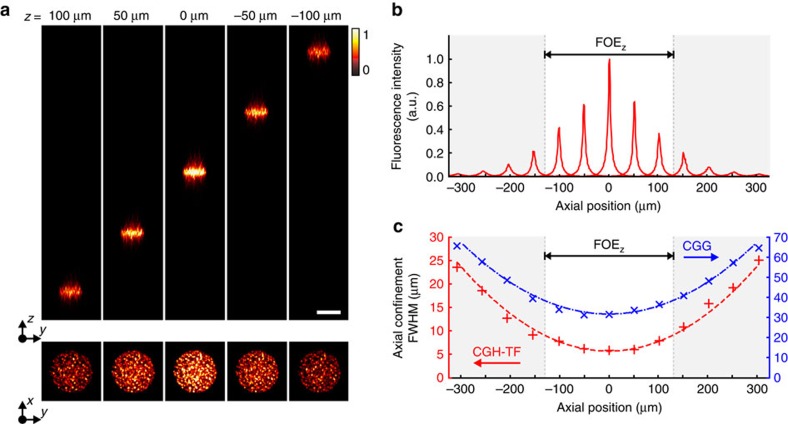
Figure 2
Axial displacement of spatiotemporally focused patterns.
( a ) Axial displacement of a 20-u03bcm-diameter temporally focused holographic spot. Top, orthogonal maximum fluorescence intensity projection of the spot, for axial displacements of u00b150 andu00b1...
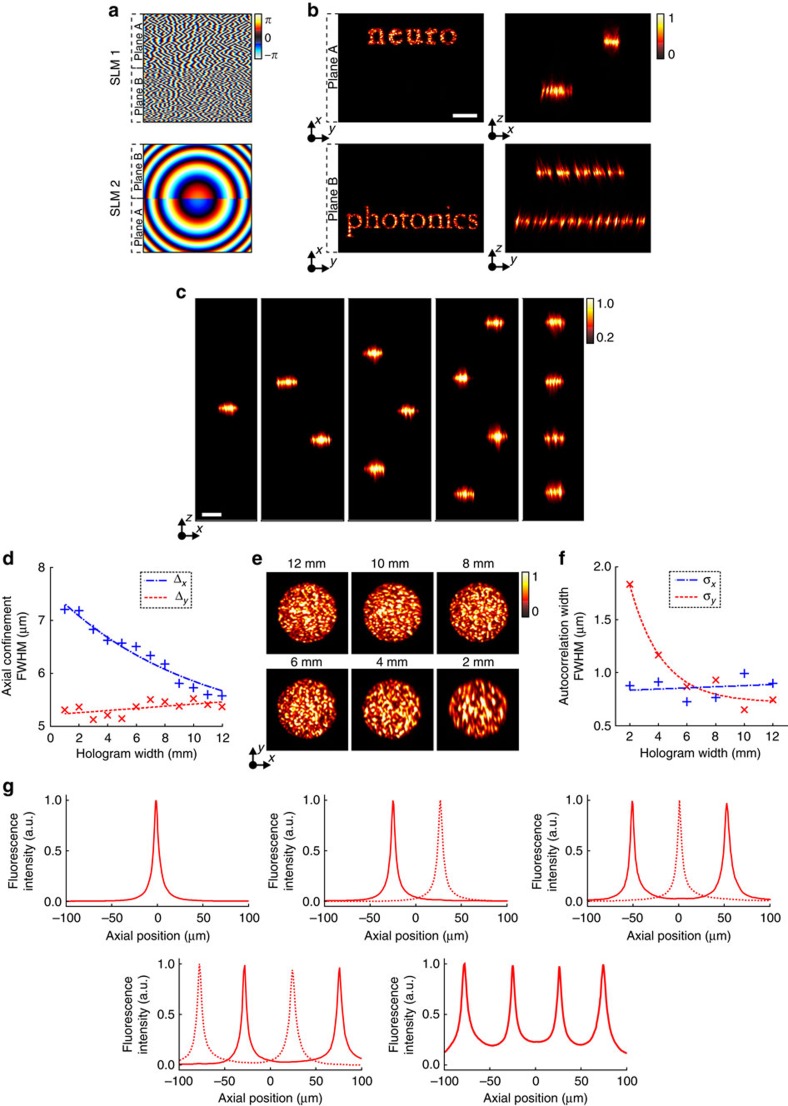
Figure 3
Multiplane spatiotemporally focused pattern generation.
( a ) Top, tiled phase profiles addressed to SLM1 for encoding the words u2018neuro' (plane A) and u2018photonics' (plane B). Bottom, Fresnel lens-phase profiles addressed to SLM2 to axially displace ...
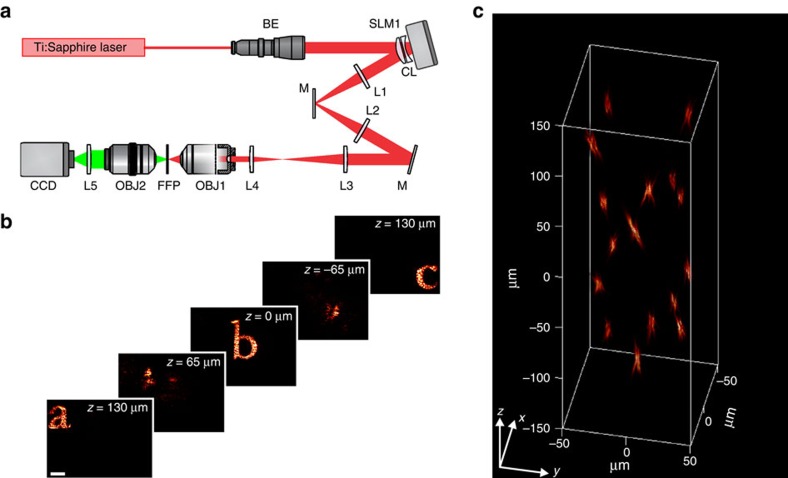
Figure 4
3D-CGH.
( a ) Schematic of the optical set-up for 3D-CGH. In this case the diffraction grating G and SLM2 were replaced by mirrors. ( b ) 2P fluorescence images of 3D-CGH patterns, depicting the letters u2018...
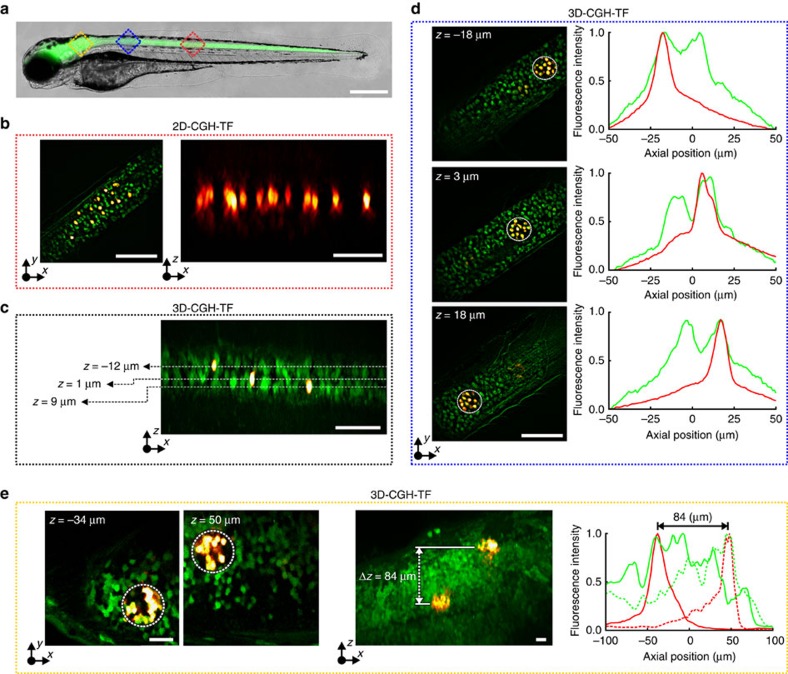
Figure 5
3D simultaneous 2P photoconversion of Kaede in vivo .
( a ) Merged brightfield and widefield fluorescence images of a double transgenic Tg(HuC:gal4; UAS:kaede) zebrafish larvae. Red and blue squares represent the approximate areas where we performed phot...
Figure images are served from the NIH/NLM PubMed Central Open Access Subset or Europe PMC; copyright remains with the publishers and authors.
💬 Discussion
0 commentsNo comments yet. Be the first to start a discussion!
Leave a Comment