Abstract
AbstractThe dynamic behaviour of supramolecular systems is an important dimension of their potential functions. Here, we report on the use of stochastic optical reconstruction microscopy to study the molecular exchange of peptide amphiphile nanofibres, supramolecular systems known to have important biomedical functions. Solutions of nanofibres labelled with different dyes (Cy3 and Cy5) were mixed, and the distribution of dyes inserting into initially single-colour nanofibres was quantified using correlative image analysis. Our observations are consistent with an exchange mechanism involving monomers or small clusters of molecules inserting randomly into a fibre. Different exchange rates are observed within the same fibre, suggesting that local cohesive structures exist on the basis of β-sheet discontinuous domains. The results reported here show that peptide amphiphile supramolecular systems can be dynamic and that their intermolecular interactions affect exchange patterns. This information can be used to generate useful aggregate morphologies for improved biomedical function.
🔬 Techniques
🔭 Microscopes
💻 Software
✨ Fluorophores
🏭 Microscope Brands
🧪 Reagent Suppliers
📷 Detectors
💻 Software Details
🏛️ Research Organizations (ROR)
Affiliated research institutions:
📋 Methods
Peptide synthesis and purification
PAs were synthesized using standard Fmoc solid-phase peptide synthesis. MBHA rink amide resin, Fmoc-protected amino acids and other solid-phase peptide synthesis reagents were purchased from Novabiochem (USA). Cyanine dyes were supplied by Cyandye (USA). ACS-grade solvents were used for synthesis. Water was purified on an EMD Milipore Milli-Q Integral Water Purification System. For each amino acid coupling, 4.1 equiv of Fmoc-protected amino acid was activated for 1 min with 4 equiv of HBTU (O-benzotriazole- N , N , N ′, N ′-tetramethyluroniumhexafluorophosphate) and 6 equiv DIPEA ( N , N -diisopropylethylamine) in 20 ml DMF. The coupling cocktail was then added to 0.5 mmol of MBHA rink resin and reacted for 1 h. Fmoc removal was performed with 30% piperidine in DMF. Fmoc-Glu(OtBu)-OH (N-α-Fmoc- L -glutamic acid γ-t-butyl ester) (3 × ), and Fmoc-Ala-OH (N-α-Fmoc- L -alanine) (6 × ) were successively coupled to the resin. Finally, the palmitic acid tail (8.1 equiv) was coupled using 8 equiv of HBTU and 12 equiv DIPEA in DMF/DCM (50:50). PAs were cleaved from the resin using a cleavage solution of 95% TFA, 2.5% TIPS (triisopropylsilane) and 2.5% H 2 O. Cleavage solution was concentrated by rotary evaporation and the PA precipitated in cold diethyl ether. The crude solid was dissolved in a diluted NH 4 OH aqueous solution (∼10 mg ml −1 ) and purified by preparative-scale reversed-phase HPLC on a Varian Prostar 210 HPLC system, using acetonitrile/water gradient containing 0.1% NH 4 OH. All eluents and additives were HPLC grade. Separation was achieved using a Phenomenex C18 Gemini NX column (150 × 30 mm) with 5 μm particle size and 110 Å pore size. Product-containing fractions were confirmed by ESI mass spectrometry (Agilent 6510 Q-TOF LC/MS) and combined. ACN was removed by rotary evaporation, lyophilized to yield a white solid product and stored at −30 °C. Cyanine dye coupling PAs labelled with cyanine dyes were synthesized first coupling Fmoc-Lys(Mtt)-OH ( N -α-Fmoc- N -ɛ-4-methyltrityl- L -lysine) to the resin. The rest of the synthetic procedure proceeded as described above. After coupling the palmitic acid tail, Lys(Mtt) was selectively deprotected with 3% TFA, 5% TIPS and 92% DCM for 5 min (3 × ), to expose the side chain amine moiety.
Show full methods section
Peptide synthesis and purification
PAs were synthesized using standard Fmoc solid-phase peptide synthesis. MBHA rink amide resin, Fmoc-protected amino acids and other solid-phase peptide synthesis reagents were purchased from Novabiochem (USA). Cyanine dyes were supplied by Cyandye (USA). ACS-grade solvents were used for synthesis. Water was purified on an EMD Milipore Milli-Q Integral Water Purification System. For each amino acid coupling, 4.1 equiv of Fmoc-protected amino acid was activated for 1 min with 4 equiv of HBTU (O-benzotriazole- N , N , N ′, N ′-tetramethyluroniumhexafluorophosphate) and 6 equiv DIPEA ( N , N -diisopropylethylamine) in 20 ml DMF. The coupling cocktail was then added to 0.5 mmol of MBHA rink resin and reacted for 1 h. Fmoc removal was performed with 30% piperidine in DMF. Fmoc-Glu(OtBu)-OH (N-α-Fmoc- L -glutamic acid γ-t-butyl ester) (3 × ), and Fmoc-Ala-OH (N-α-Fmoc- L -alanine) (6 × ) were successively coupled to the resin. Finally, the palmitic acid tail (8.1 equiv) was coupled using 8 equiv of HBTU and 12 equiv DIPEA in DMF/DCM (50:50). PAs were cleaved from the resin using a cleavage solution of 95% TFA, 2.5% TIPS (triisopropylsilane) and 2.5% H 2 O. Cleavage solution was concentrated by rotary evaporation and the PA precipitated in cold diethyl ether. The crude solid was dissolved in a diluted NH 4 OH aqueous solution (∼10 mg ml −1 ) and purified by preparative-scale reversed-phase HPLC on a Varian Prostar 210 HPLC system, using acetonitrile/water gradient containing 0.1% NH 4 OH. All eluents and additives were HPLC grade. Separation was achieved using a Phenomenex C18 Gemini NX column (150 × 30 mm) with 5 μm particle size and 110 Å pore size. Product-containing fractions were confirmed by ESI mass spectrometry (Agilent 6510 Q-TOF LC/MS) and combined. ACN was removed by rotary evaporation, lyophilized to yield a white solid product and stored at −30 °C. Cyanine dye coupling PAs labelled with cyanine dyes were synthesized first coupling Fmoc-Lys(Mtt)-OH ( N -α-Fmoc- N -ɛ-4-methyltrityl- L -lysine) to the resin. The rest of the synthetic procedure proceeded as described above. After coupling the palmitic acid tail, Lys(Mtt) was selectively deprotected with 3% TFA, 5% TIPS and 92% DCM for 5 min (3 × ), to expose the side chain amine moiety.
Disulfo-cyanine carboxylic acid dyes
(Cy3 and Cy5) were dissolved in DMF and stock solutions were stored at -30 °C. (Benzotriazol-1-yloxy)tripyrrolidinophosphonium hexafluorophosphate (PyBOP) was also dissolved in DMF. Cyanine dyes (1 equiv) were activated with PyBOP (1 equiv) and DIPEA (2 equiv) for 1 min and coupled to the lysine-free amine. Cy3- and Cy5-labelled PAs were cleaved and purified as described above. Lyophilization yielded a red powder for Cy3 and blue for Cy5. Purity Purity was determined by reversed-phase analytical HPLC (see Supplementary Figs 7–9 ) using a Phenomenex Gemini C18 column (100 × 4.6 mm), with 5 μm particle size and 110 Å pore size, connected to a HPLC system equipped with an autosampler (Shimadzu SIL-20A XR), degasser (Shimadzu DGU-20A3) and a high-pressure gradient system comprising two LC-20AD XR pumps (Shimadzu). Separation was performed at a flow of 1 ml min −1 and using a 20-60% acetonitrile linear gradient in water containing 0.1% NH 4 OH. All eluents and additives were HPLC grade. Peptides, cyanine dye-coupled peptides and eventual contaminants were detected using a PDA (Shimadzu SPD-M20A), acquiring a full ultraviolet-visible spectrum between 200 and 750 nm at any time point. Main chromatogram peaks were collected and product mass confirmed by ESI mass spectrometry using a LCQ Deca XP Max (Thermo Finnigan) ion-trap mass spectrometer. For that, samples were manually injected bypassing the column at a flow rate of 0.20 ml min −1 and positive ion mass spectra were acquired in standard enhanced mode.
Sample preparation
Stock solutions of non-labelled PA (10 mM), Cy3-labelled PA (1 mM) and Cy5-labelled PA (1 mM) were prepared in Milli-Q water, aliquoted and stored at −30 °C. Similar to other anionic PA systems, these formed hydrogels in the presence of CaCl 2 . The degree of labelling of the fibres was accurately controlled by simply mixing PA stock solutions at the desired ratio. Solutions of non-labelled PA were mixed with aqueous solutions of either one or both labels at certain mole ratios, flash-frozen in liquid nitrogen and lyophilized. The obtained PA mixture was molecularly dissolved in TFA and readily evaporated under vacuum. The obtained material was redissolved in NH 4 OH (aq.), flash-frozen and further lyophilized. These two last steps resembled the cleavage and purification conditions, respectively. These steps were undertaken to provide molecular mixing, as well as to reset PA self-assembly history. Non-labelled PA was treated using the same method before measurements where the fluorescence-labelled molecules were absent. The obtained powders were reconstituted in appropriate buffers before measurements. After the harsh acidic conditions (dissolution in TFA) used to create a homogenous molecular mixture, PAs were checked by analytical HPLC to rule out potential degradation of the original molecules. Analytical HPLC was performed as described above. Supplementary Fig. 10 shows that the PA does not degrade during the harsh procedure of molecular mixing in TFA.
Fluorescence measurements showed pronounced
FRET for nanofibres labelled with both Cy3 and Cy5. The FRET intensity increased with concentration of acceptor. This indicates that the sample preparation is suitable to assure co-assembly of the three PAs in a single supramolecular object.
Circular dichroism spectroscopy
Circular dichroism spectra were recorded using Jasco Circular Dichroism Spectrometer (model J-715). PA was dissolved in water at 10 mM. Before each measurement, PA stock solution was diluted in appropriate buffers to yield a final PA concentration of 0.1 mM. A quartz cuvette of 1 mm path length was used for the measurements. Each trace represents the average of five scans.
Cryogenic transmission electron microscopy
PA nanofibres were separately labelled with either PA-Cy3 (5%) or PA-Cy5 (5%). Both labelled and non-labelled PA nanofibres were dissolved at 1 mg ml −1 in 10 mM HEPES buffer (pH 7.5, NaCl 150 mM). CryoTEM was performed using a JEOL 1230 TEM at an accelerating voltage of 100 kV. Using a Vitrobot Mark IV (FEI) vitrification instrument at 25 °C with 100% humidity, a 6.5-μl drop of the sample was deposited on a 300-mesh copper grid with lacey carbon support (Electron Microscopy Sciences, EMS), blotted twice, plunge-frozen in liquid ethane, then stored in liquid N 2 . For imaging, the sample was transferred to a Gatan 626 cryo-holder under liquid N 2 , and images were obtained with a Gatan 831 CCD camera. Critical micelle concentration by Nile Red assay Nile Red is a hydrophobic solvatochromic dye (water soluble at low concentration) with high affinity to the hydrophobic pocket of micelles. In aqueous environment, the molecule is weakly fluorescent. In hydrophobic environments, fluorescence intensity is around 300 times higher and a pronounced blue shift is observed. Therefore, Nile Red is commonly used to probe the existence of hydrophobic pockets formed by surfactants in aqueous environment 38 . Briefly, a Nile Red 2 mM stock solution was prepared in MeOH. Non-labelled PA was dissolved at 10 mM in 10 mM HEPES buffer (pH 7.5, NaCl 150 mM). PA solution was diluted serially to obtain concentrations in the range 200 nM-10 mM. Nile Red stock solution was diluted in the same buffer to obtain a final concentration of 1 μM. Equal volumes of Nile Red aqueous diluted solution and PA solutions were mixed for each PA concentration. Solutions were aged for 24 h to assure full nanofibre disassembly at concentrations below the critical micelle concentration. Fluorescence-emission spectra (excitation 550 nm) were recorded for an emission range between 570 and 700 nm. The maximum intensity and respective wavelength at maximum intensity were both represented as a function of the logarithm of the PA concentration. At concentrations close to critical micelle concentration, it should be observed a sharp increase in fluorescence intensity and a hypsochromic effect. Förster resonance energy transfer Single-colour PA nanofibres labelled with either Cy3 or Cy5 at 1 mol% were assembled in 10 mM HEPES buffer (pH 7.5, NaCl 150 mM). Fluorescence spectra were recorded in a Varian Cary Eclipse Fluorimeter from Agilent Technologies. Emission spectra were acquired using excitation wavelengths of 520 or 615 nm for Cy3 or Cy5, respectively. Excitation spectra were collected using emission wavelengths of 600 or 710 nm for Cy3 or Cy5, respectively. Temperature was kept at 20°C using the in-built peltier system. Supplementary Fig. 11a depicts the spectra of the individually labelled PA nanofibres, showing significant overlap between Cy3 emission (donor) and Cy5 excitation (acceptor). On an independent measurement, PA nanofibres labelled with both Cy3 (1 mol%) and Cy5 (0, 0.1, 0.2 and 0.5 mol%) were assembled in 10 mM HEPES buffer (pH 7.5, NaCl 150 mM) at a final PA concentration of 0.5 mM.
Fluorescence-emission spectra of dual-labelled
PAs were recorded at the excitation wavelength of Cy3 520 nm, at which direct excitation of Cy5 is negligible. Supplementary Fig. 11b shows considerable energy transfer by FRET, which increases monotonically with acceptor concentration, providing evidence for co-assembly of both Cy3- and Cy5-labelled PAs in the same nanofibres. Ensemble molecular exchange kinetics For molecular exchange kinetic experiments, two sets of PA nanofibres were pre-assembled from a mixture of non-labelled PAs and either Cy3 (0.5%) or Cy5 (0.5%). These independently labelled PA solutions were mixed at 1:1 ratio in a 50 μl quartz cuvette and fluorescence was followed over around 24 h (lag time ∼30 s). FRET ratio was determined by dividing Cy5 emission at 668 nm by Cy3 emission at 565 nm, at the Cy3 excitation wavelength (520 nm). The contribution of Cy3 emission at 668 nm was first subtracted from the Cy5 emission. At the beginning of the kinetics experiment, Cy3-PA and Cy5-PA are distributed in different nanofibres, being physically separated by distances much higher than the expected FRET radius 35 . Therefore, energy transfer at time zero should be negligible and, consequently, FRET ratio should be zero. A total PA concentration range of 0.5–5 mM was used. Kinetics was recorded at two different temperatures (20 or 37 °C).
Sample preparation for microscopy
Glass microscope coverslips were cleaned by successively immersing in acetone, isopropanol and Milli-Q water. Bath sonication was performed for 10 min with each solvent, followed by drying under N 2 flow. The glass coverslips were then etched with a fresh Piranha solution (3:1 v/v H 2 SO 4 (98%):H 2 O 2 (30%)) for 30 min. To finish the cleaning procedure, the slides were washed thoroughly with Milli-Q water and rinsed with acetone before drying under N 2 flow. To determine the labelled PA distribution along the nanofibres length, single fibres should be immobilized on a glass surface, and remain still during STORM acquisition. A flow chamber was assembled using a glass slide and a clean coverslip separated by double-sided tape. PA nanofibres were immobilized by adsorption onto the surface of the clean coverslip by flushing diluted PA solutions at high ionic strength (NaCl 1 M). After incubation for 1 min, the unbound nanofibres were washed out of the chamber by flushing with HEPES buffer (2 × ) followed by STORM buffer (2 × ). STORM buffer is composed by 50 mM HEPES buffer (pH=8.5), 1 M NaCl, an oxygen-scavenging system (0.5 mg ml −1 glucose oxidase, 40 μg ml −1 catalase, 5 wt% glucose) and 200 mM 2-aminoethanethiol. The high ionic strength conditions were used to screen the electrostatic repulsion between highly charged PA nanofibres and the glass surface. However, repulsion between PA nanofibres is also reduced, causing fibre bundling. To avoid bundling, PA solutions were rapidly diluted at low ionic strength (1 μM). After a final (10 × ) dilution step in NaCl 1M, nanofibres were immediately attached on the glass coverslip. At this concentration isolated nanofibres are mainly observed in the microscopic mounting.
Stochastic optical reconstruction microscopy
STORM images were acquired using a Nikon N-STORM system configured for total internal reflection fluorescence imaging. Excitation inclination was tuned to maximize the signal-to-noise ratio of the glass-absorbed fibres. Cy3- and Cy5-labelled samples were illuminated by 561 and 647 nm laser lines. No activation ultraviolet light was used. Fluorescence was collected by means of a Nikon 100 × , 1.4NA oil immersion objective and passed through a quad-band pass dichroic filter (97335 Nikon). All time-lapses were recorded onto a 64 × 64 pixel region (pixel size 0.17 μm) of an EMCCD camera (ixon3, Andor). For each channel, 20,000 frames were sequentially acquired. STORM movies were analysed with the STORM module of the NIS Elements Nikon software. Molecular imaging of fibres during exchange PA nanofibres were separately labelled with either PA-Cy3 (5%) or PA-Cy5 (5%) at 0.5 mM in 10 mM HEPES buffer (pH 7.5, NaCl 150 mM). Subsequently, 250 μl-aliquots of each solution were mixed in a microcentrifuge tube and gently shaken at 37 °C for different amounts of time. At predefined time points, 2 μl of the solution was withdrawn, diluted and adsorbed on a glass surface as described above. We verified that once adsorbed on the slide, fibres are not able anymore to considerably exchange monomers with the solution in the time frame of the experiment. STORM imaging of Cy5 and Cy3 channels was performed sequentially. Fibres that are initially labelled only with Cy3 and incorporate Cy5 monomers over time were selected observing the fluorescence intensity in the low-resolution images. Original single-colour nanofibres were also observed before mixing as a control.
Image analysis During
STORM imaging, the Nikon software generates a list of localizations by 2D Gaussian fitting of blinking chromophores in the acquired movie of conventional microscopic images. This localizations list was subsequently analysed with our custom-made Matlab scripts, as described in detail elsewhere 19 . Briefly, a first script uses a density-based clustering algorithm to automatically identify the fibres in the image and to remove the background. Examples of output localization maps are shown in Figs 3a,b and 5a . A second script is run on the well-reconstructed fibres obtained in the Cy3-channel to find the fibre backbone. The lower localization density obtained in the Cy5-channel for shorter time periods in the molecular exchange experiment is not enough to fully reconstruct the nanofibres. The polymer backbone coordinates are used to obtain structural information. Next, histograms of localization density profiles along the backbone are generated for both channels, as shown in Figs 3c,d and 5b . The spatial autocorrelation (that is, the average correlation between the localization density at one backbone point in the fibre and the density at another backbone point, as a function of the distance between these points) was also computed using the Matlab-function xcov with unbiased normalization. The spatial cross-correlation of the two channels was calculated in a similar manner. Averaging over multiple fibres is required to obtain accurate correlation decay graphs, such as depicted in Figs 3e,f and 6 . Investigation of the average correlation decays yields the distribution of dyes in a fibre, without interference from the stochastic fluctuations inherent to the technique.
Supplementary Material Supplementary Information Supplementary Figures 1-11
📊 Figures
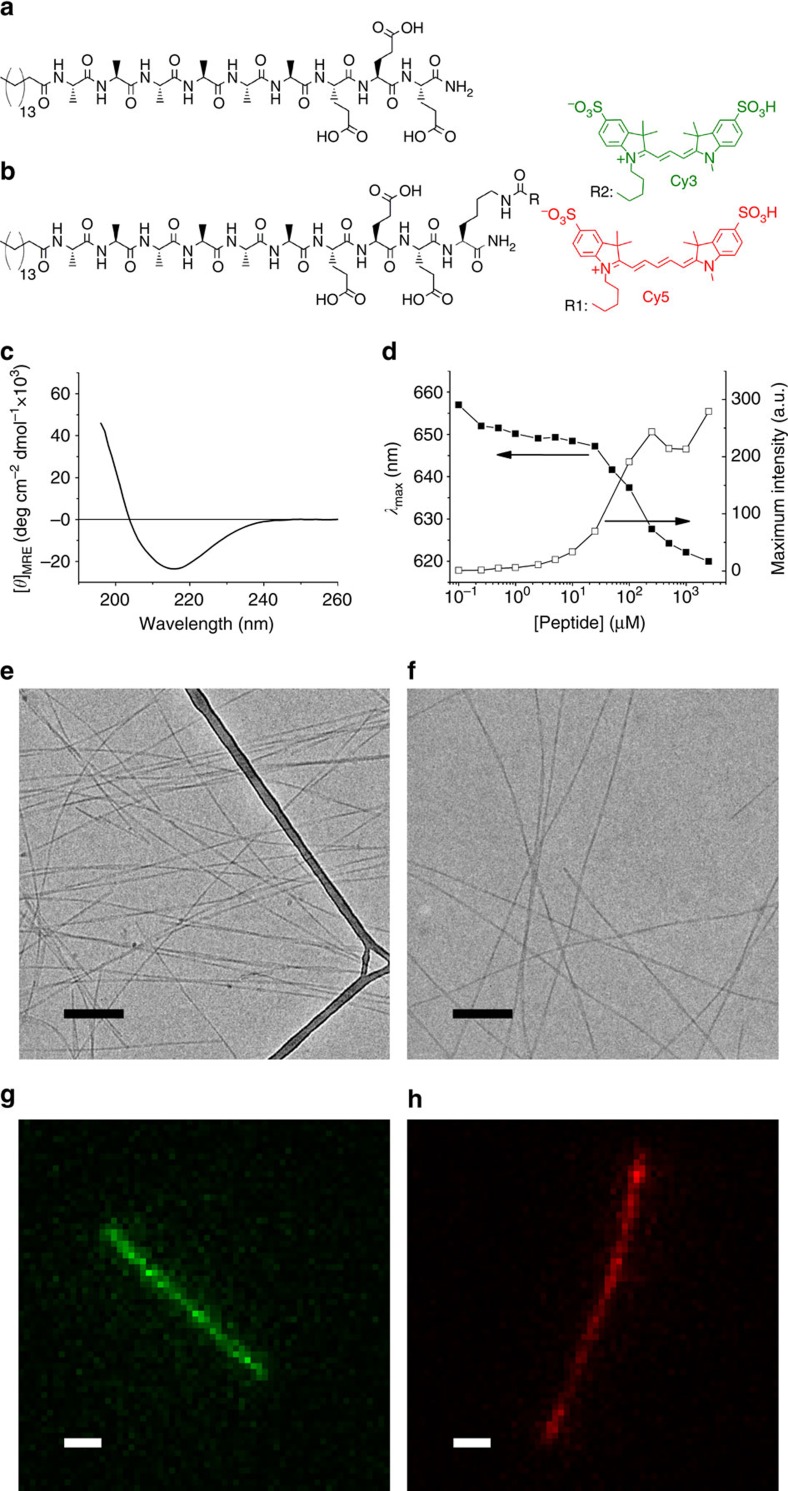
Figure 1
PA self-assembly.
Molecular structure of ( a ) non-labelled PA and ( b ) PA molecules labelled with photo-switchable sulfonated cyanine dyes, namely Cy3 (green) and Cy5 (red). ( c ) Circular dichroism spectrum and ( d ...
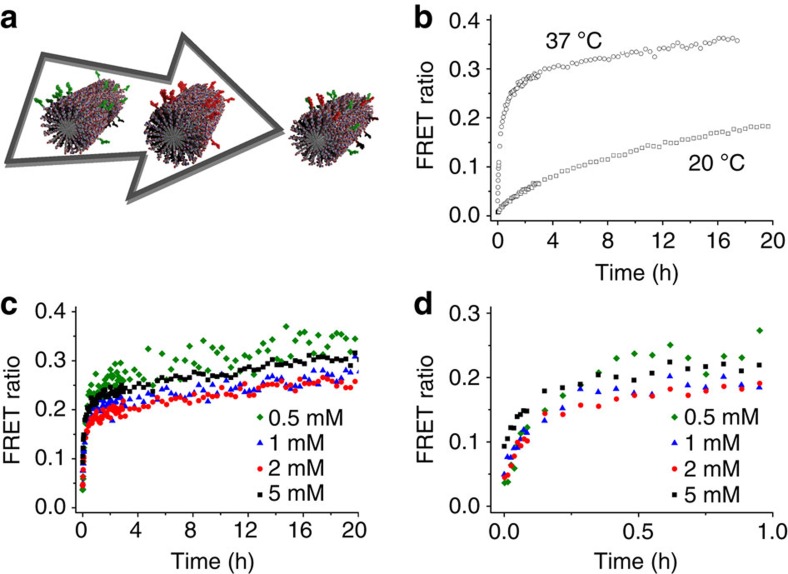
Figure 2
Molecular exchange by FRET.
( a ) Schematic representation of a molecular exchange kinetic measurement. The molecular exchange progress over time is estimated by means of FRET ratio (dividing Cy5 by Cy3 fluorescence intensities)...
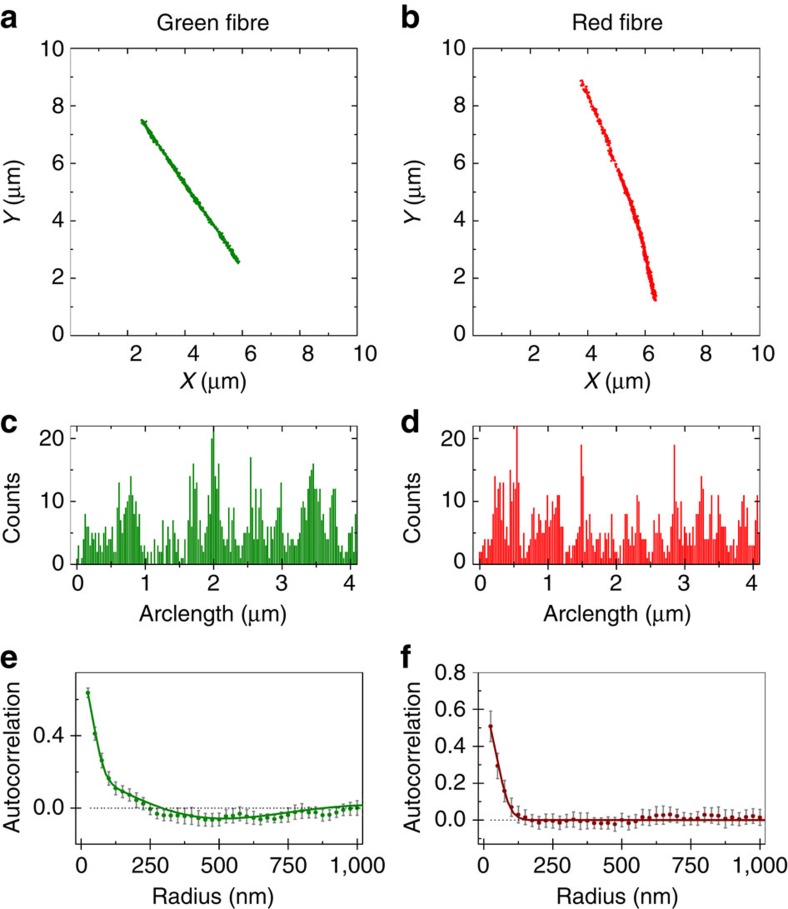
Figure 3
STORM analysis of single-colour nanofibres.
PA nanofibres were labelled with 5u2009mol% of either Cy3-PA ( a , c , e ) or Cy5-PA ( b , d , f ) before the molecular exchange experiment. Localization maps after applying a clustering algorithm, ba...
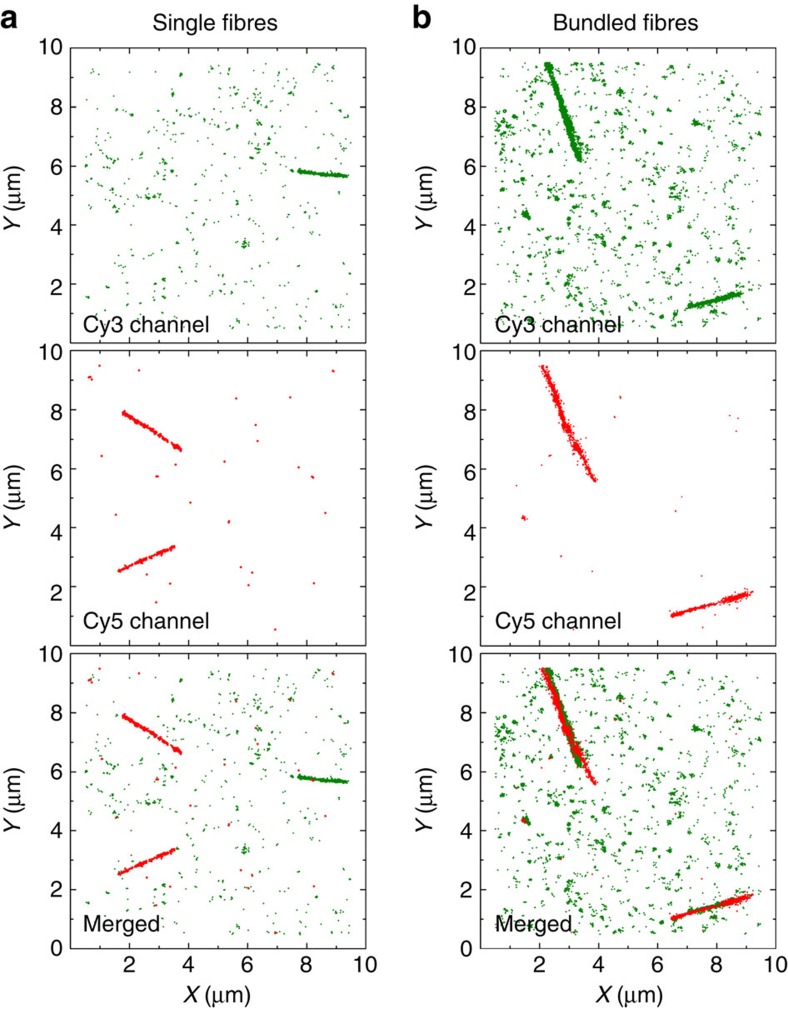
Figure 4
Single fibre attachment.
STORM images (with background) of PA nanofibres attached at a final PA concentration of either ( a ) 0.1u2009u03bcM or ( b ) 1u2009u03bcM, showing single fibres or bundled fibres, respectively. Attach...
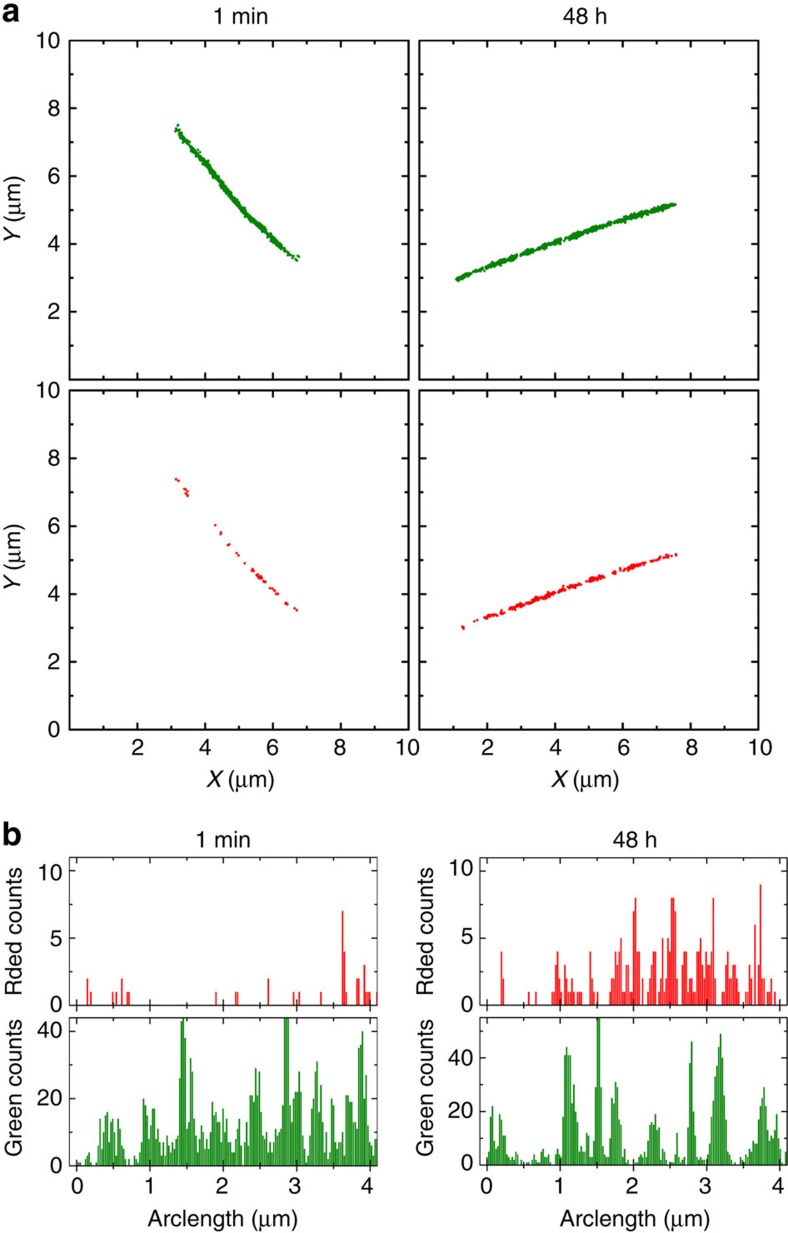
Figure 5
Quantitative analysis of STORM imaging during a molecular exchange experiment.
( a ) Localization maps of PA nanofibres immobilized on a glass coverslip at different time points, after applying a clustering algorithm, background cleaning and backbone finding. The better reconstr...
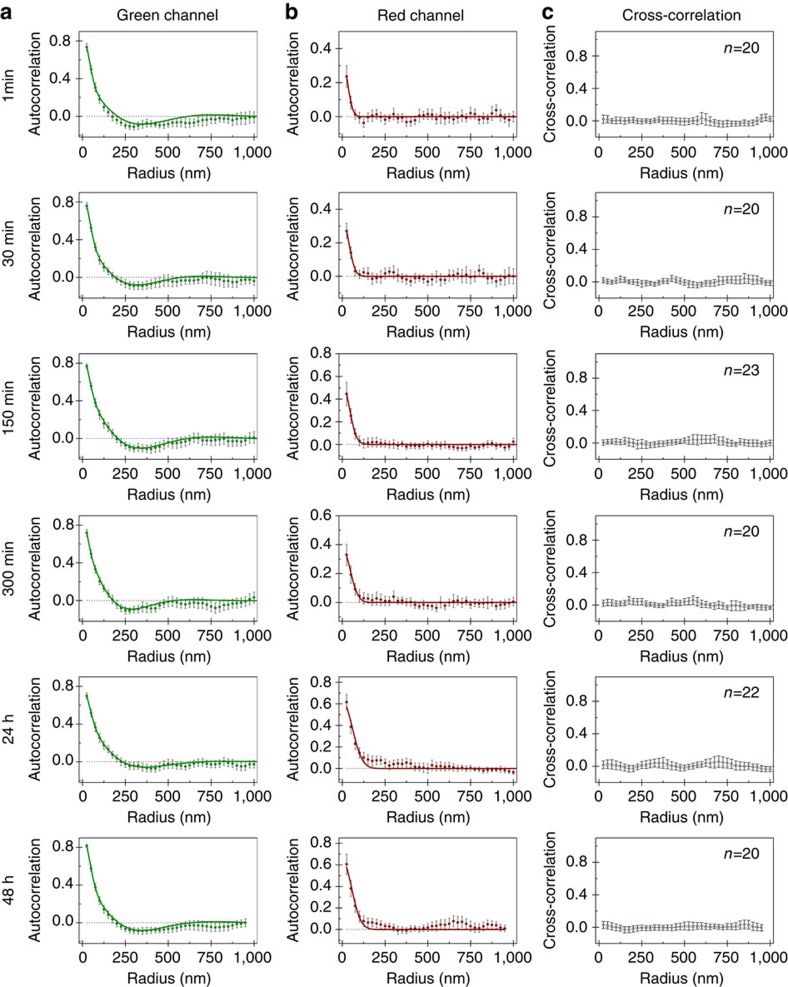
Figure 6
Correlation of cyanine dyes along PA nanofibres initially only labelled with Cy3 during molecular exchange.
Averaged autocorrelation plots for ( a ) Cy3 and ( b ) Cy5-labelled PAs and ( c ) averaged cross-correlation between both dyes. Solid lines correspond to model fittings, namely equation (2) for ( a ) ...
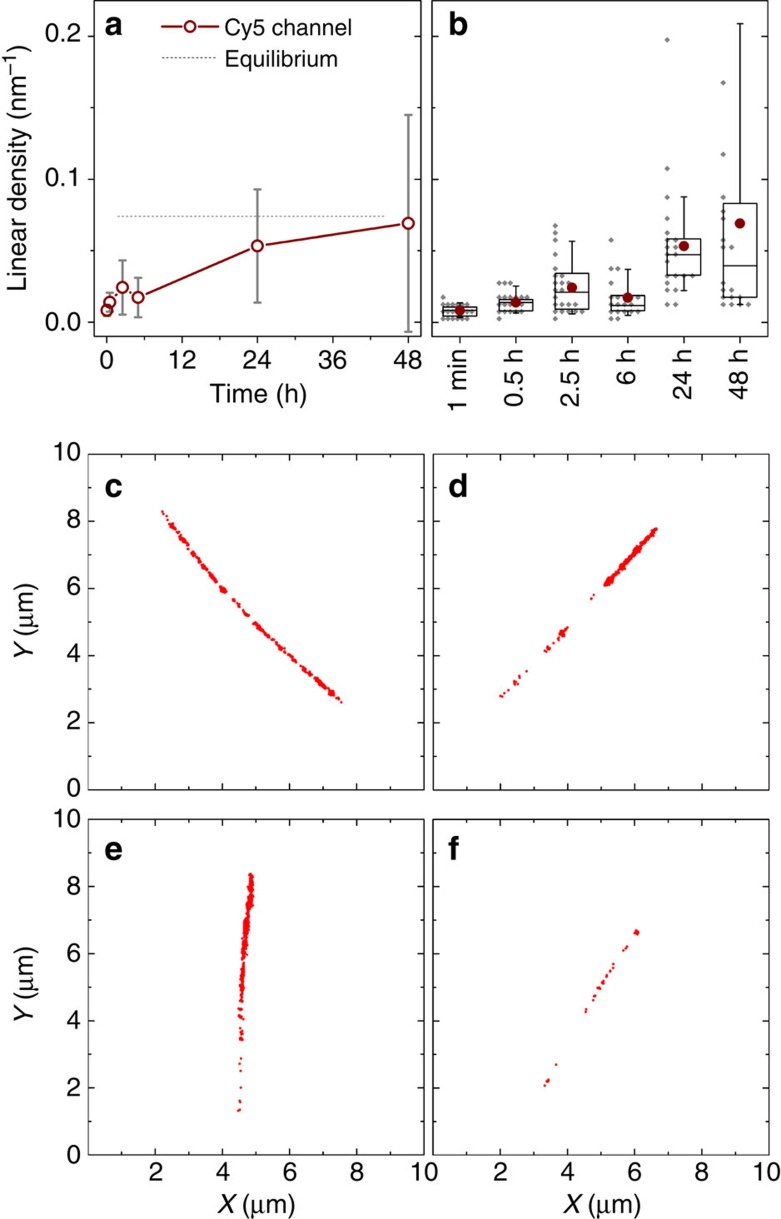
Figure 7
PA molecular exchange kinetics estimated using the linear density of localizations calculated from STORM data.
( a ) Time course-averaged density of red dye (Cy5) on fibres that were initially only labelled with green dyes (Cy3) ( n u2a7e20, error bars correspond to standard deviation). The equilibrium guideli...
Figure images are served from the NIH/NLM PubMed Central Open Access Subset or Europe PMC; copyright remains with the publishers and authors.
💬 Discussion
0 commentsNo comments yet. Be the first to start a discussion!
Leave a Comment