Abstract
AbstractA major goal of cancer nanotherapy is to use nanoparticles as carriers for targeted delivery of anti-tumour agents. The drug–carrier association after intravenous administration is essential for efficient drug delivery to the tumour. However, a large number of currently available nanocarriers are self-assembled nanoparticles whose drug-loading stability is critically affected by thein vivoenvironment. Here we usedin vivoFRET imaging to systematically investigate how drug–carrier compatibility affects drug release in a tumour mouse model. We found the drug’s hydrophobicity and miscibility with the nanoparticles are two independent key parameters that determine its accumulation in the tumour. Next, we applied these findings to improve chemotherapeutic delivery by augmenting the parent drug’s compatibility; as a result, we achieved better antitumour efficacy. Our results help elucidate nanomedicines’in vivofate and provide guidelines for efficient drug delivery.
🔬 Techniques
🔭 Microscopes
💻 Software
✨ Fluorophores
🧪 Sample Preparation
🔬 Cell Lines
🏭 Microscope Brands
🧪 Reagent Suppliers
💻 Software Details
🏛️ Research Organizations (ROR)
Affiliated research institutions:
📋 Methods
Calculating hydrophobicity and miscibility Molecules' hydrophobicity was represented by the their distribution coefficients (log D ) at pH=7.4, which were predicted using the ACD/Labs Percepta Predictor (Advanced Chemistry Development, Inc.). The miscibility between the drug and the polymer matrix was described by Flory–Huggins interaction parameters ( χ drug-poly ), which take into account the energy of interspersing polymer with drug molecules, with smaller values indicating better miscibility 25 48 . This parameter was calculated using the equation: where V is the molar volume of the drug molecule, R is the gas constant, T is the temperature and δ drug and δ poly are the Hildebrand–Scatchard solubility parameter for drug and the polymer matrix, respectively 49 . The values of V , δ drug and δ poly were calculated through the group contribution method and are described in detail in the Supplementary Methods . Synthesizing Cy7-X model drugs loaded nanoparticles The Cy7-X model drugs were synthesized by conjugating a Cyanine7-NHS ester (Lumiprobe GMBH) and a primary amine, dodecylamine for Cy7-C12, oleylamine for Cy7-OLA and PLGA-NH 2 2 kDa for Cy7-PLGA2k. Cy7-CA was used as purchased. The detailed procedures are described in the Supplementary Methods . Cy5.5-conjugated PLGA was synthesized through Steglich esterification between Cy5.5-CA (Lumiprobe) and PLGA (lactide:glycolide, 50:50; molecular weight, 30,000–60,000; Sigma-Aldrich). An estimation of 70% of PLGA chain was conjugated with one Cy7 molecule. Self-assembled Cy5.5-NP:Cy7-X nanoparticles were synthesized through a nano-precipitaion method. In a typical synthesis, 20 mg PLGA-PEG (molecular weight PLGA 4,000, PEG 2,000; Sigma Aldrich), 4.2 mg Cy5.5-PLGA and a calculated amount of Cy7-X were dissolved in acetonitrile at a concentration of 10 mg ml −1 . To form nanoparticles, the acetonitrile solution was dripped into 20 ml PBS at a rate of 0.2 ml min −1 at room temperature under vigorous stirring. The solution was then continuously stirred for 1 h after dripping to induce evaporation of the organic solvent. The produced nanoparticles were purified through a first centrifugation at 18 g for 10 min to remove possible aggregates, and then washed at least three times with fresh PBS with centrifugal concentrators (Millipore, 100,000 molecular weight cutoff) and finally concentrated. Nanoparticles were kept at 4 °C and protected from light until use.
Show full methods section
Calculating hydrophobicity and miscibility Molecules' hydrophobicity was represented by the their distribution coefficients (log D ) at pH=7.4, which were predicted using the ACD/Labs Percepta Predictor (Advanced Chemistry Development, Inc.). The miscibility between the drug and the polymer matrix was described by Flory–Huggins interaction parameters ( χ drug-poly ), which take into account the energy of interspersing polymer with drug molecules, with smaller values indicating better miscibility 25 48 . This parameter was calculated using the equation: where V is the molar volume of the drug molecule, R is the gas constant, T is the temperature and δ drug and δ poly are the Hildebrand–Scatchard solubility parameter for drug and the polymer matrix, respectively 49 . The values of V , δ drug and δ poly were calculated through the group contribution method and are described in detail in the Supplementary Methods . Synthesizing Cy7-X model drugs loaded nanoparticles The Cy7-X model drugs were synthesized by conjugating a Cyanine7-NHS ester (Lumiprobe GMBH) and a primary amine, dodecylamine for Cy7-C12, oleylamine for Cy7-OLA and PLGA-NH 2 2 kDa for Cy7-PLGA2k. Cy7-CA was used as purchased. The detailed procedures are described in the Supplementary Methods . Cy5.5-conjugated PLGA was synthesized through Steglich esterification between Cy5.5-CA (Lumiprobe) and PLGA (lactide:glycolide, 50:50; molecular weight, 30,000–60,000; Sigma-Aldrich). An estimation of 70% of PLGA chain was conjugated with one Cy7 molecule. Self-assembled Cy5.5-NP:Cy7-X nanoparticles were synthesized through a nano-precipitaion method. In a typical synthesis, 20 mg PLGA-PEG (molecular weight PLGA 4,000, PEG 2,000; Sigma Aldrich), 4.2 mg Cy5.5-PLGA and a calculated amount of Cy7-X were dissolved in acetonitrile at a concentration of 10 mg ml −1 . To form nanoparticles, the acetonitrile solution was dripped into 20 ml PBS at a rate of 0.2 ml min −1 at room temperature under vigorous stirring. The solution was then continuously stirred for 1 h after dripping to induce evaporation of the organic solvent. The produced nanoparticles were purified through a first centrifugation at 18 g for 10 min to remove possible aggregates, and then washed at least three times with fresh PBS with centrifugal concentrators (Millipore, 100,000 molecular weight cutoff) and finally concentrated. Nanoparticles were kept at 4 °C and protected from light until use.
Optical measurement and in vitro dynamic experiments
The absorption, emission spectrum and in vitro dynamic experiments were performed on a SpectraMax M5e multi-mode microplate reader (Molecular Devices). In a typical dynamic experiment, 2 ml of Cy5.5-NP:Cy7-X solution at 1 mg ml −1 was loaded in a quartz cuvette and pre-equilibrated at a controlled temperature in the plate reader for at least 10 min. Then 0.4 ml of FBS (Sigma-Aldrich) or human serum (Type AB, Fisher BioReagents) at 5, 10, 25, 50 or 100% dilution pre-equilibrated at the same temperature was quickly added into the cuvette and well mixed through a pipette within 5 s. The time-dependent fluorescence was recorded in kinetic mode in Cy5.5 channel ( λ Exc =620 nm and λ Emi =700 nm) and FRET channel ( λ Exc =620 nm and λ Emi =780 nm) at an interval of 10 s. Fast protein liquid chromatography The FPLC samples were prepared by adding 0.2 ml of 10 mg ml −1 solution of Cy5.5-NP:Cy7-X nanoparticles or Cy5.5-Cy7-NP control particles into 0.8 ml of FBS and incubated at 37 °C for 2 h. After incubation, samples were filtrated with a 0.22-μm pore size membrane, and 25 μl of each sample was injected to the FPLC column. The FPLC system was constructed by a Prominence HPLC system (Shimadzu) equipped with a Superose 6, 10/300 GL FPLC column (GE Healthcare Life Sciences). The samples were then eluted with PBS buffer at a flow rate of 0.6 ml min −1 while the absorbance of eluted solution was monitored at 190–800 nm by a photodiode array detector. Results were processed and analysed with LC solution software (Shimadzu).
Computer simulations
To carry out the SMD simulations, first an all-atom simplified version of the block-copolymer system was constructed. This system consisted of 122 polymer chains, 50% of which were PLGA–PEG block-copolymers, whereas the rest were composed of pure PLGA chains. Next, the polymer chains were hydrated with water molecules 50 , and a 40-ns trajectory of unbiased all-atom molecular dynamics simulations (uMD) was performed to equilibrate the entire system. The final stage of the uMD trajectory was used as the starting point for the SMD simulations. The entire system was positioned so that the direction of the reaction pathway (that is, the direction of the steered motion of the drug) was aligned along the Z -coordinate. To simplify the simulations, a generic drug-like aromatic compound, that is, phenanthrene, was used to replace Cy7. Different tail parts, CA, C12, OLA and PLGA2k were attached to phenanthrene to modify the overall drug properties along the lines of the experimental protocol. In the SMD simulation, each of these drug models was aligned along the Z -coordinate, and force was applied to move the drug models along the reaction coordinate that took them through the different phases of the hydrated block-copolymer systems. The SMD simulations employed the constant velocity algorithm implemented in the NAMD simulation package 51 and CHARMM force field parameters 52 . The velocity was set to 0.0001 Å ps −1 for all the drug models, and the force constant was set to 7.0 kcal mol −1 Å −1 along the direction of the Z -coordinate. A Langevin thermostat and piston were used to maintain the temperature at 300 K and the pressure at 1 atm 53 .
Cell culture and animal model
Information regarding cell lines (human mammary gland/breast cancer cell line MDA-MB-231, murine mammary gland/breast cancer cell line 4T1) and preparation of animal models can be found in the Supplementary Methods . All animal-handling protocols were approved by the Icahn School of Medicine at Mount Sinai Institutional Animal Care and Use Committee.
Intravital microscopy
Preparation of the window chamber mouse model is described in the Supplementary Methods . The imaging experiment was performed on a Leica SP8 confocal laser scanning microscopy using an HC/PL/APO × 10 air objective with 0.4 numerical aperture. Directly after injection of Cy3.5-NP or Cy3.5-NP:Cy5-X (X=C12, OLA and PLGA2k), focus was adjusted to the tumour vasculature that was subsequently imaged. For spectral imaging, 4 mice were subjected to 45 min of sequential spectral imaging at a temporal resolution of 12 s and spatial resolution of 2.27 μm 2 with the filter sets λ Exc =570 nm and λ Em =591, 602, 613, 624, 635, 646, 657, 668, 679, 690 and 701 nm. For high-spatial resolution imaging (1.13 μm 2 ), another 4 mice were subjected to 60-min sequential imaging at a temporal resolution of 3 min. Three optical channels were recorded: Cy3.5 ( λ Exc =570 nm and λ Emi =585–620 nm); FRET ( λ Exc =570 nm and λ Emi =655–730 nm); and Cy5 ( λ Exc =633 nm and λ Emi =655–730 nm). The images recorded were analysed using Fiji/ImageJ2 software. The window chamber experiments were approved by the institutional ethics committee and were in accordance with national (Norway) and institutional (NTNU) guidelines. In vivo near-infrared fluorescence imaging Nude mice bearing MDA-MB-231 tumour xenografts on their right flanks were used, which enables in vivo optical imaging of these superficial tissues. Four groups of tumour-bearing female nude mice ( n =8) were administrated through tail veins with Cy5.5-NP:Cy7-X (X=CA, OLA and PLGA2k) or Cy5.5-NP control at a dose of 1.5 g polymer per kg BW. NIRF imaging was performed using a Xenogen IVIS Spectrum imaging system (Perkin Elmer) for each group of mice at selected post-injection time points ( t =0.5, 1, 1.5, 2, 3, 4, 5, 6, 7, 8, 10, 12, 19, 24, 28, 32, 36 and 48 h). Three optical channels were recorded with selected excitation and emission band-pass filters: Cy5.5 ( λ Exc =640±18 nm and λ Em =720±10 nm); Cy7 ( λ Exc =745±18 nm and λ Em =800±10 nm); and FRET ( λ Exc =640±18 nm and λ Em =800±10 nm). The exposure time for each image was 2 s. During the imaging, mice were anaesthetized with vapourized isoflurane administered at 1.5% via a nose cone. Results were processed and analysed using Living Image software (PerkinElmer) by drawing a region of interest in the tumour area.
Synthesis of therapeutic nanoparticles
Doxorubicin derivatives were synthesized through the conjugation of aldoxorubicin (Medkoo Bioscience) with a thiol:butanethiol (Sigma-Aldrich) for Dox-C4, 1-octadecanethiol (Sigma-Aldrich) for Dox-C18 and poly( L -lactide) thiol (Mn 2,500; Sigma-Aldrich) for Dox-PLA2k. Dox-X-loaded nanoparticle NP:Dox-X were synthesized through a nanoprecipitation method similar to the synthesis of Cy5.5-NP:Cy7-X. The detailed procedures are described in the Supplementary Methods .
Doxorubicin tissue distribution in tumour mouse model
Four groups of BALB/c mice bearing orthotropic 4T1 tumour ( n =3) were injected with either NP:Dox-X (X=C4, C18, PLA2k) at 20 mg Dox equivalent per kg BW or the PBS control through the tail vein. At 24 h post injection, the animals were killed, and 40 ml of PBS was perfused through the heart left ventricle. Tumours were collected and kept on ice throughout the extraction procedure. This procedure was slightly modified from existing literature 11 54 . Samples (∼100 mg) from tumours were collected, weighed and cut into small pieces, and loaded into Lysing Matrix D microtubes (MP Biomedicals), each of which was preloaded with 400 mg RIPA cell lysis buffer (Sigma-Aldrich) and collagenase enzyme. After 40 min incubation at 37 °C, the digested tissue samples were homogenized using 1.4 mm ceramic spheres and a Fastprep-24 benchtop homogenizer (MP Biomedicals) for 60 s at 6.5 m s −1 . For each sample, 200 μl homogenized solution was transferred to a microtube, then 50 μl Triton X-100 solution (10% v/v; Sigma-Aldrich) and 750 μl acidified isopropanol (0.75 M HCl) were added in sequence to extract doxorubicin. After incubating overnight at 4 °C in darkness, the extraction solution was vortexed and then centrifuged at 14,000 r.p.m. for 10 min. Then 200 μl of the supernatant and standard doxorubicin solutions (0.1–50 μg ml −1 , prepared in acidified isopropanol) were placed in a 96-well plate, and doxorubicin fluorescence was measured using a microplate reader ( λ Exc =485 nm and λ Exc =590 nm). To correct the background auto-fluorescence, the tissues of tumour or organs from the control mice were processed similarly, and the auto-fluorescence from the blank tissue samples was recorded. That amount was subtracted from the doxorubicin-containing samples. Mann–Whitney test was performed on the doxorubicin concentration in tissue from different groups, and two-tailed P values were obtained using GraphPad Prism version 6.0 (GraphPad Software). Therapeutic treatment and inhibition of tumour growth Female BALB/c mice (6–8 weeks old) bearing orthotropic 4T1 tumours were checked every 2 days to monitor tumour progression and BW. The tumour volume was calculated using the following formula: where l and w are the length (maximum diameter) and width (minimum diameter) of the tumour, respectively, measured using digital calipers. When tumour volume reached around 200 mm 3 , mice were randomized into four groups ( n =8–9) by tumour size and BW, and treated via tail vein with PBS control or NP:Dox-X (X=C4, C18 and PLA2k) at 10 mg doxorubicin equivalent per kg BW on days 0, 3 and 6. Tumour dimensions and BW were monitored every 2 days. For tumour volumes at day 10, significance of differences was calculated by use of the nonparametric Kruskal–Wallis test and Dunn's nonparametric comparison for post hoc testing of between group differences. Mice with tumour volumes >1,000 mm 3 were killed. The cumulative survival curves were compared using Kaplan–Meier analysis and Log-rank (Mantel–Cox) test. Probability values of P
📊 Figures
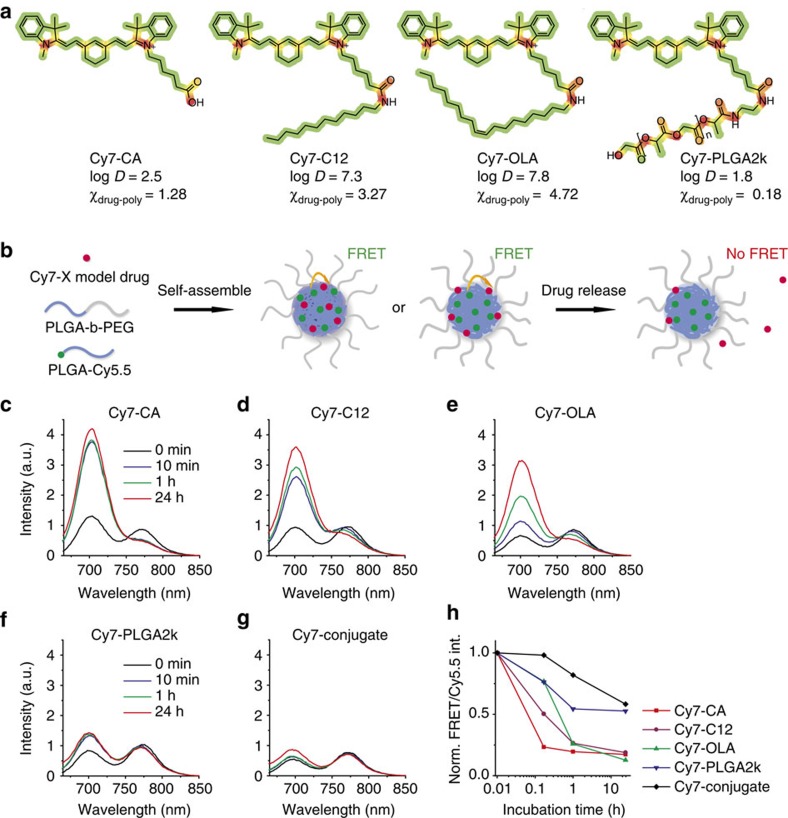
Figure 1
Cy7-X model drugs release in serum from Cy5.5-NP:Cy7-X FRET nanoparticles.
( a ) Chemical structures of Cy7-X (X=CA, C12, OLA and PLGA2k) with hydrophobic segments presented in green and hydrophilic ones in red. The Cy7-X molecule's overall hydrophobicity (log D ) and miscib...
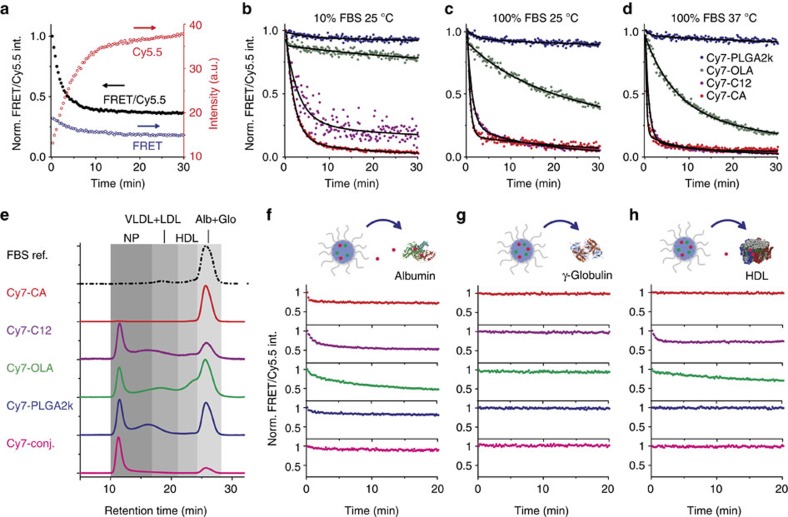
Figure 2
In vitro drug release dynamics of Cy5.5-NP:Cy7-X in serum.
( a ) A typical measurement of release dynamics, determined by recording time-dependent fluorescence in Cy5.5 channel (red circles, u03bb Exc =620u2009nm and u03bb Emi =700u2009nm) and FRET channel (b...
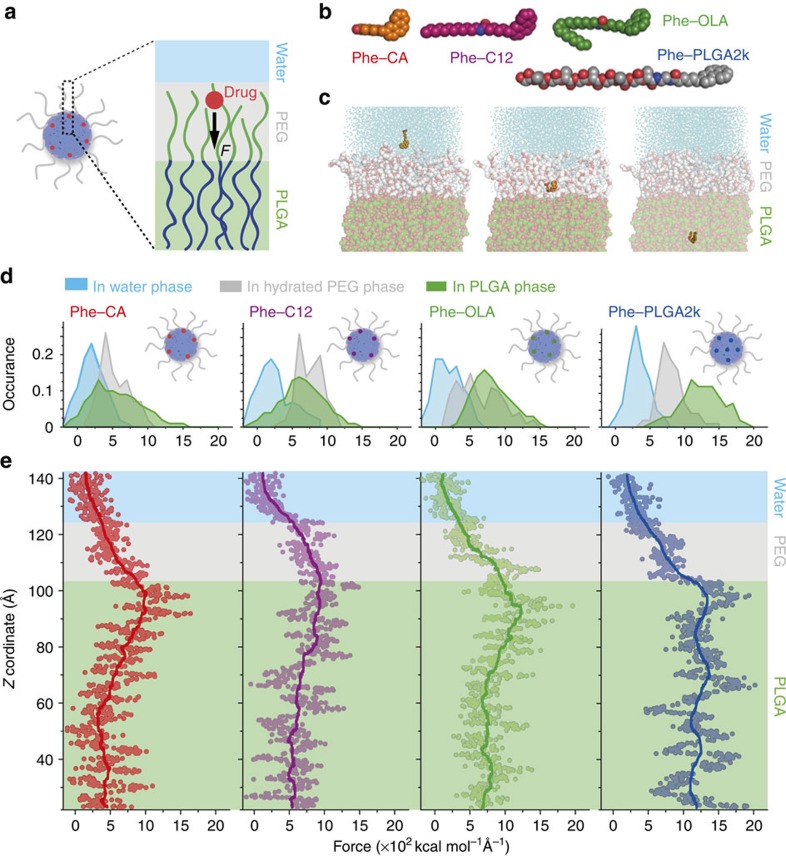
Figure 3
Computer simulations on drugu2013nanoparticle interactions and predictions of drug-loading positions.
( a ) Schematic illustration of the SMD simulations. A three-phase model system was constructed to simulate the environment of the drug molecules in a colloidal PLGAu2013PEG micelle. From the top to b...
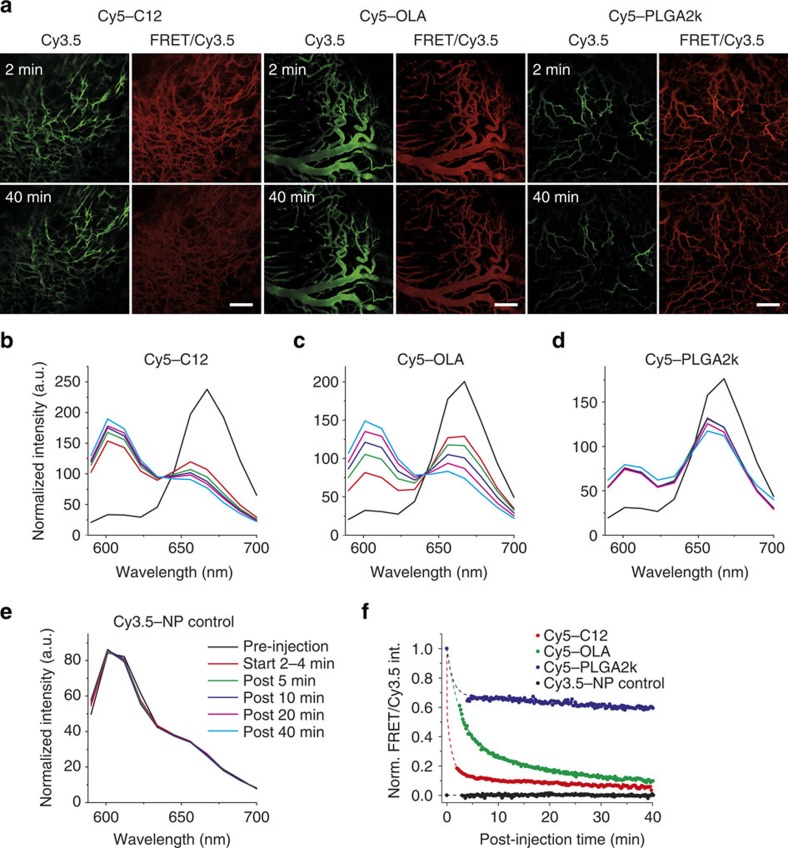
Figure 4
Intravital microscopy investigation of drug release dynamics in the vasculature.
Window chamber mice were injected intravenously with Cy3.5-NP:Cy5-X (X=C12, OLA and PLGA2k) FRET and Cy3.5-NP non-FRET control nanoparticles and continuously observed for 1u2009h. ( a ) Representative...
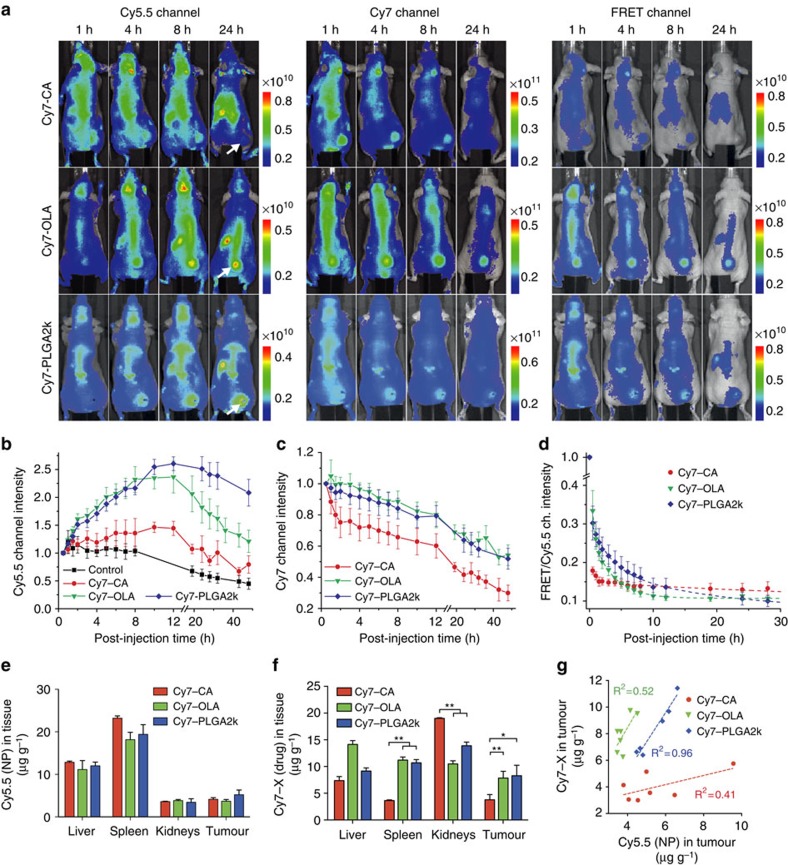
Figure 5
Accumulation and subsequent drug release of Cy5.5-NP:Cy7-X in tumour.
( a ) Representative NIRF images obtained at selected post-injection times in three optical channels: Cy5.5 ( u03bb Exc =640u2009nm and u03bb Em =720u2009nm); Cy7 ( u03bb Exc =745u2009nm and u03bb Em ...
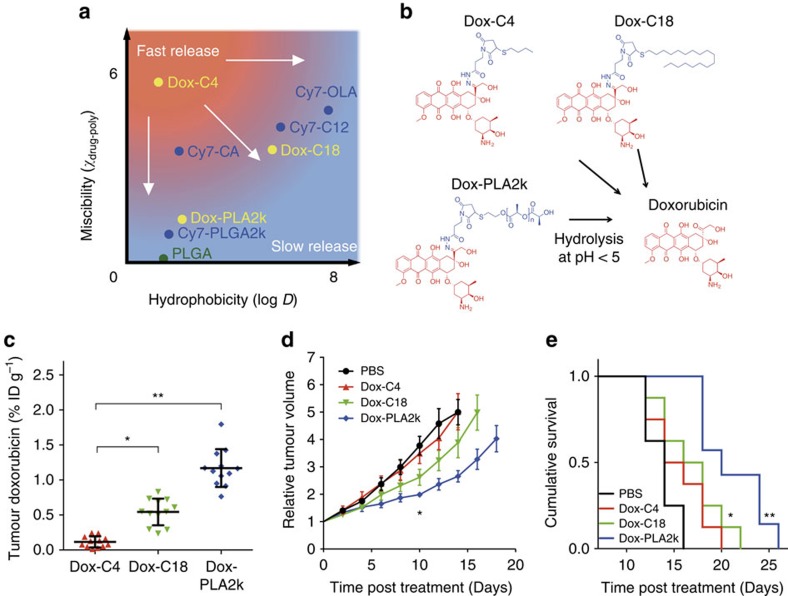
Figure 6
A guideline for efficient drug delivery and its application to doxorubicin nanoparticle therapy.
( a ) Schematic showing that hydrophobicity (log D ) and miscibility with the PLGA matrix ( u03c7 drug-poly ) are two independent parameters that determine the drug's release rate in the circulation. ...
Figure images are served from the NIH/NLM PubMed Central Open Access Subset or Europe PMC; copyright remains with the publishers and authors.
💬 Discussion
0 commentsNo comments yet. Be the first to start a discussion!
Leave a Comment