Abstract
The DISC1 protein is implicated in major mental illnesses including schizophrenia, depression, bipolar disorder, and autism. Aberrant mitochondrial dynamics are also associated with major mental illness. DISC1 plays a role in mitochondrial transport in neuronal axons, but its effects in dendrites have yet to be studied. Further, the mechanisms of this regulation and its role in neuronal development and brain function are poorly understood. Here we have demonstrated that DISC1 couples to the mitochondrial transport and fusion machinery via interaction with the outer mitochondrial membrane GTPase proteins Miro1 and Miro2, the TRAK1 and TRAK2 mitochondrial trafficking adaptors, and the mitochondrial fusion proteins (mitofusins). Using live cell imaging, we show that disruption of the DISC1-Miro-TRAK complex inhibits mitochondrial transport in neurons. We also show that the fusion protein generated from the originally described DISC1 translocation (DISC1-Boymaw) localizes to the mitochondria, where it similarly disrupts mitochondrial dynamics. We also show by super resolution microscopy that DISC1 is localized to endoplasmic reticulum contact sites and that the DISC1-Boymaw fusion protein decreases the endoplasmic reticulum-mitochondria contact area. Moreover, disruption of mitochondrial dynamics by targeting the DISC1-Miro-TRAK complex or upon expression of the DISC1-Boymaw fusion protein impairs the correct development of neuronal dendrites. Thus, DISC1 acts as an important regulator of mitochondrial dynamics in both axons and dendrites to mediate the transport, fusion, and cross-talk of these organelles, and pathological DISC1 isoforms disrupt this critical function leading to abnormal neuronal development.
🔬 Techniques
🔭 Microscopes
✨ Fluorophores
🧪 Sample Preparation
🔬 Cell Lines
🏭 Microscope Brands
🧪 Reagent Suppliers
📷 Detectors
🔎 Objectives
💻 Software Details
🏛️ Research Organizations (ROR)
Affiliated research institutions:
📋 Methods
Antibodies and Constructs
Antibody against neurofascin (clone A12/18) was from NeuroMab (IC 1:100). Antibody against GFP was from Santa Cruz Biotechnology (Western blot 1:500, sc-8334) or NeuroMab (clone N86/8). For Sholl analysis, anti-GFP antibody was from Nacalai Tesque, Inc. (1:2000, G090R). The monoclonal antibodies 9E10 (recognizing Myc) and 12CA5 (recognizing HA) were obtained from respective hybridomas (Western blot and immunofluorescence 1:100, mouse). Anti-human DISC1 (14F2) was described previously (WB and immunofluorescence 1:100 mouse) ( 41 ); anti-Rhot1 against Miro was from Atlas Antibodies (HPA010687 for proximity ligation assays and AMAb90854 for immunoprecipitation), and anti-TRAK1 was also from Atlas Antibodies (HPA005853). Mitofusin1 was from Abcam (Ab57602), and TOM20 was from Santa Cruz Biotechnology (FL-145). Secondary antibodies for immunofluorescence were from Invitrogen and were used at 1:1000. Secondary horseradish peroxidase-conjugated antibodies were from Rockland and used at 1:10,000. The cDNA construct encoding human myc DISC1-FL was a kind gift from N. Brandon (Cambridge, MA). Untagged human DISC1 was in a pRK5 expression vector ( 42 ). Mitochondrially targeted monomeric DsRed fluorescent protein (MtDsRed2), synaptophysin GFP , GFP Miro1, and GFP Miro2 were described previously ( 17 , 20 , 21 , 43 ). Endoplasmic reticulum-targeted DsRed fluorescent protein (ERDsRed) was from Clontech. GFP TRAK1 and GFP TRAK2 were cloned by insertion of the mouse TRAK sequences into the EGFP-C1 vector. HA-tagged DISC1 deletion constructs were described previously ( 44 ). Myc TRAK constructs were a kind gift from F. A. Stephenson (University College London School of Pharmacy). TRAK Miro binding domain (MBD) was described previously ( 23 ). HA Boymaw, a kind gift from M. Geyer (University of California, San Diego), was subcloned into the pRK5 expression vector ( 6 ). The following constructs were from Addgene: myc Mitofusin1 (plasmid 23212) and -2 (23213), Su9-EGFP-(23214) ( 45 ), and mito-PAGFP-(23348) ( 46 ).
Show full methods section
Antibodies and Constructs
Antibody against neurofascin (clone A12/18) was from NeuroMab (IC 1:100). Antibody against GFP was from Santa Cruz Biotechnology (Western blot 1:500, sc-8334) or NeuroMab (clone N86/8). For Sholl analysis, anti-GFP antibody was from Nacalai Tesque, Inc. (1:2000, G090R). The monoclonal antibodies 9E10 (recognizing Myc) and 12CA5 (recognizing HA) were obtained from respective hybridomas (Western blot and immunofluorescence 1:100, mouse). Anti-human DISC1 (14F2) was described previously (WB and immunofluorescence 1:100 mouse) ( 41 ); anti-Rhot1 against Miro was from Atlas Antibodies (HPA010687 for proximity ligation assays and AMAb90854 for immunoprecipitation), and anti-TRAK1 was also from Atlas Antibodies (HPA005853). Mitofusin1 was from Abcam (Ab57602), and TOM20 was from Santa Cruz Biotechnology (FL-145). Secondary antibodies for immunofluorescence were from Invitrogen and were used at 1:1000. Secondary horseradish peroxidase-conjugated antibodies were from Rockland and used at 1:10,000. The cDNA construct encoding human myc DISC1-FL was a kind gift from N. Brandon (Cambridge, MA). Untagged human DISC1 was in a pRK5 expression vector ( 42 ). Mitochondrially targeted monomeric DsRed fluorescent protein (MtDsRed2), synaptophysin GFP , GFP Miro1, and GFP Miro2 were described previously ( 17 , 20 , 21 , 43 ). Endoplasmic reticulum-targeted DsRed fluorescent protein (ERDsRed) was from Clontech. GFP TRAK1 and GFP TRAK2 were cloned by insertion of the mouse TRAK sequences into the EGFP-C1 vector. HA-tagged DISC1 deletion constructs were described previously ( 44 ). Myc TRAK constructs were a kind gift from F. A. Stephenson (University College London School of Pharmacy). TRAK Miro binding domain (MBD) was described previously ( 23 ). HA Boymaw, a kind gift from M. Geyer (University of California, San Diego), was subcloned into the pRK5 expression vector ( 6 ). The following constructs were from Addgene: myc Mitofusin1 (plasmid 23212) and -2 (23213), Su9-EGFP-(23214) ( 45 ), and mito-PAGFP-(23348) ( 46 ).
Cell Culture and Transfection
COS7 and SH-SY5Y cells were maintained in 10-cm dishes containing 10 ml of enhanced DMEM supplemented with penicillin-streptomycin and 10% FBS at 37 °C and 5% CO 2 , transfected by nucleofection using an Amaxa electroporator, and allowed 24–48 h for protein expression. For preparation of the primary neuronal cultures, embryonic day 18 (E18) pups were removed from the dam under sterile conditions. Brains were removed from the skulls, and hippocampal dissection was carried out in Hanks' balanced salt solution at 4 °C prior to incubation in a 0.125% trypsin-EDTA solution for 15 min at 37 °C. Hippocampi were washed three times with 10 ml of Hanks' balanced salt solution and triturated 10 times using a fire-polished Pasteur pipette in prewarmed attachment medium. Cells were plated at 350,000 cells in 5 ml of prewarmed attachment medium (minimum Eagle's medium plus 10% horse serum) in 6-cm dishes containing washed glass coverslips precoated overnight in 500 μg/ml poly- l -lysine. After 5 h the medium was removed and replaced with prewarmed maintenance medium (Neurobasal medium supplemented with 2% B-27 (Gibco), 6% glucose, GlutaMAX, and penicillin-streptomycin). Calcium phosphate precipitation or lipofection methods were used for transfection of hippocampal cultures at 7 days in vitro (DIV) for Sholl analysis or 8 DIV for live imaging. For calcium phosphate, 1–2 μg of DNA was prepared in 27 μl of Tris-EDTA, 3 μl of 2.5 m CaCl 2 , and 30 μl of 2× HEPES-buffered saline. Coverslips were treated in 1 ml of prewarmed unsupplemented Neurobasal medium with the calcium phosphate preparation. The dishes were then returned to the 37 °C, 5% CO 2 incubator for 30 min or until a fine precipitate was formed. Coverslips were washed twice, and samples were maintained in the original conditioned medium for 24–48 h for live imaging or 72 h for Sholl analysis in the 37 °C, 5% CO 2 incubator to allow expression of the transfected vectors. Lipofection was carried out according to the manufacturer's instructions (Invitrogen) in unsupplemented Neurobasal medium with 6% glucose.
Biochemical Assays
Co- immunoprecipitation experiments were carried out in lysis buffer (50 m m HEPES, pH7.5, 0.5% Triton X-100, 150 m m NaCl, 1 m m EDTA, 1 m m PMSF, and 1 μg/ml antipain, pepstatin, and leupeptin) using GFP trap beads (Chromotek) or rabbit anti-Myc beads (Sigma). For native co-immunoprecipitation experiments, the brains of transgenic rats expressing full-length, non-mutant, human DISC1 were used ( 80 ). Co-immunoprecipitation (co-IP) was carried out in lysis buffer with 1.5% Triton X-100. The homogenate was incubated overnight with antibodies in the above described buffer supplemented with 1% BSA. Protein A-beads (Sigma) were used, and IPs were washed four times in incubation buffer and once in lysis buffer.
Western Blotting
SDS-PAGE and Western blotting samples were denatured at 94 °C for 5 min in 3× SDS sample buffer (150 m m Tris, pH 8, 6% SDS, 0.3 m DTT, 0.3% bromphenol blue, and 30% glycerol). Polyacrylamide gels were prepared using 10% running gels and 5% stacking gels in Novex 1.5-mm cassettes and run using the Novex XCell SureLock Mini-Cell system. Gels were transferred onto Hybond-C nitrocellulose membrane (GE Healthcare). Membranes were blocked in 4% milk for 1 h and incubated overnight at 4 °C with shaking in the appropriate antibody. HRP-conjugated secondary antibodies were from Rockland (1:10,000). Bands were visualized using Crescendo chemiluminescent substrate (Millipore) together with an ImageQuant LAS 4000 charge-coupled device camera system (CCD, GE Healthcare).
Immunocytochemistry
As shown in Fig. 1 , fluorescent labeling was used during live imaging to determine the axonal compartment prior to mitochondrial imaging ( 47 ). Thus, neurofascin antibody (1 μl) was incubated for 15 min on ice with the secondary fluorescently conjugated antibody (0.3 μl). 100 μl of live imaging block solution was added (10% horse serum and 90% extracellular solution), the solution was mixed, and a coverslip containing the cells for imaging was incubated in this mixture for 8 min at room temperature. Following one rinse in 1× PBS, the coverslip was used for imaging as described below. Fixed cell imaging was carried out by fixation with 4% paraformaldehyde for 10 min at room temperature followed by blocking for 10 min in 10% horse serum, 0.5% BSA, and 0.2% Triton X-100 in PBS. Coverslips were incubated in the relevant primary antibodies diluted in blocking solution for 1 h, washed five times in PBS, and incubated in secondary antibodies diluted in blocking solution. Coverslips were washed five times in PBS, mounted onto slides using Prolong® Gold antifade reagent (Invitrogen), and later sealed with nail varnish.
Proximity ligation assays
(Duolink) were carried out using anti-Rhot1 (HPA010687) and anti-DISC1 antibodies (14F2 both 1:200) or anti-DISC1 alone for control proximity ligation assays. Samples were fixed and blocked before primary antibodies against Miro1 (Rhot1) and DISC1 raised in either mouse or rabbit were applied to the cells. Following primary antibody incubation, cells were washed in PBS before incubation with secondary antibodies conjugated with oligonucleotides. Ligation and amplification reactions were conducted at 37 °C, as described in the Duolink manual, before mounting and visualization using confocal microscopy ( 48 ). Cell fusion assays were carried out as described previously ( 45 ). Briefly, cells were nucleofected with MtDsRed2 or Su9-EGFP and plated together. 24 h later, the medium was replaced with 50% polyethylene glycol 1500 in unsupplemented DMEM for 45 s and washed three times every 10 min. Normal medium was replaced and supplemented with 30 μg/ml cycloheximide. Cells were fixed and imaged 3 h later. Imaging was carried out using a Zeiss LSM 700 upright confocal microscope using an Apochromat 63× oil immersion lens with a 1.4 numerical aperture. Images were captured digitally using Zen 2010 software. For ER-mitochondria contact analysis, post-acquisition processing on stacks was carried out in ImageJ using denoise and deconvolution plugins ( 49 , 50 ) followed by a three-dimensional rendering with VolumeJ. Images of ER-mitochondria contacts were generated using the “image calculator” function of ImageJ to generate images specifically of colocalized regions.
Structured illumination microscopy
(SIM) was performed using a Zeiss Elyra PS.1 equipped with 405-, 488-, 555-, and 642-nm lasers. Images were acquired with a 63 × 1.4 numerical aperture oil immersion objective using a pco.edge sCMOS camera and Zen 2012 image analysis software. Typically, images were acquired with 34-μm grating and three rotations by exciting fluorophores with 1–3% laser intensity and 120–150-ms exposure time. Post-acquisition, images were processed with Zen 2012 using the SIM reconstruction module with default settings; drift corrections between the channels were performed with respect to 100-nm Tetraspec fluorescent microspheres (Molecular Probes). For Sholl analysis an apochromat 40× oil immersion lens with a 1.3 numerical aperture was used. Neurites were traced in NeuronStudio. The number of intersections was calculated using the neurite tracer plugin on ImageJ ( 51 ).
Live Cell Imaging
For neuronal imaging of the mitochondria, E18 primary hippocampal neurons were transfected at 7–8 DIV, imaged at 9–10 DIV under perfusion with imaging medium (125 m m NaCl, 10 m m HEPES, 10 m m glucose, 5 m m KCl, 2 m m CaCl 2 , and 1 m m MgCl 2 , pH 7.4) warmed to 37 °C, and flowed at a rate of 1–2 ml/min throughout the duration of each experiment ( 52 ). For acquisition, fluorescence was captured using an Olympus microscope (BX60M) with a 60× Olympus objective coupled to an EM-CCD camera (iXon, Andor Technology). Excitation was provided by a mercury arc lamp (Cairn Research) with the appropriate filters ( 53 ). Images were acquired at 1 frame/s for a period of 2 min. Axonal regions were acquired at a distance of 100–200 μm from the cell body, and dendritic imaging was acquired at a distance of 50 μm from the cell body due to their reduced length. The length of process assayed was ≈150 μm. To create kymographs, image sequences were opened within ImageJ. Curved processes were straightened using the “straighten” macro, and kymographs were created using the “multiple kymograph” macro. The resulting kymographs show the process along the x axis and time across the y axis. Mobility was assessed by counting the percentage of objects moving during an imaging period. Mitochondria and synaptophysin GFP positive vesicles were classed as moving if they moved more than 2 μm between the initial and final frames of acquisition ( 17 ). Photoactivation assays were carried out on a Zeiss LSM 700 upright confocal microscope using an apochromat 60× water immersion lens with a 1.0 numerical aperture. Photoactivation was carried out at 405 nm after five frames, and spread of GFP signal was measured in ImageJ over 95 frames at 1 frame/6 s.
Statistical Analysis
All data were obtained using cells from three different preparations unless otherwise stated. Individual differences were assessed using individual Student's t tests at a 95% significance level. Statistical significance across groups was analyzed using one-way analysis of variance and Tukey's post hoc test to compare all data groups. For Sholl analysis, we used two-way repeated measures analysis of variance with a post hoc Bonferroni test for comparison of dendritic crossing and branch points. Data are shown as mean ± S.E. Both the Pearson and Manders coefficients were calculated using the JACoP plugin within ImageJ.
📊 Figures
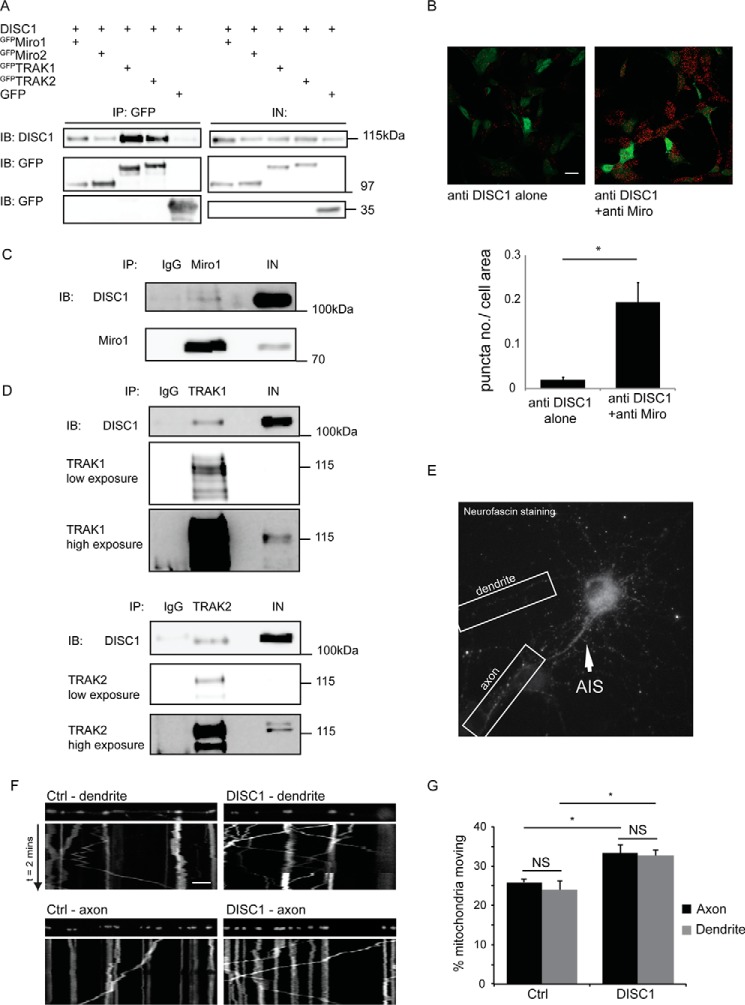
FIGURE 1.
DISC1 interacts with mitochondrial trafficking complex proteins to regulate transport in dendrites in addition to axons. A , GFP trap co-immunoprecipitation experiments from COS7 cells show robust int...
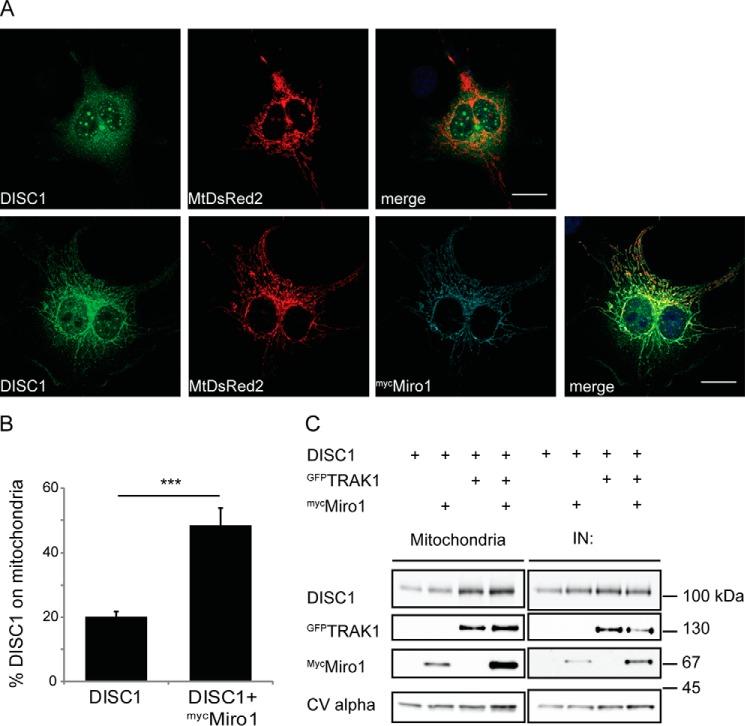
FIGURE 2.
DISC1 is recruited to mitochondria by components of the mitochondrial trafficking complex. A , immunocytochemistry in COS7 cells showing localization of exogenous DISC1 with and without myc Miro1 over...
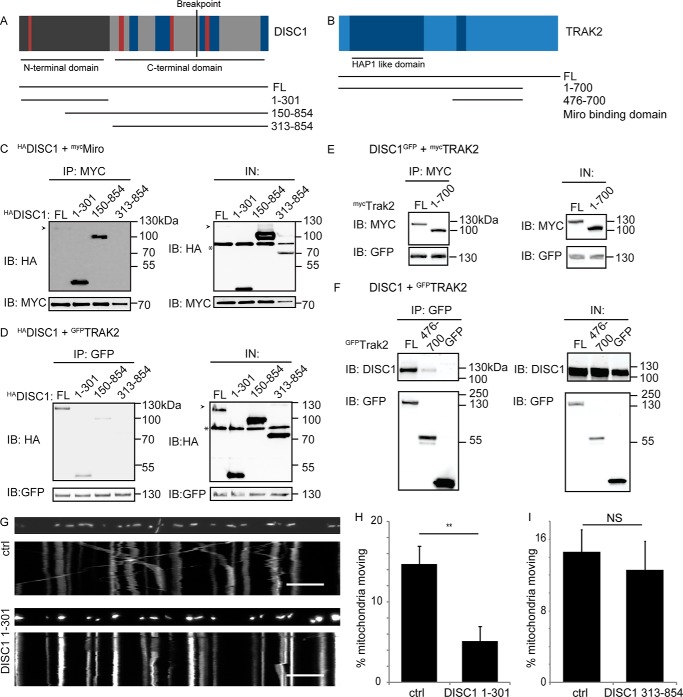
FIGURE 3.
The DISC1 N terminus mediates the interaction with Miro and TRAKs. A , schematic of the DISC1 protein showing domains present in deletion constructs used. Coiled-coil domains are dark blue , and nucle...
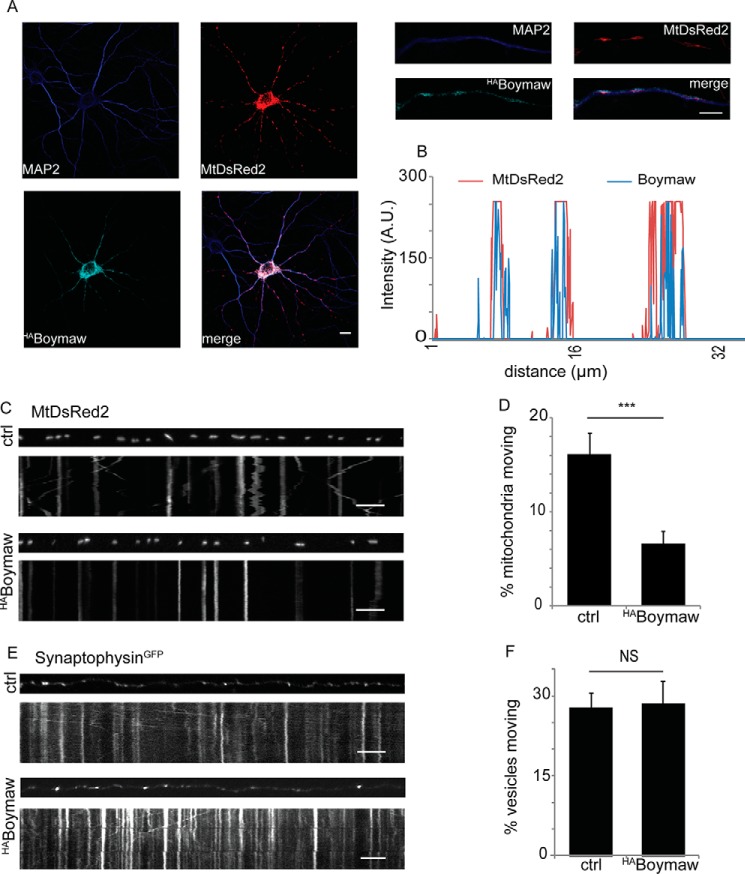
FIGURE 4.
The DISC1-Boymaw fusion protein inhibits mitochondrial trafficking. A , immunocytochemistry in hippocampal neurons showing localization of the Boymaw protein. Scale bar = 20 u03bcm, 5 u03bcm on zoomed...
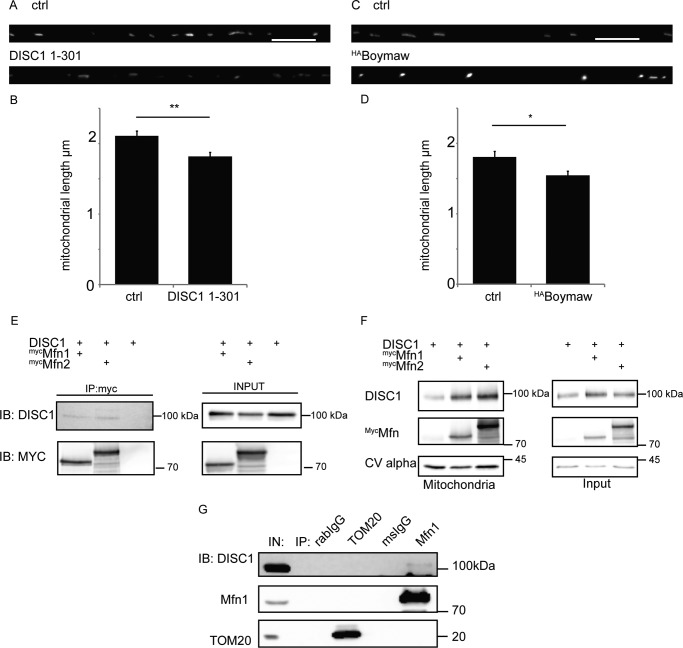
FIGURE 5.
DISC1 interacts with mitofusins. A and B , DISC1 1u2013301 decreases the length of mitochondria ( A ) as quantified in B (ctrl = 2. 1 u03bcm u00b1 0.065, DISC1-(1u2013301) = 1.8 u00b1 0.063 u03bcm, n ...
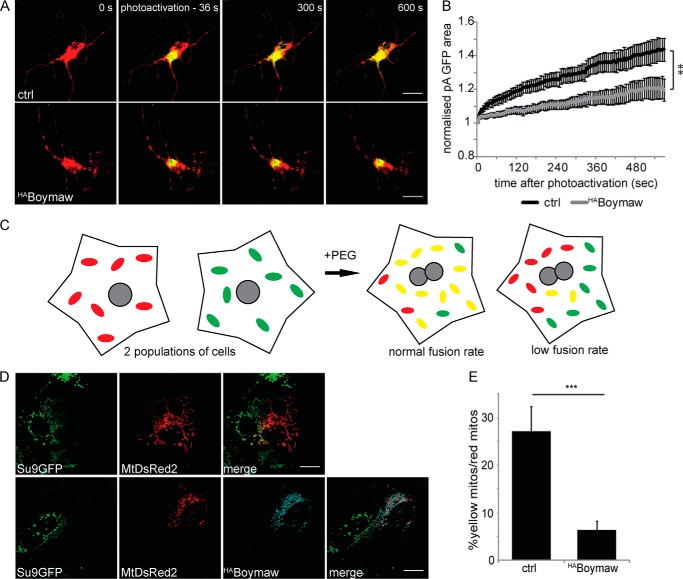
FIGURE 6.
The DISC1-Boymaw fusion protein inhibits mitochondrial fusion. A , HA Boymaw inhibits mitochondrial fusion in neurons. Neurons were transfected with MtDsRed2 and mitochondrially targeted photoactivata...
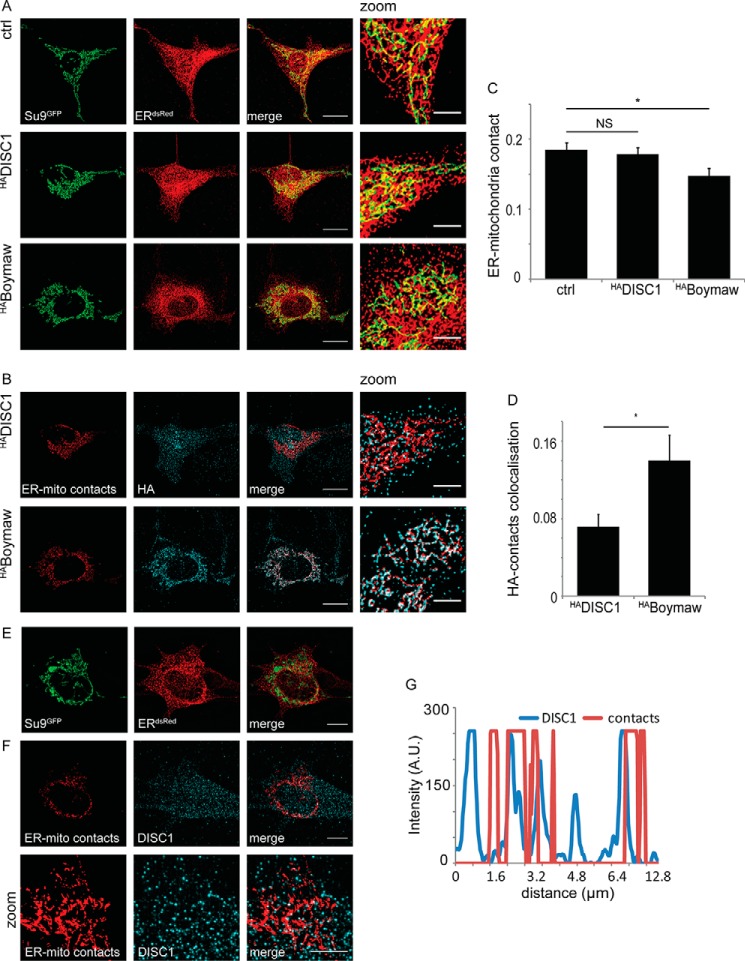
FIGURE 7.
The DISC1-Boymaw fusion protein decreases the area of ER-mitochondria contacts. A , three-dimensional renderings of mitochondrial network (Su9 GFP ) and ER (ER dsred ) in COS7 cells upon co expression...
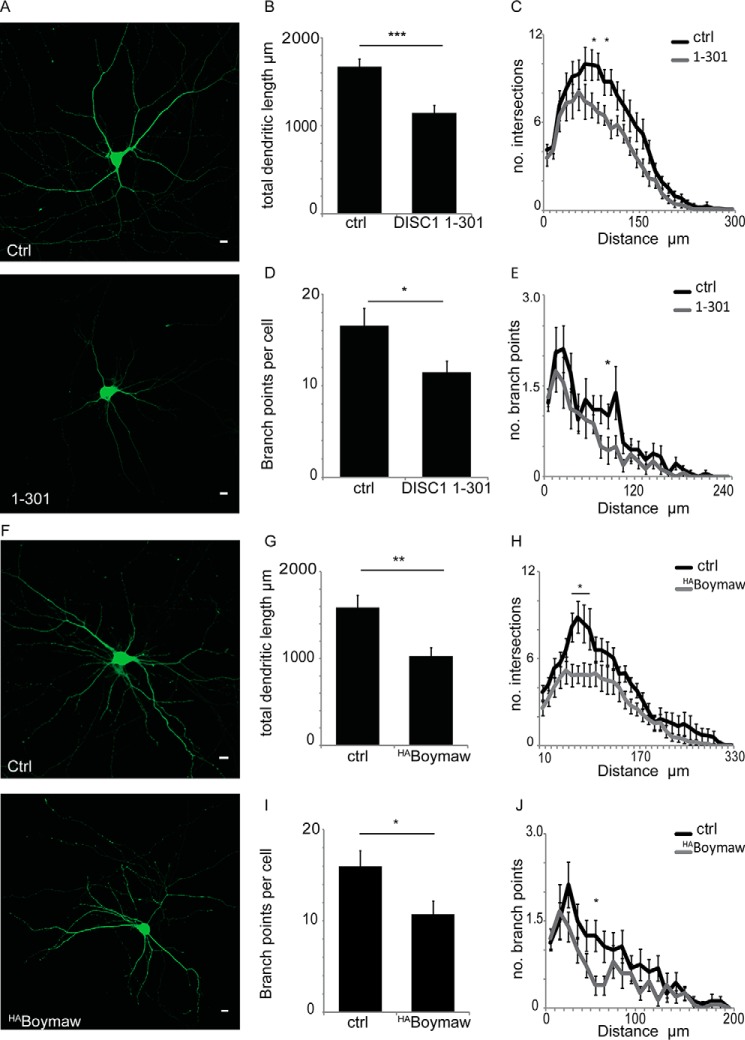
FIGURE 8.
DISC1-mediated mitochondrial trafficking is necessary for normal dendritic development. A , representative images showing control 10 DIV neurons and those expressing the DISC1-Miro binding domain (res...
Figure images are served from the NIH/NLM PubMed Central Open Access Subset or Europe PMC; copyright remains with the publishers and authors.
💬 Discussion
0 commentsNo comments yet. Be the first to start a discussion!
Leave a Comment