Abstract
Human T-lymphotropic virus 1 (HTLV-1) is transmitted directly between cells via an organized cell-cell contact called a virological synapse (VS). The VS has been studied by light microscopy, but the ultrastructure of the VS and the nature of the transmitted viral particle have remained unknown. Cell-free enveloped virions of HTLV-1 are undetectable in the serum of individuals infected with the human T-lymphotropic virus 1 (HTLV-1) and during in vitro culture of naturally infected lymphocytes. However, the viral envelope protein is required for infectivity of HTLV-1, suggesting that complete, enveloped HTLV-1 virions are transferred across the synapse. Here, we use electron tomography combined with immunostaining of viral protein to demonstrate the presence of enveloped HTLV-1 particles within the VS formed between naturally infected lymphocytes. We show in 3D that HTLV-1 particles can be detected in multiple synaptic clefts at different locations simultaneously within the same VS. The synaptic clefts are surrounded by the tightly apposed plasma membranes of the two cells. HTLV-1 virions can contact the recipient cell membrane before detaching from the infected cell. The results show that the HTLV-1 virological synapse that forms spontaneously between lymphocytes of HTLV-1 infected individuals allows direct cell-cell transmission of the virus by triggered, directional release of enveloped HTLV-1 particles into confined intercellular spaces.
🔬 Techniques
🔭 Microscopes
🧪 Sample Preparation
🔬 Cell Lines
🏭 Microscope Brands
🧪 Reagent Suppliers
📷 Detectors
💻 Software Details
💾 Data Repositories
🏛️ Research Organizations (ROR)
Affiliated research institutions:
📋 Methods
Naturally infected CD4 + T cells Peripheral blood mononuclear cells
(PBMCs) were donated by HTLV-1 seropositive patients with HTLV-1-associated myelopathy/tropical spastic paraparesis (HAM/TSP) attending the National Centre for Human Retrovirology at St Mary's Hospital, London. We used samples from three different patients with HAM/TSP, each with a high proviral load of HTLV-1: one sample was not immunostained and the two others were stained with anti-Gag antibody. We also used CD4 + T-cells isolated from an HTLV-1 seronegative healthy donor as a negative control. All patients gave written informed consent, and the study was approved by the St Mary's NHS Trust Local Research Ethics Committee. The PBMCs were isolated by density gradient centrifugation on Histopaque-1077 (Sigma-Aldrich Company Ltd, Dorset, UK), washed twice with phosphate buffered saline (PBS) and washed once in PBS/10% FCS. CD4 + T cells were negatively selected from the PBMCs using the CD4 + T cell isolation Kit from Miltenyi Biotech, Surrey, UK, following the manufacturer's instructions. This procedure yielded CD4 + cells at a purity of greater than 90%, ascertained by flow cytometry (data not shown). Before use, the isolated CD4 + T cells were cultured overnight in 10 cm diameter tissue culture dishes (10 6 cells/ml), to allow spontaneous expression of HTLV-1 proteins [30] . During this incubation, the cells were widely dispersed to minimize cell-cell contact. Before processing for EM the cells were gently centrifuged for 5 minutes at 300 g to induce cell-cell conjugates and then incubated for another 1 h at 37°C and 5% CO 2 . T cells were cultured in RPMI 1640 medium (Sigma-Aldrich Company Ltd, Dorset, UK) supplemented with 2 mM glutamine (Invitrogen Ltd, Paisley, UK), 100 IU/ml penicillin (Invitrogen Ltd, Paisley, UK), 100 IU/ml streptomycin (Invitrogen Ltd, Paisley, UK) and 10% heat-inactivated fetal calf serum (PAA Laboratories Ltd, Somerset, UK). HTLV-1-immortalized cell line and Jurkat cell line The HTLV-1- immortalized cell line, MS9 was a gift from Dr. David Derse, National Cancer Institute, Maryland, USA. MS9 cells were derived by co-culture of phorbol-12- myristate-13-acetate-activated human peripheral PBMCs with DBS-FRhL (clone B5) cells that were infected with the HTLV-1 molecular clone, pHTLV-X1MT [31] . MS9 cells were cultured in RPMI 1640 (Sigma-Aldrich Company Ltd, Dorset, UK) supplemented with 2 mM glutamine (Invitrogen Ltd, Paisley, UK), 100 IU/ml penicillin (Invitrogen Ltd, Paisley, UK), 100 IU/ml streptomycin (Invitrogen Ltd, Paisley, UK), 20% heat-inactivated fetal calf serum (PAA Laboratories Ltd, Somerset, UK) and 100 U/ml recombinant interleukin 2 (IL-2; Sigma-Aldrich Company Ltd, Dorset, UK). Jurkat cells (clone E6.1) were obtained from ATCC, Middlesex, UK. Jurkat E6.1 is a clone of the Jurkat-FHCRC cell line, a derivative of the Jurkat cell line [32] . Before processing for EM and/or IFM the cells were mixed 1∶1 with Jurkat cells and incubated for 30 minutes at 37°C and 5% CO 2 to induce cell-cell conjugates.
Show full methods section
Naturally infected CD4 + T cells Peripheral blood mononuclear cells
(PBMCs) were donated by HTLV-1 seropositive patients with HTLV-1-associated myelopathy/tropical spastic paraparesis (HAM/TSP) attending the National Centre for Human Retrovirology at St Mary's Hospital, London. We used samples from three different patients with HAM/TSP, each with a high proviral load of HTLV-1: one sample was not immunostained and the two others were stained with anti-Gag antibody. We also used CD4 + T-cells isolated from an HTLV-1 seronegative healthy donor as a negative control. All patients gave written informed consent, and the study was approved by the St Mary's NHS Trust Local Research Ethics Committee. The PBMCs were isolated by density gradient centrifugation on Histopaque-1077 (Sigma-Aldrich Company Ltd, Dorset, UK), washed twice with phosphate buffered saline (PBS) and washed once in PBS/10% FCS. CD4 + T cells were negatively selected from the PBMCs using the CD4 + T cell isolation Kit from Miltenyi Biotech, Surrey, UK, following the manufacturer's instructions. This procedure yielded CD4 + cells at a purity of greater than 90%, ascertained by flow cytometry (data not shown). Before use, the isolated CD4 + T cells were cultured overnight in 10 cm diameter tissue culture dishes (10 6 cells/ml), to allow spontaneous expression of HTLV-1 proteins [30] . During this incubation, the cells were widely dispersed to minimize cell-cell contact. Before processing for EM the cells were gently centrifuged for 5 minutes at 300 g to induce cell-cell conjugates and then incubated for another 1 h at 37°C and 5% CO 2 . T cells were cultured in RPMI 1640 medium (Sigma-Aldrich Company Ltd, Dorset, UK) supplemented with 2 mM glutamine (Invitrogen Ltd, Paisley, UK), 100 IU/ml penicillin (Invitrogen Ltd, Paisley, UK), 100 IU/ml streptomycin (Invitrogen Ltd, Paisley, UK) and 10% heat-inactivated fetal calf serum (PAA Laboratories Ltd, Somerset, UK). HTLV-1-immortalized cell line and Jurkat cell line The HTLV-1- immortalized cell line, MS9 was a gift from Dr. David Derse, National Cancer Institute, Maryland, USA. MS9 cells were derived by co-culture of phorbol-12- myristate-13-acetate-activated human peripheral PBMCs with DBS-FRhL (clone B5) cells that were infected with the HTLV-1 molecular clone, pHTLV-X1MT [31] . MS9 cells were cultured in RPMI 1640 (Sigma-Aldrich Company Ltd, Dorset, UK) supplemented with 2 mM glutamine (Invitrogen Ltd, Paisley, UK), 100 IU/ml penicillin (Invitrogen Ltd, Paisley, UK), 100 IU/ml streptomycin (Invitrogen Ltd, Paisley, UK), 20% heat-inactivated fetal calf serum (PAA Laboratories Ltd, Somerset, UK) and 100 U/ml recombinant interleukin 2 (IL-2; Sigma-Aldrich Company Ltd, Dorset, UK). Jurkat cells (clone E6.1) were obtained from ATCC, Middlesex, UK. Jurkat E6.1 is a clone of the Jurkat-FHCRC cell line, a derivative of the Jurkat cell line [32] . Before processing for EM and/or IFM the cells were mixed 1∶1 with Jurkat cells and incubated for 30 minutes at 37°C and 5% CO 2 to induce cell-cell conjugates.
Sample preparation for EM
Samples were prepared with different buffers and different amounts of fixatives, depending on whether they were destined to be immunostained with the mAb anti-Gag p19 (GIN7) or to be stained with magnesium uranyl acetate (Sigma-Aldrich Company Ltd, Dorset, UK). In general, the fixation of the samples was performed sequentially in two distinct fixative solutions: Solution A, 2% paraformaldehyde (PFA) (Electron Microscopy Science, Hatfield, PA, USA) and 0.5% glutaraldehyde (Agar Scientific Ltd, Essex, UK) in sodium cacodylate buffer 0.1 M, pH 7.2 (Sigma-Aldrich Ltd, Dorset, UK); and Solution B, 1% osmium tetroxide (OsO 4 ) in PBS (Sigma-Aldrich Ltd, Dorset, UK). After incubating the samples to induce cell-cell conjugates, they were pre-fixed in the 10× diluted PFA/glutaraldehyde (Solution A) for 10 minutes before centrifugation. After centrifuging for 5 minutes at 1000 g the samples were fixed for another hour with the undiluted fixative (Solution A). The samples were washed 3 times either with PBS 1% BSA or with sodium cacodylate buffer 0.1 M, pH 7.2, and then processed for antibody staining as described below or post-fixed with 1% OsO 4 (Solution B) and stained in magnesium uranyl acetate overnight, respectively. The fixed samples were dehydrated through a series of ethanol exchanges and embedded in Agar 100 resin (Agar Scientific Ltd., Stansted, UK). The samples were baked at 60°C overnight to give solid blocks that were sectioned with an ultramicrotome (Leica Ultracut UCT, Leica Microsystems GmbH, Wetzlar, Germany) at a thickness of 60–300 nm. Thin samples (60–100 nm) were floated onto 200/300 mesh square Ni grids (Agar Scientific Ltd., Stansted, UK). Thick samples for tomography (200–300 nm) were either floated onto 200 mesh square Ni grids or onto formvar film coated Cu 1×2 mm slot grids (Agar Scientific Ltd., Stansted, UK) to allow for the collection of serial sections. Samples that were not antibody labelled were stained with lead citrate (Leica Ultrostain2) for 3–10 minutes, depending on the thickness of the sections, by floating the grids on drops of the staining solution. For electron tomography the grids were covered with 10 nm or 15 nm fiducial gold beads (Sigma-Aldrich Company Ltd, Dorset, UK) to facilitate image processing. Pre-embedding antibody staining for EM To detect HTLV-1 Gag matrix protein in infected cells the samples were labelled against HTLV-1 Gag p19 [33] using the DAB kit from Molecular Probes (Invitrogen Ltd, Paisley, UK ). After the PFA/glutaraldehyde fixation, the samples were incubated in PBS containing 1% BSA, 0.1% Triton X-100 and 2% H 2 O 2, for 1 h at 37°C to block non-specific antibody binding and to quench the endogenous peroxidase activity of the cells. To detect the HTLV-1 complexes, the cells were incubated with 5 µg/ml of anti-Gag p19 (GIN7 mAb) [33] diluted in PBS 1% BSA, for 1 h at 37°C. Then the second antibody, anti-Mouse mAb conjugated to HRP (Invitrogen Ltd, Paisley, UK ), was added at a final dilution of 1 µg/ml, and incubated for 30 minutes at 37°C. The cells were washed three times with PBS containing 1% BSA between each step. The sample was centrifuged and embedded into a 1% agarose gel (Sigma-Aldrich Ltd, Dorset, UK). A 1 mg/ml DAB solution (Invitrogen Ltd, Paisley, UK ) diluted in PBS/1%BSA was added to the samples and incubated for 15 minutes at room temperature with gentle shaking. The staining was detected by adding to the samples 0.03% H 2 O 2 diluted in PBS/1%BSA. The samples turned brown within 30 s to 5 min and the reaction was then stopped by washing extensively with PBS. Between each procedure the cells were centrifuged at 1000 g and washed thoroughly at least three times in PBS. The samples were finally fixed for at least 5 minutes in a 1% OsO 4 solution (samples turned black) and washed 5 times before further processing. Electron microscopy, tomography, modelling and data analysis Electron microscopic data were collected with an FEI Tecnai F30 FEG transmission electron microscope (FEG-TEM) (FEI Company, Eindhoven, The Netherlands) at an electron voltage of 300 kV. The TEM was equipped with an energy filter (Gatan imaging filter (GIF), Gatan, Inc., Abingdon, UK). Electron micrographs were recorded using the software Digital Micrograph (Gatan, Inc., Abingdon, UK) with a Gatan 2k×2k slow-scan CCD camera. Most tomographic data sets were recorded at a few microns under focus using the GIF with a slit width of 20–25 eV to accentuate contrast. Tilt series for tomography were recorded in steps of 1° over a tilt range of typically −65° to +65° using the FEI software. Most tomographic data sets were recorded using a flip-flop sample holder (Gatan) that allows one to turn the sample by 90° inside the EM column. A few data sets were recorded in the Laboratory for 3-Dimensional Electron Microscopy of Cells in Boulder, Colorado with a FEI Tecnai F30 FEG-TEM (without energy filter). These data were recorded using the software SerialEM (Boulder, Colorado) with a Gatan CCD camera. Tomograms were processed with the tomography software IMOD [34] and surface representations were generated using both IMOD and the software package AMIRA (Mercury Computer Systems, Inc.). Data analysis was performed using IMOD, AMIRA and Matlab (The MathWorks). Membrane-membrane spacings were measured using a program that calculates the distance between each voxel of the digitized membrane model (surface representation) and its nearest neighbour in the opposite cell membrane. The size of individual HTLV-1 particles was determined by measuring an averaged diameter in the section (through the 3D object) of largest appearance of the particle.
Supporting Information Movie S1 Tomographic reconstruction showing a large number of HTLV-1 particles of variable size in the space between a chronically infected MS9 cell (top) and a potential Jurkat target cell (bottom). The particles are characterized by an electron-dense core surrounded by a less dense area and enveloped by the electron-dense viral membrane. The average diameter of HTLV-1 particles derived from MS9 cells was 126.0 +/− 31.3 nm (SD). White arrows indicate areas in the MS9 cell where viral capsid protein accumulates below the membrane in anticipation of virus budding. Three small parts of mitochondria (upper left corner) and several microtubules are visible in the MS9 cell cytoplasm. A slice through the entire tomogram is shown in Figure 3D . The sample was fixed with PFA/glutaraldehyde, embedded in Agar 100 resin, post-fixed with OsO4 and stained with lead citrate. The reconstructed 3D volume is composed of tomograms obtained from four serial sections. The tomograms were calculated from tilt series of 121 images (tilt range −60° to +60°, 1° increment). The images were recorded with a 2k×2k Gatan CCD camera (pixel size 1.21 nm) at an under focus of −0.2 µm with an FEI Tecnai F30 FEG-TEM (300 kV) in Boulder, Colorado using the software SerialEM. The reconstruction was calculated using the software IMOD. The tomogram represents a volume with an area of 1.94×1.28 µm2 and a thickness of 640 nm. The scale bar at the end of the movie corresponds to 400 nm. (1.35 MB MPG) Click here for additional data file. Movie S2 Tomographic reconstruction showing a few virus particles that budded from a naturally HTLV-1 infected CD4+ T cell (PBMC) into the synaptic cleft. Most of the virions are not attached to a cell membrane. The particles are characterized by an electron-dense core surrounded by a less dense area and enveloped by the electron-dense viral membrane. The average diameter of HTLV-1 particles derived from naturally HTLV-1 infected CD4+ T-cell (PBMC) was 105.2 +/− 21.8 nm (SD). A slice through the entire tomogram is shown in Figure 3E . The sample was fixed with PFA/glutaraldehyde, embedded in Agar 100 resin, post-fixed with OsO4 and stained with lead citrate. The tomogram was calculated from a tilt series of 141 images (tilt range −70° to +70°, 1° increment). The images were recorded with a 2k×2k Gatan CCD camera (pixel size 1.21 nm) at an under focus of −0.2 µm with an FEI Tecnai F30 FEG-TEM (300 kV) in Boulder, Colorado using the software SerialEM. The reconstruction was calculated using the software IMOD. The tomogram represents a volume with an area of 1.70×2.24 µm2 and a thickness of 176 nm. (8.45 MB MPG) Click here for additional data file. Movie S3 Tomographic reconstruction showing the virological synapse between a naturally HTLV-1-infected CD4+ T-cell (PBMC) (right) and a target cell (autologous uninfected CD4+ T-cell) (left). Virus transmission can be seen in two separate synaptic clefts. The HTLV-1 particles are in simultaneous contact with the two cell membranes and are extremely electron-dense due to the labelling of the viral Gag p19 matrix protein (see also Movies S4 and S5 ). Parts of the two plasma membranes are also darkly stained, indicating the presence of viral Gag protein. The presence of two centrioles (long white arrows), two Golgi apparatuses (short, thick white arrows) and several mitochondria close to the VS reflects the polarization of the microtubule organizing centre (MTOC) of the HTLV-1-infected CD4+ T cell towards the cell-cell contact. Parts of the cell nucleus can be seen in both cells. Tomogram slices through the 3D reconstruction can be seen in Figure 4A,B and a surface representation of the synapse is shown in Figure 4C . The sample was fixed with PFA/glutaraldehyde, labelled against viral Gag p19 matrix protein, embedded in Agar 100 resin and post-fixed with OsO4. The reconstructed 3D volume is composed of tomograms obtained from five serial sections. The tomograms were calculated from tilt series of 131 images (tilt range −65° to +65°, 1° increment). The images were recorded with a 2k×2k Gatan CCD camera (pixel size 1.29 nm) at an under focus of −3.0 µm with an FEI Tecnai F30 FEG-TEM (300 kV) using the FEI software. The reconstruction was calculated using the software IMOD. The tomogram represents a volume with an area of 1.55×2.66 µm2 and a thickness of 343 nm. The scale bar at the end of the movie corresponds to 500 nm. (6.59 MB MPG) Click here for additional data file. Movie S4 Detail of the tomographic reconstruction shown in Movie S3 illustrating an HTLV-1 particle trapped between the cell membranes. The enveloped virion touches both cell membranes. Some dense material links the particle with the target membrane (black area above the particle). See also Figure 4D . For technical details see legend of Movie S3 . (9.17 MB MPG) Click here for additional data file. Movie S5 Detail of the tomographic reconstruction shown in movie 3A illustrating HTLV-1 particles trapped between the cell membranes. The enveloped virions touch both cell membranes. See also Figure 4G . For technical details see legend of Movie S3 . (6.84 MB MPG) Click here for additional data file. Movie S6 Tomographic reconstruction showing the virological synapse between a naturally HTLV-1-infected CD4+ T-cell (bottom) and an autologous uninfected CD4+ T-cell cell, target cell (top). A large HTLV-1 particle (black arrow) is held between the two cell membranes and is extremely electron-dense due to the labelling against viral Gag p19 matrix protein (see also Movie S7 ). Parts of the two plasma membranes and inter-membrane material are also darkly stained, indicating the presence of abundant viral Gag protein. Several mitochondria have accumulated at the VS within the HTLV-1-infected CD4+ T (PBMC) which is characteristic of MTOC polarization, and is also seen in the IS. A tomogram slice showing a larger area of the 3D reconstruction can be seen in Figure 4D . The sample was fixed with PFA/glutaraldehyde, labelled against viral Gag p19 matrix protein, embedded in Agar 100 resin and post-fixed with OsO4. The reconstructed 3D volume is composed of tomograms obtained from five serial sections. The tomograms were calculated from tilt series of typically 131 images (tilt range −65° to +65°, 1° increment). The images were recorded with a 2k×2k Gatan CCD camera (pixel size 1.29 nm) at an under focus of −5.0 µm with an FEI Tecnai F30 FEG-TEM (300 kV) using the FEI software. The reconstruction was calculated using the software IMOD. The tomogram represents a volume with an area of 2.24×0.98 µm2 and a thickness of 313 nm. The scale bar at the end of the movie corresponds to 500 nm. (4.18 MB MPG) Click here for additional data file. Movie S7 Detail of the tomographic reconstruction shown in Movie S6 illustrating an HTLV-1 particle held between the cell membranes. The enveloped virion touches both cell membranes simultaneously. Some dense material links the particle with the target membrane (black area in the bottom right of the particle at the end of the movie). See also Figure 4H . For technical details see legend of Movie S6 . (6.83 MB MPG) Click here for additional data file. Movie S8 Tomographic reconstruction showing a synaptic cleft formed between a chronically HTLV-1-infected MS9 cell (right) and a target Jurkat cell (left). The synaptic cleft is completely enclosed by a close membrane-membrane contact extending over a large area with a diameter of about 6 µm (see Figure 3A and Figure 5A ). The membrane-membrane distance in areas of close apposition is about 20 nm. Two HTLV-1 particles are in the synaptic cleft (white arrowheads). White arrows indicate areas in the MS9 cell where viral capsid protein has accumulated below the membrane before directed virus budding. A tomogram slice showing a larger area of the 3D reconstruction can be seen in figure 5A . The sample was fixed with PFA/glutaraldehyde, embedded in Agar 100 resin, post-fixed with OsO4 and stained with lead citrate. The reconstructed 3D volume is composed of tomograms obtained from two serial sections. The tomograms were calculated from tilt series of typically 121 images (tilt range −60° to +60°, 1° degree increment). The images were recorded with a 2k×2k Gatan CCD camera (pixel size 1.54 nm) at an under focus of −0.2 µm with an FEI Tecnai F30 FEG-TEM (300 kV) in Boulder, Colorado using the software SerialEM. The reconstruction was calculated using the software IMOD. The tomogram represents a volume with an area of 1.32×1.92 µm2 and a thickness of 326 nm. The scale bar at the end of the movie corresponds to 500 nm. (2.09 MB MPG) Click here for additional data file. Movie S9 Surface representation of the synaptic cleft between a chronically HTLV-1-infected MS9 cell and a Jurkat target cell shown in tomogram 5a. The cell membranes are depicted in yellow and HTLV-1 particles in blue. The red areas represent membrane segments within the MS9 cell where viral capsid protein has accumulated in anticipation of directed virus budding. The surface representation was generated using the software packages IMOD and AMIRA. (9.80 MB MPG) Click here for additional data file.
📊 Figures
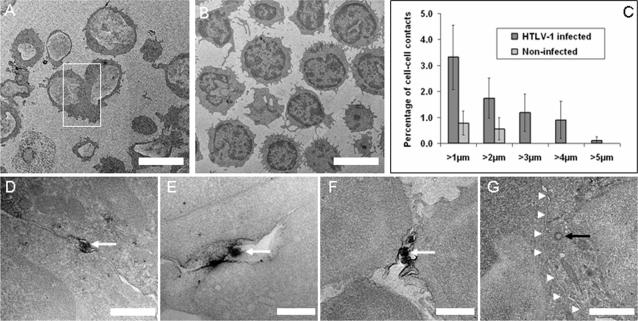
Figure 1
Two-dimensional ultrastructure of the HTLV-1 virological synapse.
A, B Low-magnification images of single CD4+ T cells and cell-cell conjugates: A, naturally HTLV-1 infected CD4+ T cells (PBMCs); B, non-infected CD4+ T cells. Cell-cell conjugates were significantly ...
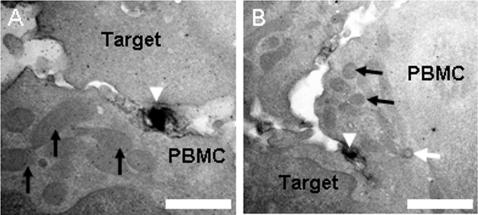
Figure 2
Polarization of mitochondria and microtubule organization centre of the HTLV-1 infected cell towards the target cell.
A,B Virological synapses (VS) formed between naturally HTLV-1 infected CD4 + T cells (PBMCs) and autologous uninfected CD4 + target cells as shown in Movies S6 u2013 S7 and S3 , S4 , S5 , respectively...
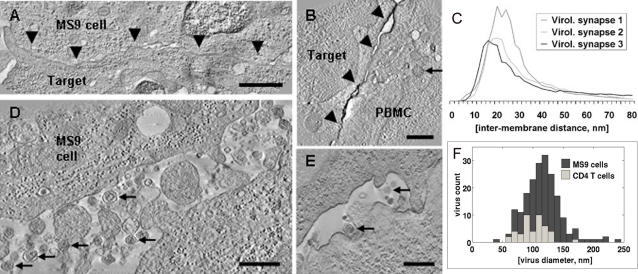
Figure 3
VS membrane-membrane distances and HTLV-1 virion diameter.
A, B Tomogram slices showing close membrane apposition in the HTLV-1 virological synapse (VS) (black arrowheads): A, VS formed between an HTLV-1 infected MS9 cell as a donor and Jurkat cell as target....
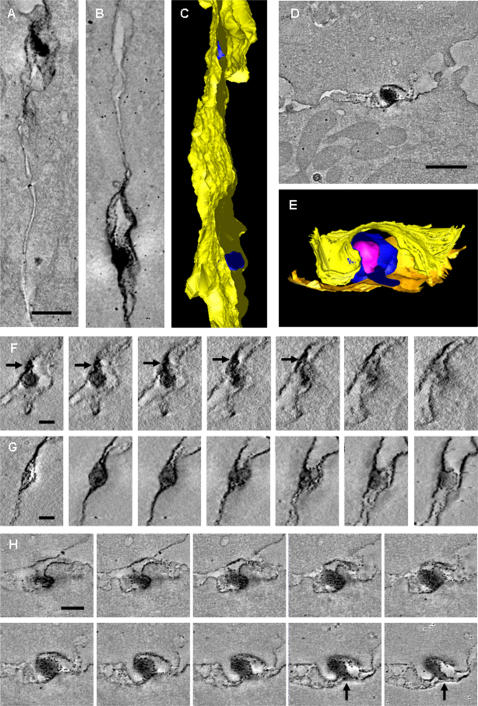
Figure 4
Three-dimensional ultrastructure of the VS: enveloped HTLV-1 virions are trapped in multiple isolated synaptic clefts.
Cell-to-cell transmission of HTLV-1 as observed in tomograms of the VS formed between HTLV-1 infected CD4 + T-cell (PBMC) and an autologous uninfected CD4 + T-cell as a target cell. These cells were s...
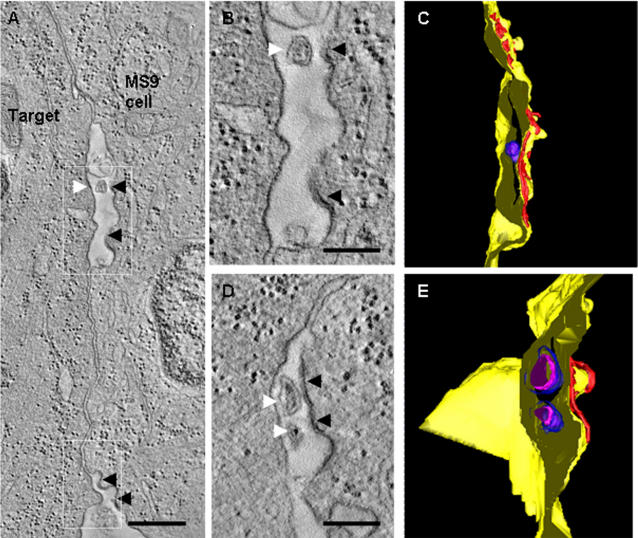
Figure 5
Tomogram slices and surface representations of the virological synapse between an HTLV-1 infected MS9 cell and a target cell.
A, The VS is characterized by a tight membrane-membrane contact with an inter-membrane spacing of about 20 nm. Viral budding sites (black arrowheads) and virus particles (white arrowhead) can be detec...
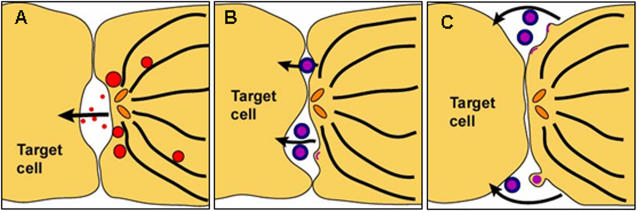
Figure 6
Models of immunological and virological synapses.
A, Upon formation of an IS between a cytotoxic T lymphocyte (CTL) and a target cell the microtubule organizing centre is polarized towards the synapse (the centrioles are depicted as orange ellipses)....
Figure images are served from the NIH/NLM PubMed Central Open Access Subset or Europe PMC; copyright remains with the publishers and authors.
💬 Discussion
0 commentsNo comments yet. Be the first to start a discussion!
Leave a Comment