Abstract
AbstractMotile cilia and flagella beat rhythmically on the surface of cells to power the flow of fluid and to enable spermatozoa and unicellular eukaryotes to swim. In humans, defective ciliary motility can lead to male infertility and a congenital disorder called primary ciliary dyskinesia (PCD), in which impaired clearance of mucus by the cilia causes chronic respiratory infections1. Ciliary movement is generated by the axoneme, a molecular machine consisting of microtubules, ATP-powered dynein motors and regulatory complexes2. The size and complexity of the axoneme has so far prevented the development of an atomic model, hindering efforts to understand how it functions. Here we capitalize on recent developments in artificial intelligence-enabled structure prediction and cryo-electron microscopy (cryo-EM) to determine the structure of the 96-nm modular repeats of axonemes from the flagella of the alga Chlamydomonas reinhardtii and human respiratory cilia. Our atomic models provide insights into the conservation and specialization of axonemes, the interconnectivity between dyneins and their regulators, and the mechanisms that maintain axonemal periodicity. Correlated conformational changes in mechanoregulatory complexes with their associated axonemal dynein motors provide a mechanism for the long-hypothesized mechanotransduction pathway to regulate ciliary motility. Structures of respiratory-cilia doublet microtubules from four individuals with PCD reveal how the loss of individual docking factors can selectively eradicate periodically repeating structures.
🔬 Techniques
🔭 Microscopes
🧬 Organisms
💻 Software
🧪 Sample Preparation
🔬 Cell Lines
🏭 Microscope Brands
🧪 Reagent Suppliers
📷 Detectors
💻 Software Details
💾 Data Repositories
🏛️ Research Organizations (ROR)
Affiliated research institutions:
📋 Methods
Human subjects
Peripheral blood samples for genetic screening and respiratory epithelial cells, collected from the inferior nasal turbinate by nasal-scrape brushing, were obtained from affected individuals and healthy volunteers under ethical approval granted through the Health Research Authority London Bloomsbury Research Ethics Committee (REC 08/H0713/82; IRAS 103488) and Living Airway Biobank, administered through the UCL Great Ormond Street Institute of Child Health (REC 19/NW/0171, IRAS 261511, Health Research Authority North West Liverpool East Research Ethics Committee). Informed written consent was obtained from all participants before enrolment in the study. Affected individuals were diagnosed with PCD according to European Respiratory Society (ERS) diagnostic guidelines 51 .
Human genetic analysis
Genetic screening in patients with PCD was performed as previously described 42 for individual ID01 and by using a targeted next-generation sequencing panel 52 for individuals ID02, ID03 and ID04. A definitive genetic diagnosis was obtained according to ERS diagnostic guidelines 51 , involving the identification of biallelic pathogenic variants (found in a homozygous state in each case) in single PCD genes consistent for each defect observed by TEM. The first individual (ID01) is homozygous for a previously reported c.853G>A substitution in ODAD1 that causes an intronic insertion that ultimately results in a downstream nonsense codon (p.Ala248Thrfs52*) 42 . The second individual (ID02) carries a homozygous c.448C>T substitution that introduces a premature stop codon in ODAD1 (p.Arg150*) and has previously been associated with PCD 53 . The third individual (ID03) has a homozygous exon 1–3 deletion in CCDC40 , and the fourth individual (ID04) has a homozygous 5-base-pair deletion (c.1964_1968delCTCTT) in CCDC39 that introduces a premature stop codon through a frameshift (p.Glu655Glyfs*23). Clinical TEM TEM of nasal epithelial cells was performed at the University of Leicester, UK. Cells obtained by nasal brushing were fixed in 2.5% glutaraldehyde in either Sorenson’s phosphate or 0.05 M sodium cacodylate buffer for more than 24 h. Samples were subsequently incubated in 1% osmium tetroxide before embedding in 2% agar. Samples were dehydrated using an alcohol series that included increasing concentrations of ethanol/methanol and propylene oxide before embedding in epoxy resin. Ultrathin sections were cut and stained with uranyl acetate and Reynold’s lead citrate. Images were acquired using a room-temperature JEOL 1400+ transmission electron microscope. Representative examples are provided in Extended Data Fig. 7c .
Show full methods section
Human subjects
Peripheral blood samples for genetic screening and respiratory epithelial cells, collected from the inferior nasal turbinate by nasal-scrape brushing, were obtained from affected individuals and healthy volunteers under ethical approval granted through the Health Research Authority London Bloomsbury Research Ethics Committee (REC 08/H0713/82; IRAS 103488) and Living Airway Biobank, administered through the UCL Great Ormond Street Institute of Child Health (REC 19/NW/0171, IRAS 261511, Health Research Authority North West Liverpool East Research Ethics Committee). Informed written consent was obtained from all participants before enrolment in the study. Affected individuals were diagnosed with PCD according to European Respiratory Society (ERS) diagnostic guidelines 51 .
Human genetic analysis
Genetic screening in patients with PCD was performed as previously described 42 for individual ID01 and by using a targeted next-generation sequencing panel 52 for individuals ID02, ID03 and ID04. A definitive genetic diagnosis was obtained according to ERS diagnostic guidelines 51 , involving the identification of biallelic pathogenic variants (found in a homozygous state in each case) in single PCD genes consistent for each defect observed by TEM. The first individual (ID01) is homozygous for a previously reported c.853G>A substitution in ODAD1 that causes an intronic insertion that ultimately results in a downstream nonsense codon (p.Ala248Thrfs52*) 42 . The second individual (ID02) carries a homozygous c.448C>T substitution that introduces a premature stop codon in ODAD1 (p.Arg150*) and has previously been associated with PCD 53 . The third individual (ID03) has a homozygous exon 1–3 deletion in CCDC40 , and the fourth individual (ID04) has a homozygous 5-base-pair deletion (c.1964_1968delCTCTT) in CCDC39 that introduces a premature stop codon through a frameshift (p.Glu655Glyfs*23). Clinical TEM TEM of nasal epithelial cells was performed at the University of Leicester, UK. Cells obtained by nasal brushing were fixed in 2.5% glutaraldehyde in either Sorenson’s phosphate or 0.05 M sodium cacodylate buffer for more than 24 h. Samples were subsequently incubated in 1% osmium tetroxide before embedding in 2% agar. Samples were dehydrated using an alcohol series that included increasing concentrations of ethanol/methanol and propylene oxide before embedding in epoxy resin. Ultrathin sections were cut and stained with uranyl acetate and Reynold’s lead citrate. Images were acquired using a room-temperature JEOL 1400+ transmission electron microscope. Representative examples are provided in Extended Data Fig. 7c .
Cilia beat analysis
Videos of ciliated respiratory epithelium were acquired by high-speed video microscopy and analysed using a program designed in MATLAB R2022a (MathWorks) based on previous publications 54 , 55 . In brief, positions at the base and tips of cilia at the beginning and end of an active phase of a beat cycle were recorded. Ciliary beat frequency was calculated by fast Fourier transform and video-kymography. This analysis allowed the calculation of ciliary beat pattern parameters, such as cilium length, angle of beating and beating amplitude. Ciliary beat amplitude per second (beating amplitude × ciliary beat frequency) has previously been described as the best approach to discern between individuals with and without PCD 55 . We analysed 104 videos from 11 individuals without PCD as a control. Epithelial disruption scores Epithelial disruption scores were calculated from videos of nasal-scrape brushings as described previously 56 . In brief, epithelial edges were identified in each sample, investigated for protrusions or abnormalities, and scored from 1 to 4, where 1 indicates a normal ciliated edge, 2 indicates a ciliated edge with minor projections, 3 indicates a ciliated edge with major projections, and 4 is for single, unattached, ciliated cells.
Respiratory epithelial culture and cilia isolation
Cells obtained from nasal-scrape brushings (of both a healthy individual and four individuals with PCD) were seeded into collagen-coated wells (PureCol, Sigma-Aldrich, 5006-15MG) containing PneumaCult-Ex Plus medium (STEMCELL Technologies, 05040). The cells were passaged twice: once into a T25 flask and then onto 12 Transwell inserts, each with a surface area of 1.12 cm 2 (Corning, CLS3460) at a density of around 0.5–1.0 million cells per insert. Cells were cultured in PneumaCult-Ex Plus medium until confluent, at which time the medium in the basal chamber was replaced with PneumaCult-ALI medium (STEMCELL Technologies, 05001) and the apical surface was exposed to provide an air–liquid interface (ALI). All media contained Primocin (InvivoGen, ant-pm-05) and penicillin–streptomycin (Thermo Fisher Scientific, 15070063) to prevent the growth of bacteria. Ciliation was observed 4–6 weeks after transition to the ALI. During differentiation, the basolateral medium was refreshed every 2–3 days and the apical surfaces were washed with PBS to remove mucus. Before deciliation, differentiated ALI cultures were washed twice with PBS for 5 min to remove cell debris and mucus. Ice-cold PBS was then added to both compartments of the culture dish and the dish was placed on ice. After 5 min, the PBS solution was removed and 50 μl ice-cold deciliation buffer (10 mM Tris pH 7.5, 50 mM NaCl, 10 mM CaCl 2 , 1 mM EDTA, 0.1% Triton X-100, 7 mM β-mercaptoethanol, 1% protease inhibitor cocktail; Sigma-Aldrich, P8340) was added to the cells of each well. After incubation for 2 min without shaking, the cilia-containing solution was transferred to a microcentrifuge tube. This process was repeated six times to ensure that all dissociated cilia were collected. Cellular debris and mucus were removed by centrifugation at 1,000 g for 1 min at 4 °C. Axonemes were collected by centrifugation at 15,000 g for 5 min at 4 °C. The axonemal pellet was resuspended in buffer (30 mM HEPES pH 7.3, 1 mM EGTA, 5 mM MgSO 4 , 0.1 mM EDTA, 25 mM NaCl, 1 mM dithiothreitol, 1% protease inhibitor cocktail), flash-frozen in liquid nitrogen and stored at −80 °C until use.
Sample preparation for cryo-EM Splayed C. reinhardtii axonemes C. reinhardtii
(CC-1690) algae were cultured in standard Tris acetate phosphate medium at room temperature in 12 h:12 h light:dark cycles. Flagella were extracted from C. reinhardtii using the dibucaine method 57 , as described previously 5 . After removing the cell bodies, the detached flagella in the supernatant were collected by centrifugation at 3,000 g for 15 min. Freshly isolated flagella were splayed into DMTs as described previously 5 . In brief, flagellar membranes were first removed in fresh HMDEKP (30 mM HEPES, 25 mM KCl, 5 mM MgSO 4 , 0.5 mM EGTA, Protease Arrest (G-Biosciences)) by adding 1% NP-40 at 4 °C while rotating for 30 min. After washing away the detergent and other soluble proteins, axonemes were splayed at a final concentration of 0.5 mg ml −1 by treatment with 10 mM Mg 2+ ATP 2− and 750 μM CaCl 2 in HMDEKP while being rotated at room temperature for 1 h. Splayed axonemes were concentrated by centrifugation at 2,500 g and immediately used to prepare cryo-EM grids. Then 2.5 μl of splayed axoneme sample at 16–26 mg ml −1 was applied to glow-discharged C-Flat 1.2/1.3-4Cu grids (Protochips) inside a Vitrobot Mark IV (Thermo Fisher Scientific) kept at 100% humidity. The cryo-EM samples were then incubated 10 s, blotted for 10 s and plunged into liquid ethane cooled by liquid nitrogen.
Human respiratory-cilia axonemes
Human axonemes (3 μl) with an absorbance reading at 280 nm of 5.8 were applied to glow-discharged Quantifoil holey carbon grids (R2/1, copper, 400 mesh, Quantifoil Micro Tools, Q410CR1). The grids were blotted for 10–11 s with a blot force of 10 in 100% humidity before being plunged into liquid ethane using a Vitrobot Mark IV (Thermo Fisher Scientific).
Cryo-EM data collection and processing for splayed C. reinhardtii axonemes
A total of 36,918 micrographs of splayed C. reinhardtii axonemes were collected using SerialEM as described 58 on a Titan Krios microscope (Thermo Fisher Scientific) under conditions identical to our previous study 5 . Microscope settings are summarized in Extended Data Table 1 . All image processing was done using RELION-3.1 (ref. 59 ) or RELION-4.0 (ref. 60 ) unless otherwise stated. The dose-fractionated image stacks were aligned and dose-weighted using MotionCor2 software 61 . CTFFIND4 was used to estimate the parameters of the contrast transfer function (CTF) 62 . A total of 31,275 micrographs survived quality control on the basis of the absence of ice contamination, the quality of the Thon rings and the presence of splayed axonemes in the micrographs. Microtubules (including DMTs and singlet microtubules) were manually picked on each micrograph by defining their start and end coordinates in RELION. Overlapping microtubules were avoided. The selected microtubules were computationally divided into overlapping boxes (200 × 200 pixels, bin 2) with an 82-Å non-overlapping region (step size) between adjacent boxes, corresponding to the approximate length of the tubulin α/β-heterodimer. A total of 8,546,747 8-nm particles were extracted and aligned by multiple rounds of 2D classification, with the 106,857 particles that fell into poorly defined classes being discarded. The remaining 8,439,890 particles were analysed using both a DMT-centred approach 13 and an ODA-centred approach 5 (Supplementary Figs. 1 – 3 ). In the DMT-centric method, the 8-nm particles underwent 3D refinement and classification to select 2,058,898 particles with well-resolved DMT density. These particles were re-extracted without downscaling in 600-pixel boxes, 3D-refined, CTF-refined, polished and CTF-refined again. In the ODA-centric method, the 8-nm particles underwent 3D refinement and classification to yield three ODA-bound classes. These three classes corresponded to ODA centred in the map and two shifted by ±8 nm from the centre. The off-centre classes were re-extracted to centre the ODA in the map to generate a ‘24-nm particle’ set. To maximize particle number, we extracted new particles 24 nm and 48 nm from this set. A second round of 3D refinement and classification yielded 1,028,815 24-nm particles with a centred ODA. These particles were then re-extracted without downscaling in 600-pixel boxes, 3D-refined, CTF-refined, polished and CTF-refined for a second time. For both the DMT- and ODA-centric approaches, maps of the 48-nm repeat were obtained by 3D classification using a mask on the lumen of A-tubule protofilaments A08–A13 where MIPs have 48-nm periodicity 13 . For the DMT-centric approach, this yielded six different registries of the 48-nm repeat, and for the ODA-centric approach, two registries from the previously determined 24-nm repeat maps were identified. We then obtained 96-nm maps by a second round of 3D classification using a custom mask over the external axonemal complexes, including RSs, the N-DRC baseplate and IDA f to yield a total of 12 different registries from the DMT-centric approach, and 4 different registries from the ODA-centric approach. To overcome conformational heterogeneity and loss of individual complexes during sample preparation, each axonemal complex was analysed by 3D classification and refinement following the subtraction of signal outside the area of interest (Supplementary Figs. 4 – 9 ). Where appropriate, maps were obtained by combining subtracted particles from different registries and from both the DMT- and ODA-centric approaches. When combining particles, strict controls were used to prevent particle duplication. Focused maps of individual axonemal complexes were positioned on the DMT using unmasked box 600 reference maps from 3D refinement containing IDAs, ODAs and the N-DRC. Because of the low resolution, the motor domains of IDA b and IDA e are copies of IDA g , the other centrin-containing IDA. The maps were then combined into a single composite map that covered a 96-nm section of the DMT using the ‘vop maximum’ command in ChimeraX 63 . The initial composite map was then cropped using the subregion selection tool of Chimera to remove empty regions and reduce the file size.
Cryo-EM data collection and processing for human respiratory DMTs
A total of 37,071 micrographs of human respiratory DMTs were acquired using a Titan Krios microscope (Thermo Fisher Scientific) under conditions identical to our previous study 64 . Microscope settings are summarized in Extended Data Table 1 . The videos were motion- and CTF-corrected using MotionCor2 (ref. 61 ) and CTFFIND4 (ref. 62 ), respectively. 16,933 micrographs survived quality control. Microtubule start and end points were selected from the micrographs using RELION manual picking. 2,582,833 8-nm particles were extracted from the micrographs in 512-pixel boxes, downscaled to 256-pixel boxes to accelerate computation. 2D classification was done to check image quality, not to exclude particles. A 15-Å-resolution map of the bovine respiratory DMT ( EMD-24664 ) 37 was used as an initial reference for 3D refinement, followed by 3D classification without image alignment to exclude bad particles. To increase the number of retained particles, we repeated the process and merged all the good particles while excluding duplicates. In total, 1,903,665 8-nm particles were retained and re-extracted without binning. Then 16-nm particles were generated from the 8-nm particles using 3D classification with a cylindrical mask on 16-nm repeating MIPs near the inner junction. Subsequently 48-nm particles were generated from the 16-nm particles using 3D classification with a cylindrical mask on 48-nm repeating MIPs near the seam of the A tubule. Finally, 96-nm particles were generated from the 48-nm particles using 3D classification with a cylindrical mask on 96-nm repeating axonemal proteins on protofilaments A02–A03. This resulted in two parts of the 96-nm repeat with 90,482 and 87,789 particles. Local refinements using 60 different cylindrical masks, each corresponding to a 16-nm longitudinal section of 2 or 3 protofilaments, were then performed to improve the resolution of the protofilaments and closely associated microtubule-binding proteins. The resolution within each mask improved to 3.3–3.8 Å. The map quality of the external axonemal complexes was improved using particle re-centring, 3D classification, mask-focused local refinement and multi-body refinement. The resulting maps and their nominal resolutions (based on the FSC = 0.143 criterion) are listed in Supplementary Fig. 14 . Only 13,340 ODA-containing particles were observed, which prevented analysis of different conformational states, as done for our C. reinhardtii dataset. Maps were postprocessed using Phenix_autosharpen and merged in ChimeraX to generate a composite map. A schematic of the processing scheme is provided in Supplementary Fig. 13 .
Cryo-EM data of respiratory
DMTs from human patients with mutations in CCDC39 and CCDC40 were collected on a Titan Krios microscope under conditions identical to those for the wild type, yielding 3,423 and 3,483 micrographs, respectively.
Cryo-EM data of respiratory
DMTs from human patients with ODAD1 mutations were collected on a Talos Arctica microscope (Thermo Fisher Scientific) equipped with a K3 detector (Gatan), yielding 56 and 146 micrographs of the ODAD1 nonsense mutant and the splice mutant, respectively. Data were collected with a defocus range between −1.0 μm and −2.2 μm and at a nominal magnification of ×36,000, yielding a pixel size of 1.1 Å. Each micrograph was fractionated into 50 video frames with a total dose of 52.562 electrons per Å 2 . Data processing followed the scheme established for the wild-type dataset (Supplementary Fig. 13 ). For data processing of the CCDC39 and CCDC40 mutants, around 280,000 8-nm particles were randomly selected and used to generate 48-nm maps. The same number of wild-type particles were processed in the same way to generate a matched control. The three 48-nm maps were lowpass filtered to 8 Å for comparison in Fig. 6e . For data processing of the ODAD1 mutants, 12,884 and 35,541 8-nm particles were extracted for the ODAD1 nonsense mutant and splice mutant, respectively. Only 8-nm maps were generated because of the limited particle numbers. ODAD1 mutant maps and an 8-nm wild-type map (from the above-mentioned 280,000 particles) were lowpass filtered to 12 Å for comparison in Fig. 6d .
Model building and refinement
Maps of the C. reinhardtii DMT were interpreted by combining previous structures, AI-guided structural predictions 65 , cryo-ET studies 3 , 24 , 39 , 41 , 66 – 68 and de novo modelling using Coot 69 . Previous structures were used to model the DMT and its associated MIPs (PDB: 6U42 ) 13 , RS1 and RS2 (PDB: 7JTS , 7JTK and 7JU4 ) 14 , the N-DRC baseplate (PDB: 7JU4 ) 14 and the ODA with its docking complex (PDB: 7KZM and 7KZO ) 5 and LC1 subunit (PDB: 6L4P ) 70 . Models of the C1 (PDB: 7SQC ) 15 and C2 (PDB: 7SOM ) 15 microtubule were used to make Fig. 1b . Structure predictions of other axonemal proteins were obtained using AlphaFold2 (ref. 71 ) using primary sequences from Phytozome v.13 and UniProt. Homology models of the dynein motor domains (including the linker, AAA+ modules, stalk and microtubule-binding domain) were generated in the post-powerstroke state using SWISS-MODEL 72 , as they were too large to be modelled by AlphaFold2. Protein–protein interactions were modelled using AlphaFold2 multimer 73 . Examples of subcomplexes modelled using AlphaFold2 multimer are shown in Supplementary Figs. 10 – 12 . Axonemal complexes were assembled from modelled proteins and subcomplexes by positioning them in the cryo-EM maps using ChimeraX 63 or Coot 69 . The subtomogram average of the 96-nm repeat from C. reinhardtii ( EMD-6872 ) 24 was used to help position the motor domains of IDA b and IDA e . Multiple rounds of AlphaFold2 multimer prediction were used to improve the interfaces between neighbouring proteins. Finally, all chains were merged into a single PDB file using Coot and given a unique chain ID. Proteins identified in this study are provided in Supplementary Table 1 and the rationale for their placement is given in Supplementary Table 2 . Our splaying method of sample preparation causes axonemal dyneins to lose their connection with the neighbouring DMT. As a result, we do not observe density for the microtubule-binding domains of the axonemal dyneins, but we included them in our models for completeness. Homology models of motor domains were positioned by fitting into the observed cryo-EM densities for the linker, individual AAA+ modules and, where possible, the base of the stalk. Loss of connection to the neighbouring DMT may have also caused subtle changes in the conformation of the dynein motors relative to intact cilia. Small adjustments of the model may therefore be needed to model subtomogram averages of intact axonemes. In addition, although we observed two different conformational states for the C. reinhardtii β-HC, as described previously 5 , we have modelled only the orientation in which the stalks extend towards the proximal end, because this conformation is most common in ODA structures from intact axonemes 74 . To construct the model of the axoneme’s 9 + 2 architecture (Fig. 1b ), we used subtomogram averages of DMT1 ( EMD-2113 ), DMT2-8 ( EMD-2132 ), DMT9 ( EMD-2118 ) 3 and the central apparatus ( EMD-31143 ) 75 , and EMD-6756 (ref. 29 ) was used to guide the placement of DMTs relative to one another. The map of the human 96-nm repeat was initially fitted with two copies of the pre-existing model of the human DMT 48-nm repeat (PDB: 7UNG ) 64 . This revealed an additional MIP, RIBC1, which had been incorrectly assigned as RIBC2 in the 48-nm repeat. Building of the external axonemal complexes was then guided by the model of the C. reinhardtii 96-nm repeat and published models of the bovine ODA-DC (PDB: 7RRO ) 37 and mouse RS head (PDB: 7DMP ) 76 . Human homologues of C. reinhardtii axonemal proteins were identified from the results of BLAST searches (available from http://chlamyfp.org/) 77 . Subcomplexes of the human proteins were predicted by AlphaFold2 multimer and placed in the cryo-EM density. A full list of positioned proteins is provided in Supplementary Table 3 . The rationale for the placement of proteins without clear homology is given in Supplementary Table 4 . For both structures, fit-to-map was optimized using real-space refinement implemented in Coot, Namdinator 78 and Phenix 79 . The computational memory requirements needed to refine the 96-nm-long atomic model of the C. reinhardtii DMT meant that all-atom refinement could not be performed. Instead, three subregions were refined individually before being merged into a final PDB file. The smaller human model was refined as a single PDB file in Phenix. Atomic displacement factors for both models were refined using Phenix 79 . Side chains of asparagine, glutamine and histidine residues were automatedly flipped to improve hydrogen-bonding networks. Model statistics for the 96-nm modular repeat were generated using phenix.molprobity 80 and are provided in Extended Data Table 1 . Figures Figure panels and videos displaying cryo-EM maps or atomic models were generated using ChimeraX 63 . Maps coloured by local resolution were generated using RELION. Multiple-sequence alignments and phylogenetic trees were calculated using Clustal Omega 81 . Graphs were plotted in GraphPad Prism (GraphPad Software). Odds ratios (Fig. 3a ) were calculated using R v4.0.3. Software used in the project was managed by SBGrid 82 .
Materials availability
Genomic samples and sequencing data obtained from patients are stored at University College London. Airway cells are biobanked in the UCL Living Airway Biobank administered through the UCL Great Ormond Street Institute of Child Health. Reporting summary Further information on research design is available in the Nature Portfolio Reporting Summary linked to this article.
Materials availability
Genomic samples and sequencing data obtained from patients are stored at University College London. Airway cells are biobanked in the UCL Living Airway Biobank administered through the UCL Great Ormond Street Institute of Child Health.
Online content Any methods, additional references, Nature Portfolio reporting summaries, source data, extended data, supplementary information, acknowledgements, peer review information; details of author contributions and competing interests; and statements of data and code availability are available at 10.1038/s41586-023-06140-2.
Supplementary information Supplementary Information Reporting Summary Peer Review File Supplementary Video 1 Supplementary Video 2 Supplementary Video 3 Supplementary Video 4 Source data Source Data Extended Data Fig. 7
📊 Figures
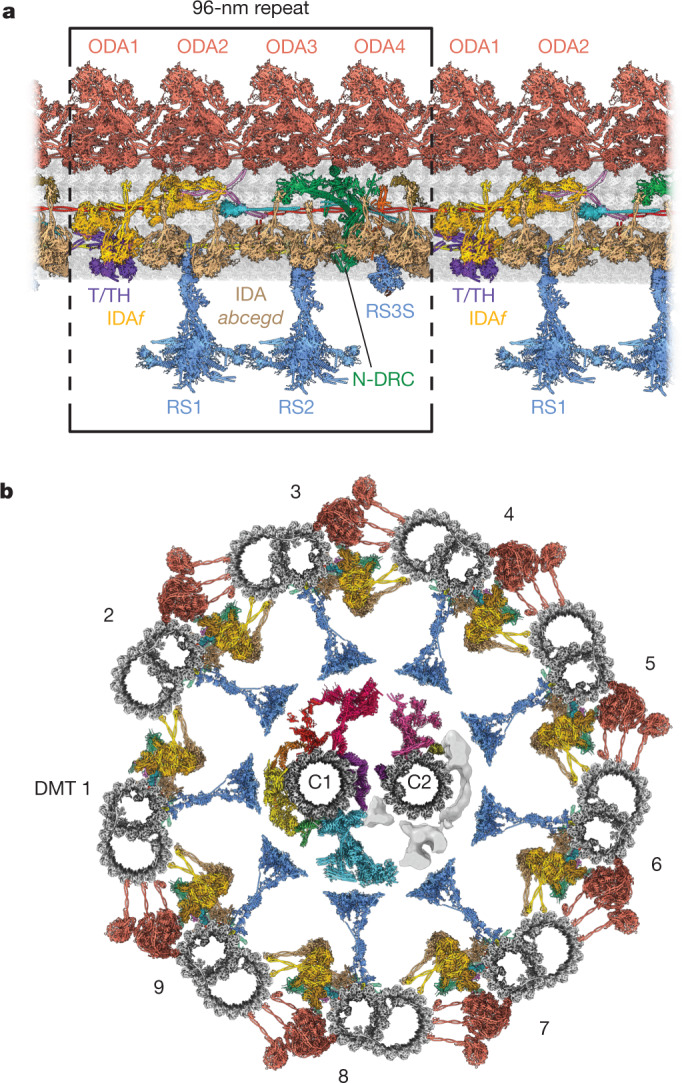
Fig. 1
Atomic model of the modular repeat of the C. reinhardtii axoneme.
a , A longitudinal section of an atomic model of a fully decorated DMT showing the 96-nm repeat boxed. b , Cross-sectional model of the C. reinhardtii axoneme composed of nine copies of the 96-nm repe...
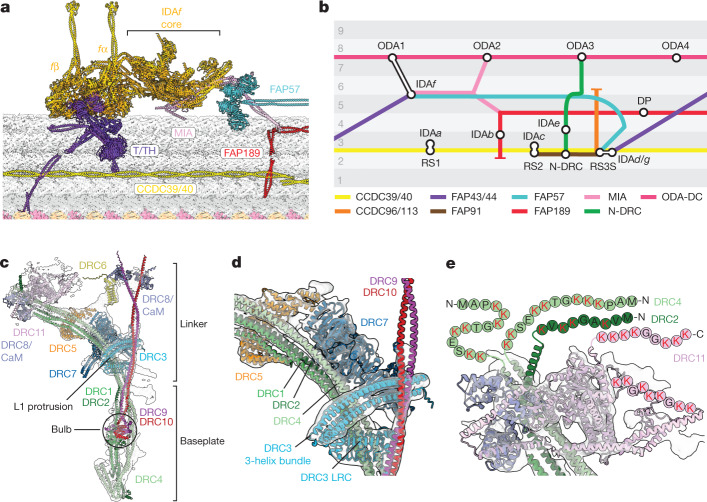
Fig. 2
Structures of mechanoregulatory complexes from the C. reinhardtii axoneme.
a , Atomic model depicting the multipartite tethering of IDA f by the MIA complexu00a0(FAP73/100), a FAP57 homodimer and T/TH. Coiled coils of CCDC39/40 and FAP189 interact with T/TH and MIA, respecti...
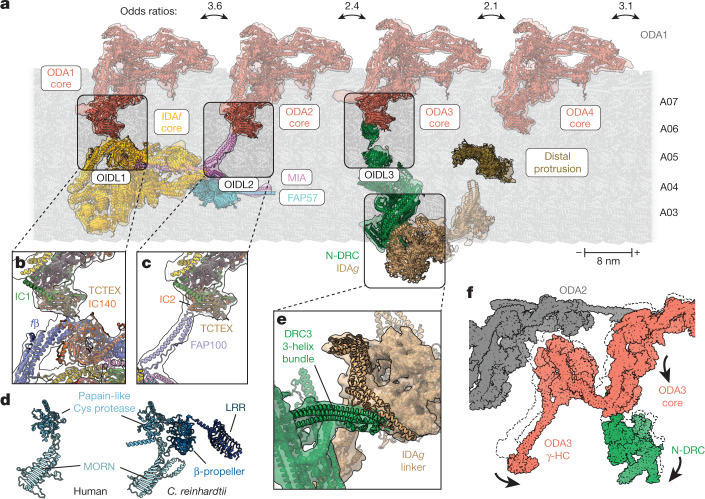
Fig. 3
Regulatory complexes modulate inter-dynein interactions.
a , Selected atomic models and their cryo-EM densities showing the longitudinal arrangement of ODA1u2013ODA4 and their adjacent complexes on the axoneme. Each ODA exists in open and closed conformatio...
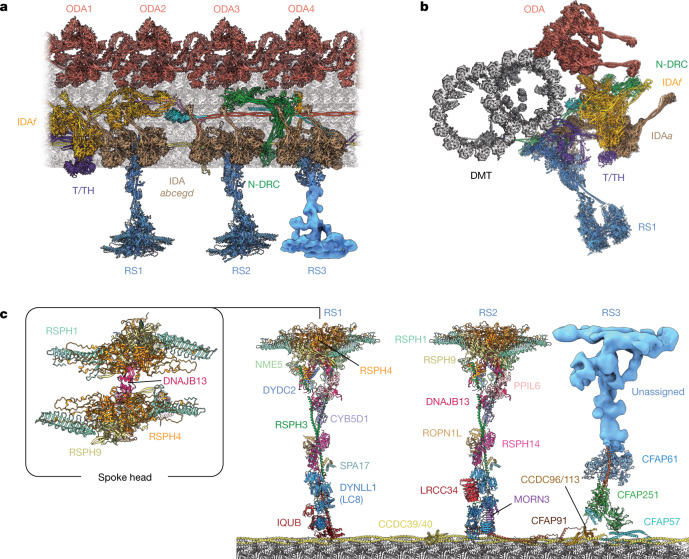
Fig. 4
Atomic model of the 96-nm repeat of a human axoneme.
a , Longitudinal section of the 96-nm repeat of a human respiratory-cilia DMT. b , Cross-section of a human DMT. c , Atomic model of human RSs coloured by subunit. The inset shows the symmetric head o...
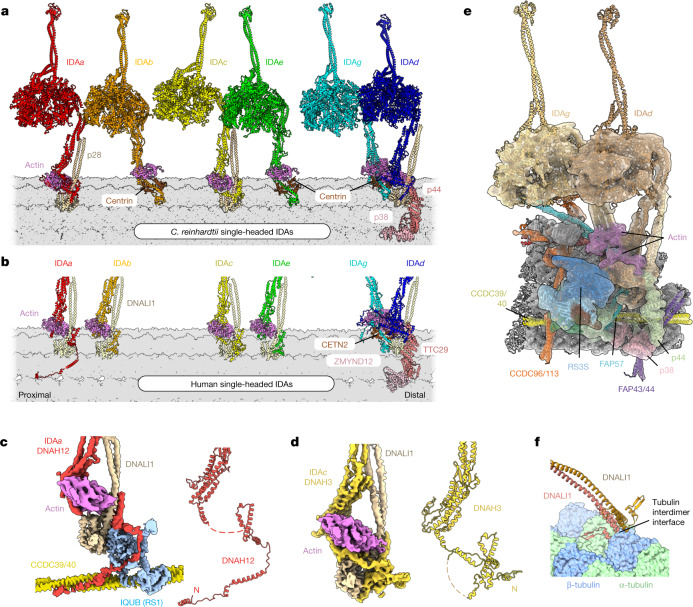
Fig. 5
Species-specific compositions and positions of single-headed IDAs.
a , Atomic model of the six single-headed IDAs as they appear on the C. reinhardtii DMT. Each IDA is associated with actin and either centrin or a p28 homodimer; p38 and p44 are specific docking facto...
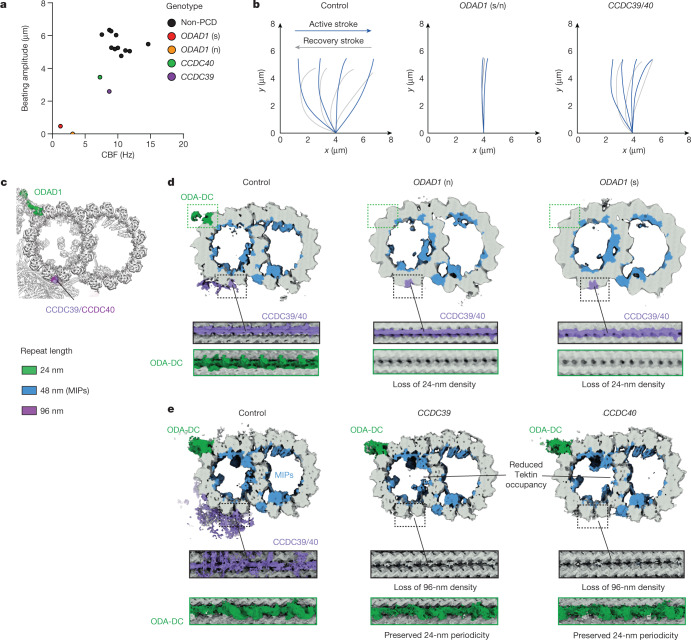
Fig. 6
Structures of DMTs from individuals with PCD.
a , Beating amplitude is plotted against ciliary beat frequency (CBF) for primary brushing samples from human nasal epithelia for 11 people without PCD and patients with PCD carrying biallelic ODAD1 (...
Extended Data Fig. 1
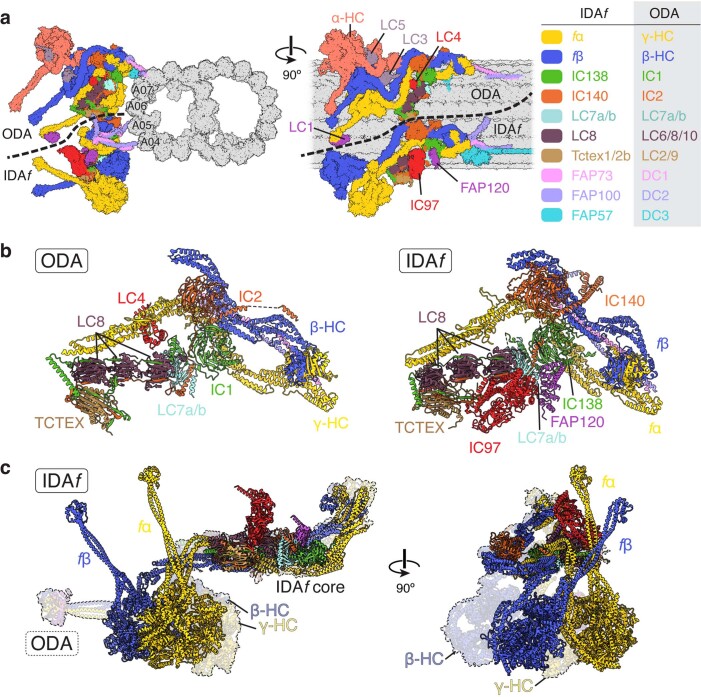
Structural comparison of inner dynein arm f (IDA f ) and outer dynein arm (ODA) from C. reinhardtii .
a , Atomic model showing outer dynein arm 1 (ODA1) and inner dynein arm f (IDA f ) bound to a doublet microtubule (DMT, gray). Dynein subunits are colored based upon their structural or functional sim...
Extended Data Fig. 2
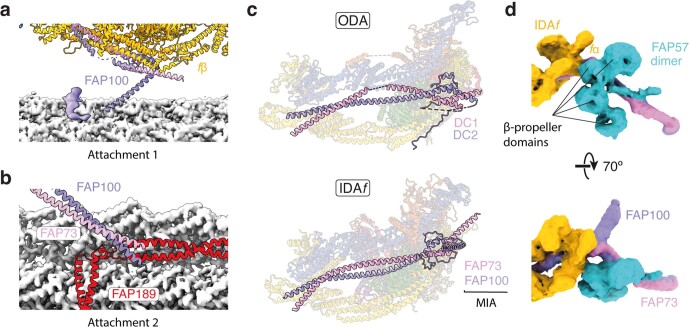
The C. reinhardtii MIA complex contributes to the docking of inner dynein arm f (IDA f ) to the doublet microtubule (DMT).
a , MIA (a heterodimer of FAP73/FAP100) interacts with protofilament A05 of the DMT through a C-terminal helix of FAP100 beneath the f u03b2 heavy chain tail. Unmodeled density of FAP100 is also shown...
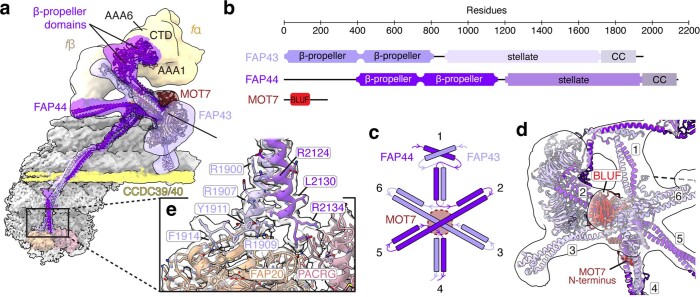
Extended Data Fig. 3
Structure of the C. reinhardtii tether/tetherhead (T/TH) complex.
a , Composite cryo-EM map colored by T/TH subunit and the motor domains of inner dynein arm (IDA) f u03b1 and f u03b2. The doublet microtubule surface is shown in gray. The N-terminal pair of u03b2-pr...
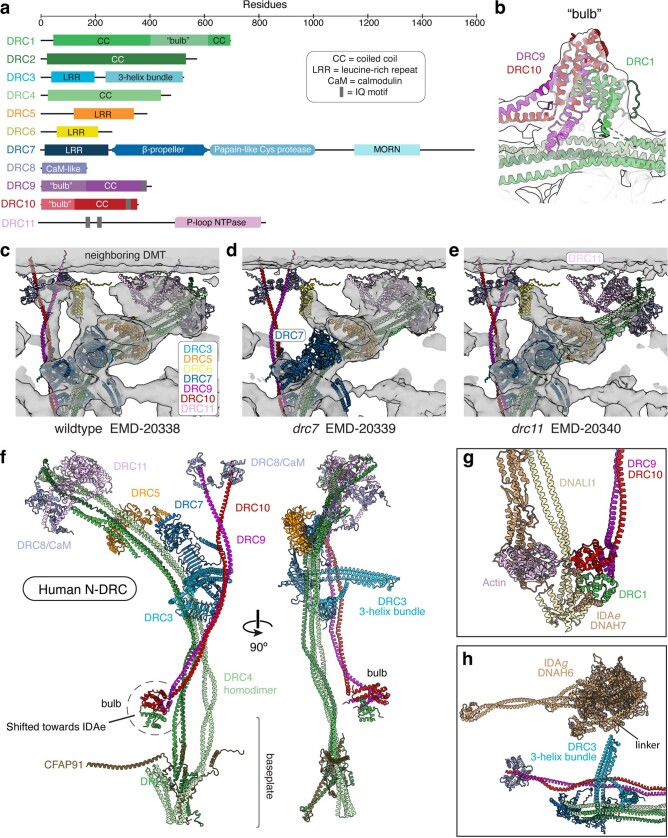
Extended Data Fig. 4
Integrative modeling of the nexin-dynein regulatory complex (N-DRC) from C. reinhardtii and H. sapiens .
a , Domain architecture of C. reinhardtii N-DRC subunits. b , Architecture of the N-DRC u201cbulbu201d in C. reinhardtii . c , Model of the N-DRC linker in the cryo-ET subtomogram average of the wildt...
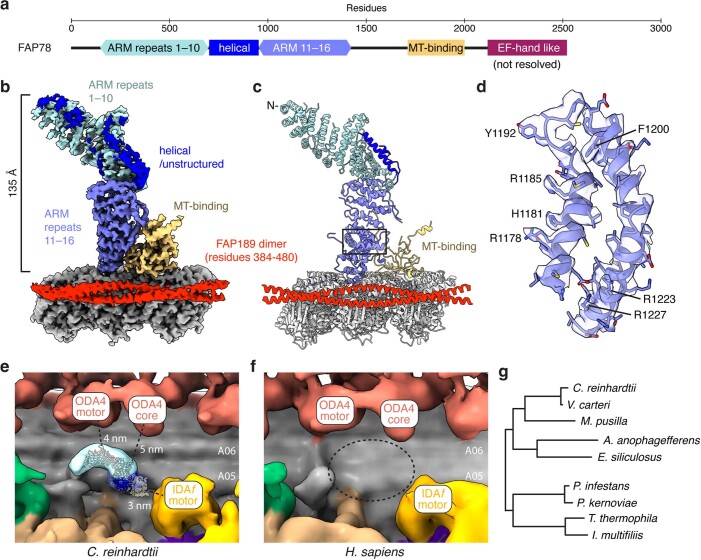
Extended Data Fig. 5
Identification of FAP78 as the distal protrusion (DP) of the C. reinhardtii axoneme.
a , Domain architecture of FAP78. FAP78 contains 16 armadillo (ARM) repeats interrupted with a helical/unstructured region. The C-terminal half contains a microtubule (MT) binding domain and an EF-han...
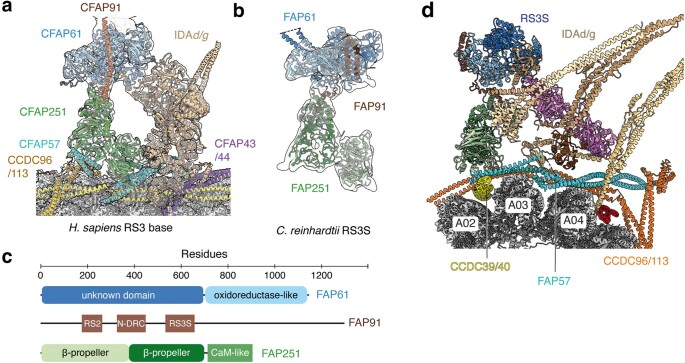
Extended Data Fig. 6
Radial spoke 3 (RS3).
a , Model and cryo-EM map showing the base of human RS3 and its association with IDA d/g . Coiled coils from CCDC96/113 and CFAP57 are docking factors for RS3. CFAP43/44 (components of the T/TH comple...
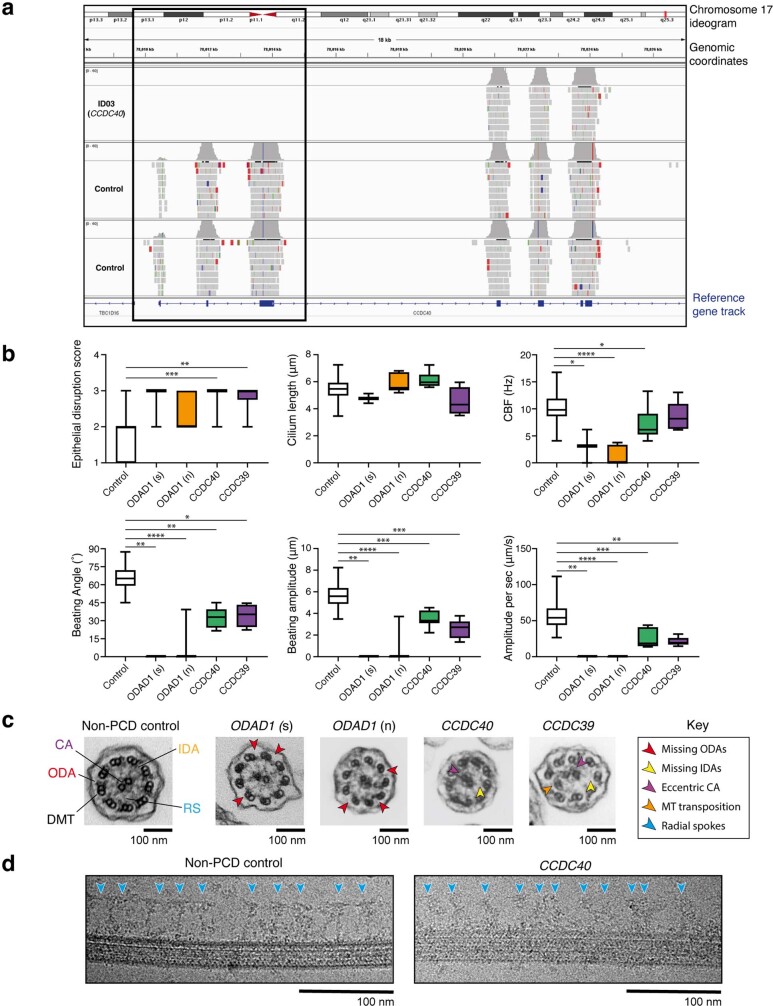
Extended Data Fig. 7
Primary ciliary dyskinesia (PCD) patient information.
a , Integrative Genomics Viewer (IGV) snapshot illustrating the homozygous exon 1u20133 deletion in the CCDC40 gene of patient ID03. b , Analysis of high-speed video data from PCD patients showing def...
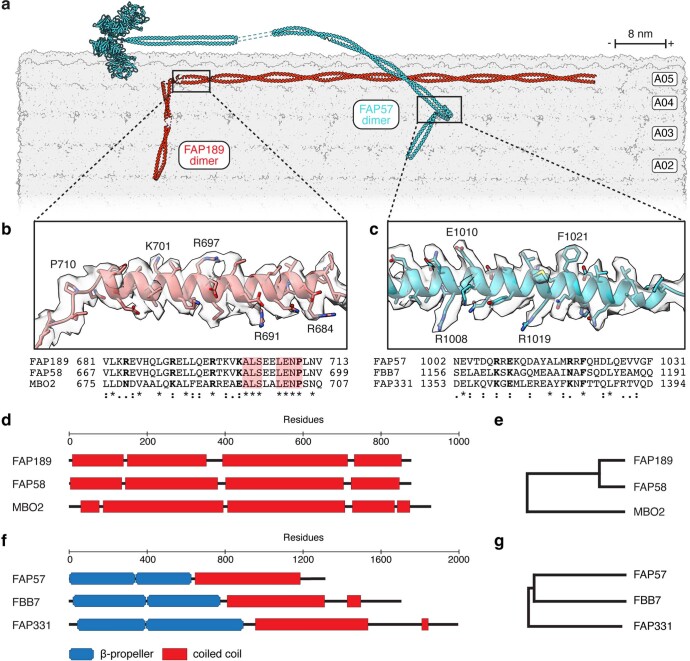
Extended Data Fig. 8
Coiled-coil docking factors potentially contribute to axonemal asymmetry.
a , Atomic models of the FAP189 and FAP57 homodimers. Other axonemal complexes are omitted for clarity. FAP189 forms an L-shaped coiled coil that occupies the interprotofilament cleft between protofil...
Figure images are served from the NIH/NLM PubMed Central Open Access Subset or Europe PMC; copyright remains with the publishers and authors.
💬 Discussion
0 commentsNo comments yet. Be the first to start a discussion!
Leave a Comment