Abstract
Abstract Cryo-FIB/SEM combined with cryo-ET has emerged from within the field of cryo-EM as the method for obtaining the highest resolution structural information of complex biological samples in-situ in native and non-native environments. However, challenges remain in conventional cryo-FIB/SEM workflows, including milling thick specimens with vitrification issues, specimens with preferred orientation, low-throughput when milling small and/or low concentration specimens, and specimens that distribute poorly across grid squares. Here we present a general approach called the ‘Waffle Method’ which leverages high-pressure freezing to address these challenges. We illustrate the mitigation of these challenges by applying the Waffle Method and cryo-ET to reveal the macrostructure of the polar tube in microsporidian spores in multiple complementary orientations, which was previously not possible due to preferred orientation. We demonstrate the broadness of the Waffle Method by applying it to three additional cellular samples and a single particle sample using a variety of cryo-FIB-milling hardware, with manual and automated approaches. We also present a unique and critical stress-relief gap designed specifically for waffled lamellae. We propose the Waffle Method as a way to achieve many advantages of cryo-liftout on the specimen grid while avoiding the long, challenging, and technically-demanding process required for cryo-liftout.
🔬 Techniques
🔭 Microscopes
🧬 Organisms
💻 Software
🧪 Sample Preparation
🔬 Cell Lines
🏭 Microscope Brands
🧪 Reagent Suppliers
📷 Detectors
💻 Software Details
💾 Data Repositories
🏛️ Research Organizations (ROR)
Affiliated research institutions:
📋 Methods
Waffle Method applied to small specimens with preferred orientation issues To illustrate several of the advantages of the Waffle Method, we applied the method to dormant microsporidian Encephalitozoon hellem ( E. hellem ) spores. E. hellem spores are about 1.5 µm in diameter and 2.5–3.5 µm in length. Inside each unactivated microsporidian spore is a long, coiled polar tube with a diameter of ~130 nm, and several other organelles. Due to their shape, microsporidia on conventionally-prepared plunge-frozen EM grids almost exclusively lie on the grid with their long (anterior-posterior) axis parallel to the plane of the grid (Fig. 3a ). The polar tube, the most prominent organelle inside the microsporidian spore, is predominantly wound at a tilt around the long axis of the spore on the inside edge of the spore wall 13 (Fig. 3e , schematic diagram). This polar tube orientation in the microsporidia and preferred orientation of the microsporidia on the grid, as shown in Fig. 3a, b, e , results in intractable preferred orientation of the polar tube in lamellae after conventional cryo-FIB/SEM milling. Specifically, milling individual microsporidian spores inevitably provides only axial views of the polar tube. Moreover, the throughput and accuracy of milling individual or small groups of microsporidia is low (Fig. 3a, b ), and the resulting lamellae are challenging for cryo-ET data collection due to the very small lamella and the location of the polar tube near the spore wall. Fig. 3 Example of how the Waffle Method solves low concentration, low-throughput, and preferred orientation problems of conventional cryo-FIB/SEM of microsporidian spores. a , b Small cells milled by conventional cryo-FIB/SEM where the samples were back-blotted and plunge frozen. The cells are individually-milled due to low concentration, leading to low-throughput. a SEM image of an individually-milled cell (~1.5 × 3 μm). b FIB image of several individually-milled cells. c – g Small cells prepared using the Waffle Method. c SEM image of a waffle with several trenches prepared. d SEM image of a completed waffle lamella (~30 × 20 μm) with a notch mill showing several orientations of the spores. e A low-mag TEM image of a waffled microsporidian spore lamella alongside a schematic diagram of a spore with the high-mag cryo-ET collection area approximated (green outlined cross-section). Below is a slice-through of the high-mag tomogram with arrows showing axial views of the polar tube in the spore (green arrows). The polar tube in the schematic diagram is colored dark blue, exhibiting a fixed orientation relative to the major axis of the spore. f A low-mag TEM image of a waffled microsporidian spore lamella alongside a schematic diagram of a spore with the high-mag cryo-ET collection area approximated (orange outlined cross-section). The spore cross-section is roughly orthogonal to the spore in e , as the diagrams show. Below is a slice-through of the high-mag tomogram with arrows showing side views of the polar tube in the spore (orange arrows). g The dashed black line insets in e and f magnified by 4x highlighting the ~2.5 nm features on the second cylindrical layer (blue arrows). Tomogram slice-through movies are shown in Supplementary Movie 3 . a , c – g show E. hellem microsporidian spores while ( b ) shows A. algerae microsporidian spores. n > 25 independent cells observed in various orientations in tomograms. We applied the Waffle Method to microsporidia (Fig. 3c–g ) in order to visualize the polar tube in dormant spores, to solve the preferred orientation issue, to reliably mill these small cells, to increase their concentration in lamellae, and to improve the throughput of cryo-FIB/SEM preparation and of cryo-ET collection while retaining nanometer-level features. The following specific workflow was used, which is depicted and shown in Fig. 1 and Supplementary Movies 1 & 2 . Full details of the Waffle Method workflow used here are presented in the Methods.
Show full methods section
Waffle Method applied to small specimens with preferred orientation issues To illustrate several of the advantages of the Waffle Method, we applied the method to dormant microsporidian Encephalitozoon hellem ( E. hellem ) spores. E. hellem spores are about 1.5 µm in diameter and 2.5–3.5 µm in length. Inside each unactivated microsporidian spore is a long, coiled polar tube with a diameter of ~130 nm, and several other organelles. Due to their shape, microsporidia on conventionally-prepared plunge-frozen EM grids almost exclusively lie on the grid with their long (anterior-posterior) axis parallel to the plane of the grid (Fig. 3a ). The polar tube, the most prominent organelle inside the microsporidian spore, is predominantly wound at a tilt around the long axis of the spore on the inside edge of the spore wall 13 (Fig. 3e , schematic diagram). This polar tube orientation in the microsporidia and preferred orientation of the microsporidia on the grid, as shown in Fig. 3a, b, e , results in intractable preferred orientation of the polar tube in lamellae after conventional cryo-FIB/SEM milling. Specifically, milling individual microsporidian spores inevitably provides only axial views of the polar tube. Moreover, the throughput and accuracy of milling individual or small groups of microsporidia is low (Fig. 3a, b ), and the resulting lamellae are challenging for cryo-ET data collection due to the very small lamella and the location of the polar tube near the spore wall. Fig. 3 Example of how the Waffle Method solves low concentration, low-throughput, and preferred orientation problems of conventional cryo-FIB/SEM of microsporidian spores. a , b Small cells milled by conventional cryo-FIB/SEM where the samples were back-blotted and plunge frozen. The cells are individually-milled due to low concentration, leading to low-throughput. a SEM image of an individually-milled cell (~1.5 × 3 μm). b FIB image of several individually-milled cells. c – g Small cells prepared using the Waffle Method. c SEM image of a waffle with several trenches prepared. d SEM image of a completed waffle lamella (~30 × 20 μm) with a notch mill showing several orientations of the spores. e A low-mag TEM image of a waffled microsporidian spore lamella alongside a schematic diagram of a spore with the high-mag cryo-ET collection area approximated (green outlined cross-section). Below is a slice-through of the high-mag tomogram with arrows showing axial views of the polar tube in the spore (green arrows). The polar tube in the schematic diagram is colored dark blue, exhibiting a fixed orientation relative to the major axis of the spore. f A low-mag TEM image of a waffled microsporidian spore lamella alongside a schematic diagram of a spore with the high-mag cryo-ET collection area approximated (orange outlined cross-section). The spore cross-section is roughly orthogonal to the spore in e , as the diagrams show. Below is a slice-through of the high-mag tomogram with arrows showing side views of the polar tube in the spore (orange arrows). g The dashed black line insets in e and f magnified by 4x highlighting the ~2.5 nm features on the second cylindrical layer (blue arrows). Tomogram slice-through movies are shown in Supplementary Movie 3 . a , c – g show E. hellem microsporidian spores while ( b ) shows A. algerae microsporidian spores. n > 25 independent cells observed in various orientations in tomograms. We applied the Waffle Method to microsporidia (Fig. 3c–g ) in order to visualize the polar tube in dormant spores, to solve the preferred orientation issue, to reliably mill these small cells, to increase their concentration in lamellae, and to improve the throughput of cryo-FIB/SEM preparation and of cryo-ET collection while retaining nanometer-level features. The following specific workflow was used, which is depicted and shown in Fig. 1 and Supplementary Movies 1 & 2 . Full details of the Waffle Method workflow used here are presented in the Methods.
Waffle Method applied to three additional cellular specimens
To illustrate the broad applicability of the Waffle Method, both in sample type and in workflow, we applied it to three additional cellular specimens: (1) yeast Saccharomyces cerevisiae ( S. cerevisiae ) cells, (2) E. coli BL21 (DE3) cells infected with Leviviridae PP7-PP7 virus capsid proteins, and (3) HEK 293 S GnTI − suspension cells. Each specimen was prepared, waffled, and FIB-milled as described in the Methods. Each of the four cellular samples presented in this work were propagated, cultured, expressed, or harvested, then centrifuged and resuspended in solution prior to waffle making. Waffle grids were prepared as shown in Fig. 1 and Supplementary Fig. 2 . The microsporidian spore cells in the previous section and the yeast cells were each milled manually on an FEI Helios NanoLab 650. The spore cells were prepared using a Quorum PP3000T prep chamber and cryo-stage while the yeast cells were prepared using a Leica EM VCT500 cryo-stage. The spore cells were first trench milled orthogonally in a flat holder while the yeast cells were trench milled at a 48° angle in a tilted holder, then excess bulk material below the slabs was milled away at shallower angles prior to lamellae thinning. The E. coli cells and HEK 293 S cells were each milled on a TFS Aquilos 2 using AutoTEM to automate the lamellae thinning process after manual trench milling. First, trench milling for both cells was performed in a tilted holder orthogonally to the grid by rotating the stage, then notches were milled close to the lamellae milling angle, followed by automated overnight lamellae milling. Supplementary Movie 4 shows a timelapse of AutoTEM coarse-to-fine milling. The manually-milled yeast lamella represents a successful attempt to create the largest waffle lamella and resulted in a lamella of size 70 µm × 25 μm in length and width, and 250–500 nm thick (Supplementary Fig. 6 ). Figure 4a shows a tomogram slice-through from the lamella and Supplementary Movie 5 shows two representative tomograms. Fig. 4 Additional examples using the Waffle Method. Tomogram slice-through of: a of yeast S. cerevisiae with several ribosomes (orange), potential mitochondria (yellow), and the nuclear envelope (light blue) highlighted; b E. coli BL21 (DE3) + Leviviridae PP7-PP7 virus capsid proteins with several virus capsids (red-orange), ribosomes (orange), and neighboring cell-cell membranes (green) highlighted; c HEK 293 S GnTI- with several transmembrane proteins (blue), ribosomes (orange), and actin networks (purple) highlighted; and d porcine thyroglobulin (ThG) single particle waffle lamellae with several orientational views highlighted (red). Scale bars are 200 nm. Each slice shown is about 8 Å thick. n > 25 a , 35 b , 5 c , and 10 d independent tomograms. The resulting AutoTEM-automated lamellae for the E. coli and HEK 293 S cells were each about 12 µm × 12 µm in length and width, and 200–250 nm thick. Supplementary Movie 6 shows two representative tomograms from the E. coli waffle lamellae. The E. coli cells expressed Leviviridae PP7 virus capsid proteins, which can be seen assembled as virus capsids inside of the bottom-right E. coli cell in Fig. 4b and in the left tomogram in Supplementary Movie 6 (highlighted in red-orange). Moreover, the Waffle Method may allow for neighboring cell-cell membranes (highlighted in green) to more easily be studied. Figure 4c and Supplementary Movie 7 shows a tomogram from the HEK 293 S waffle lamellae. The cell membranes show several dozen receptors of interest (several highlighted in blue). The Waffle Method applied to E. coli and HEK 293 S cells illustrate the advantage of milling dozens of cells per lamellae to increase the likelihood of locating low-density regions of interest in the resulting cryo-ET tomograms, compared to conventional cryo-FIB-milling. A low-magnification tomogram of the E. coli sample (Supplementary Movie 8 ) shows that sections of the lamella contain complete outer membranes of top-views and side-views of the cells, illustrating further how the Waffle Method may simplify the study of outer membrane-bound proteins.
Methods General Several variations of the Waffle Method for the different specimens and hardware in this manuscript are described here. We note that implementation of the Waffle Method with new specimens and hardware may require a new combination of these methods. Microsporidian spore sample preparation The A. algerae microsporidian spores shown in Fig. 3b were propagated in Helicoverpa zea larvae and purified using a continuous Ludox gradient, as previously described 28 . E. hellem microsporidian spores (ATCC 50504) were used in Fig. 3a,c–g . The spores were propagated in Vero cells (ATCC CCL-81). Vero cells were maintained in Eagle’s Minimum Essential Medium (EMEM) (ATCC 30–2003) with 10% heat-inactivated fetal bovine serum (FBS) at 37 °C with 5% CO 2 . At ~90% confluence, the media was replaced with EMEM supplemented with 3% FBS and the parasites were added into a 25 cm 2 tissue culture flask. Medium was changed every 2 days. After 14 days post-infection, the cells were detached from the flask using a cell scraper and centrifuged at 1300 × g for 10 min at room temperature. Cell pellets were resuspended with 5 mL of distilled water and mechanically disrupted using a G27 needle. To purify microsporidian spores, 5 mL of a 100% Percoll was added and vortexed prior to centrifugation at 1800 × g for 30 min at 25 °C. The purified spore pellets were washed 3 times with 1X PBS and stored at 4 °C until use. Spore concentration (1.54 × 10 8 spores/mL) was measured using a hemocytometer. Prior to waffle sample application, the spores were centrifuged, and resuspended in a small amount of buffer, resulting in a highly concentrated sample for application to the waffle grid assembly.
Microsporidian spore waffle grid preparation
The general, overall Waffle Method workflow is described in the Results section. Here and in the other waffle preparation sections for the other specimen, we describe the specific equipment and workflows used during waffle milling. This section on microsporidian spore waffle grid preparation covers the period of Kotaro’s Waffle Method development, and is accurate to the best of our knowledge. Waffle Method development resulted in the following protocol. We use Quantifoil carbon 200 mesh EM grids (Quantifoil, Jena, Germany). About 25 nm of carbon is sputtered onto the non-grid bar side of the grid using a Leica EM ACE600 High Vacuum Sputter Coater (Leica Biosystems, Germany). Solid brass planchette hats (3.3 mm diameter) are polished for several minutes using POL Metallpflege metal-polish and a Kimwipe. Excess is wiped off using a Kimwipe. The planchette hats and grid spacer are coated with 1-hexadecene. The grid is plasma cleaned using a Gatan Solarus (Gatan Inc, Pleasanton, CA) with the following recipe: 80% O 2 gas and 20% H 2 gas for 30 s. The HPF tip is cleaned with ethanol prior to assembling the bottom of the waffle in the HPF tip as shown in Supplementary Movie 2 . Several microliters of sample (typically 3–6 µL) are applied to the bottom waffle assembly on the grid bar side such that no air pockets are present, and optionally 2-methylpentane is applied to the top of the sample just prior to placing the top planchette hat on and closing the HPF tip. The assembled waffle grid in the HPF tip is quickly transferred to a Wohlwend HPF Compact 01 high-pressure freezer where it is high-pressure frozen. The HPF tip is then disassembled to release the waffled grid inside of the planchette hats. The planchette hats are disassembled using a combination of tweezers, flat screwdrivers, and razor blades to reveal the waffled grid. The waffle grid is then carefully clipped. The grid is placed in a flat or tilted cryo-FIB/SEM holder and inserted into the Quorum PP3000T prep chamber (Quorum Technologies, Great Britain) attached to the FEI Helios NanoLab 650 cryo-FIB/SEM (FEI, Hillsboro, OR) at NYSBC. Conductive platinum is sputtered onto the waffled grid inside of the prep chamber for 60 s before placing the shuttle onto the cold stage in the main chamber. Platinum GIS is deposited onto the waffle for 4–7 s at 35 °C at 7 mm from working distance. Grid bar lines are drawn into the waffle to help locate areas of interest and orient the cryo-FIB/SEM operator. Two trenches tens of microns in dimensions and about 30 µm apart for each area of interest are milled at between 45° and 90° from the grid plane with a milling current between 9.3 nA and 0.79 nA. If trench milling is performed far from 90°, the tilt angle is decreased several times by 5° while milling the bottom area under the slab to ensure that no material remains. The grid is placed into a tilted holder, if not already in one, and placed back into the cryo-FIB/SEM chamber. Eucentric height is obtained for each trenched slab location and positions are saved at shallow angles below 20° from the grid plane. All subsequent milling is performed in parallel* across all lamellae and with the FIB beam first intersecting the platinum GIS layer** to minimize curtaining. The slabs are coarse milled with a milling current between 2.5 nA and 0.43 nA until the slab is about 3 µm thick. A notch is milled into one side of the slab as described in the main text and as shown in Fig. 2 . Current is reduced to 0.23 nA and the slab is milled down to 1.5 µm thick with a tab left on the lamella beside the notch while tilting the stage ±1° and while milling more on the carbon side than the sample side. Current is reduced to 80 pA (using the cleaning cross section (CCS) pattern type) and the lamella is milled down to 0.5 µm thick while tilting the stage ±0.5°. With current still at 80 pA CCS and without tilting, the lamella is milled down to the desired final thickness (usually 200 nm or less) before polishing. The grid is removed from the prep chamber and conductive platinum is sputtered onto the grid and lamellae for several tens of seconds. *Milling in parallel means to first magnify to the location of slab 1 for trench milling, slab 2 for trench milling, slab 3 …, then slab 1 for coarse milling, slab 2 for coarse milling, slab 3 …, then lamella 1 for fine milling, lamella 2 for fine milling, lamella 3 …, and finally lamella 1 for polishing, lamella 2 for polishing, lamella 3 … **After trench milling, two surfaces are exposed for coarse and fine milling: (1) The frozen sample and (2) the platinum above the sample. All coarse and fine milling should first hit (2) the platinum above the sample. This will minimize curtaining.
Microsporidian spore Cryo-ET collection
Tilt-series were collected with Leginon 29 using a TFS Titan Krios (Thermo Fisher Scientific) using counting mode on a Gatan K2 BioQuantum with the energy filter slit width set to 20 eV (NYSBC Krios #3). Tilt-series were collected with a nominal defocus of −6 µm, pixelsize of 3.298 Å, 1.13–1.74 e-/Å 2 dose per tilt image where dose was increased with the cosine of the tilt angle resulting in 15–23 frames per tilt image and 68 e-/Å 2 total dose per tilt-series. Collection was performed bi-directionally from [0:50]° to [0:−50]° with 2° tilt increments. A total of 27 tilt-series were acquired.
Microsporidian spore Cryo-ET processing
Tilt images were frame aligned with MotionCor2 30 without patches or dose weighting. Frame aligned tilt images were used for fiducial-less tilt-series alignment in Appion-Protomo 31 – 33 . Only tilt images from [−50:20]° were used for the tomogram in Fig. 3e due to excessive stage drift. All tilt images were used for the right tomogram in Fig. 3f . Tilt-series were dose weighted in Appion-Protomo using equation 3 in Grant & Grigorieff 34 prior to reconstruction with Tomo3D 35 , 36 SIRT, then denoised using the Topaz-Denoise 37 pre-trained model. Tomograms were visualized with IMOD 38 . Microsporidian conventional cryo-FIB/SEM grid preparation In total 3 µL of Anncaliia algerae spores (6.8 × 10 7 spores/mL) was applied to a Quantifoil holey carbon grid on copper support (2/2, 400 mesh) glow discharged for 1 min, and back-blotted for 15 s. Then, the sample was frozen in liquid ethane using the Leica EM GP plunge freezer. The grid was screened on an FEI Talos Arctica cryo-TEM at the cryo-EM Shared Resource at NYU School of Medicine. The FEI Helios NanoLab 650 at NYSBC was used to perform conventional cryo-FIB/SEM. Briefly, the sample was platinum coated in the Quorum stage, a couple microns of platinum GIS was applied in the Helios main chamber, and spores were individually milled at shallow angles (
📊 Figures
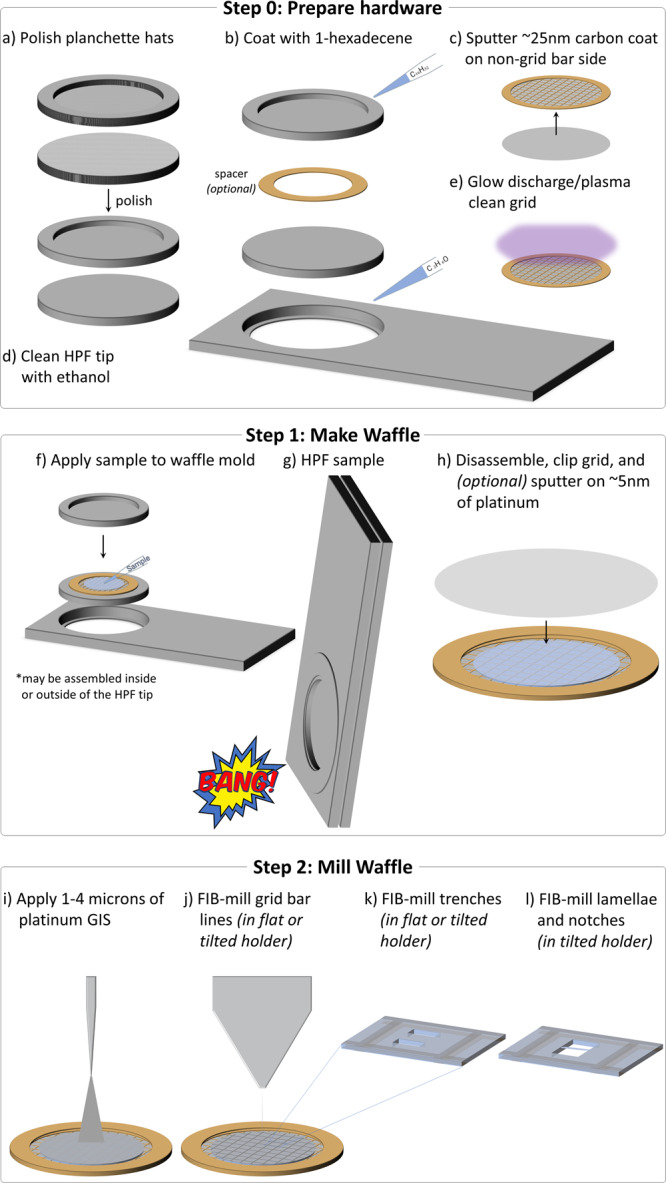
Fig. 1
Schematic of the general workflow for creating a waffle grid.
Supplementary Movie 1 shows an animation of all steps. In Step 0, the waffle is prepared: a The planchette hats are polished to reduce lamellae curtaining, b The planchette hats and optional spacer ar...
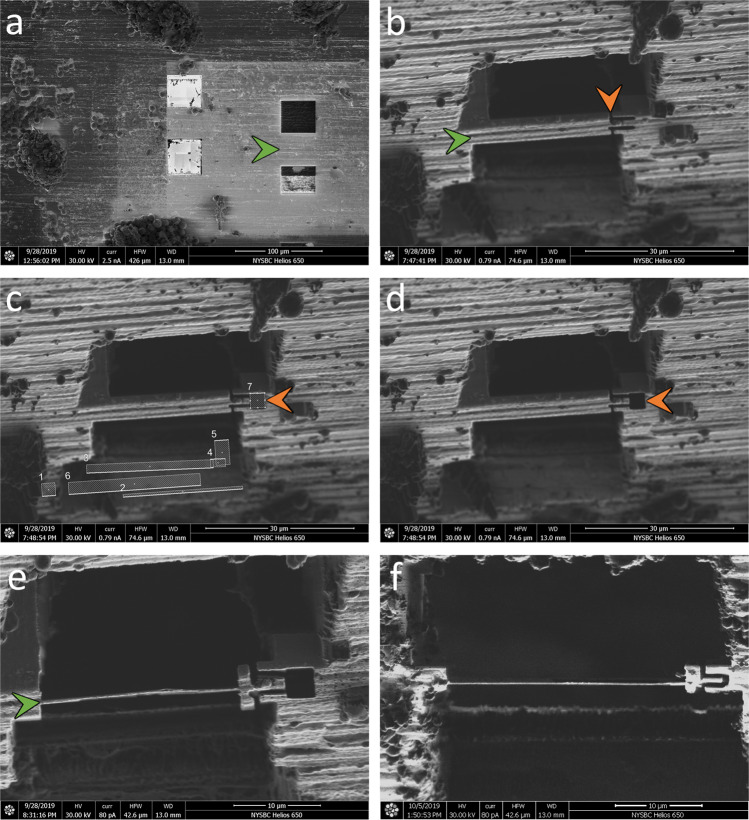
Fig. 2
FIB/SEM images of the notch milling workflow.
After trench-milling a (green arrow), the resulting slab is coarsely milled down to <10u2009u00b5m thick b (green arrow). An initial, incomplete notch design is milled into one side of the slab, wi...
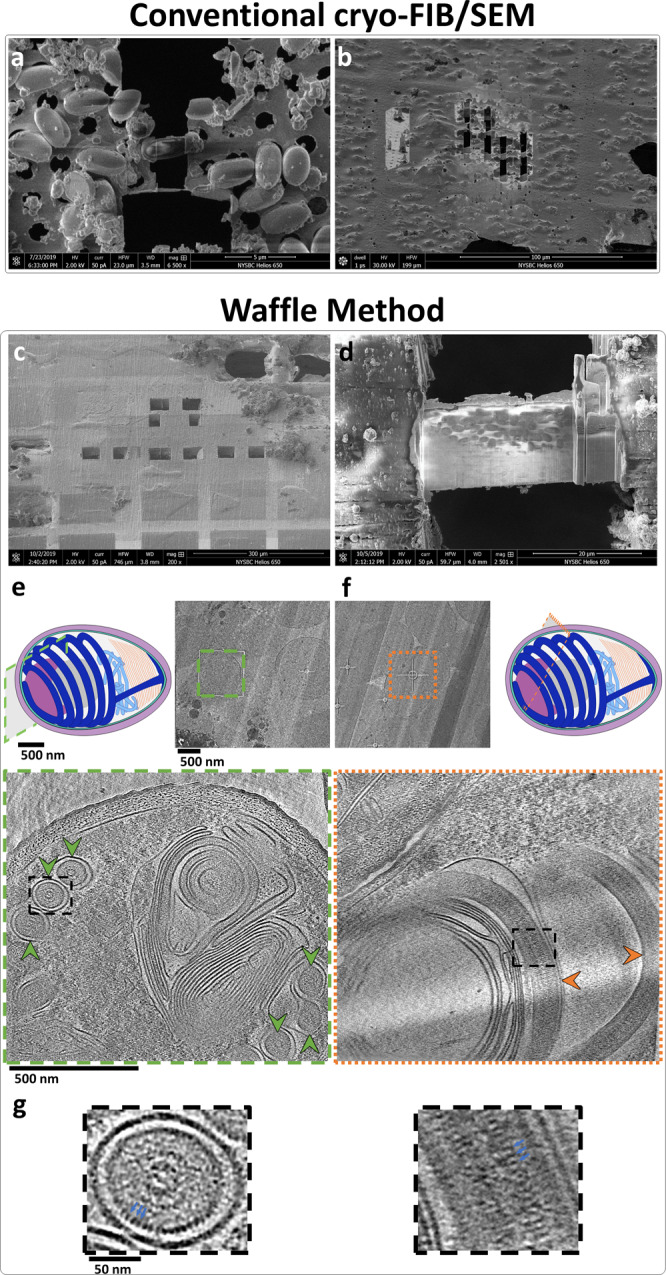
Fig. 3
Example of how the Waffle Method solves low concentration, low-throughput, and preferred orientation problems of conventional cryo-FIB/SEM of microsporidian spores.
a , b Small cells milled by conventional cryo-FIB/SEM where the samples were back-blotted and plunge frozen. The cells are individually-milled due to low concentration, leading to low-throughput. a SE...
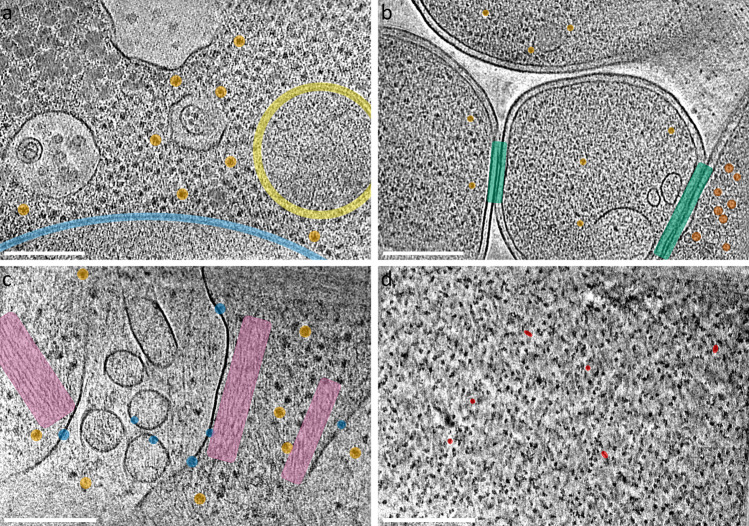
Fig. 4
Additional examples using the Waffle Method.
Tomogram slice-through of: a of yeast S. cerevisiae with several ribosomes (orange), potential mitochondria (yellow), and the nuclear envelope (light blue) highlighted; b E. coli BL21 (DE3)u2009+ Levi...
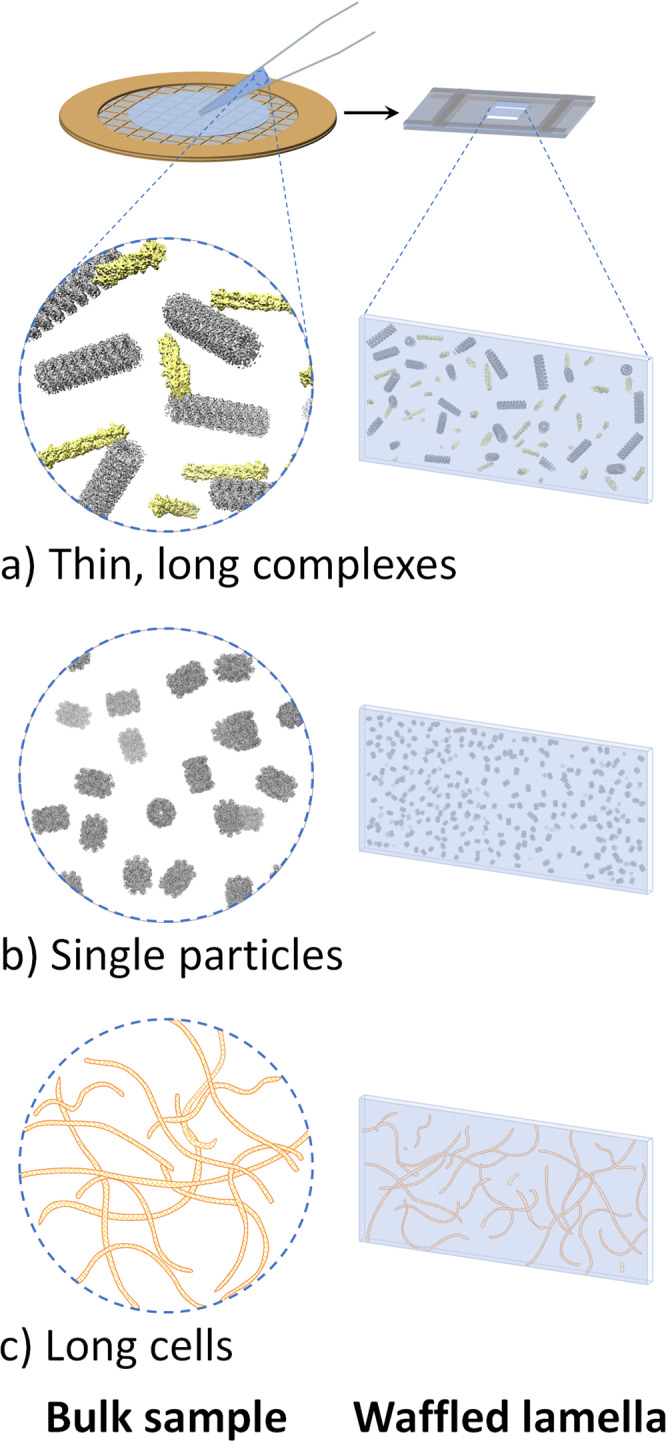
Fig. 5
Additional potential issues that the Waffle Method may rectify.
a Thin, long complexes, such as actin and microtubules depicted here, will exist in all orientations in waffled lamellae. b Single particle protein samples (depicted: internal T20S proteasome EM densi...
Figure images are served from the NIH/NLM PubMed Central Open Access Subset or Europe PMC; copyright remains with the publishers and authors.
💬 Discussion
0 commentsNo comments yet. Be the first to start a discussion!
Leave a Comment