Abstract
Abstract Layer 5 (L5) cortical projection neurons innervate far-ranging brain areas to coordinate integrative sensory processing and adaptive behaviors. Here, we characterize a plasticity in L5 auditory cortex (ACtx) neurons that innervate the inferior colliculus (IC), thalamus, lateral amygdala and striatum. We track daily changes in sound processing using chronic widefield calcium imaging of L5 axon terminals on the dorsal cap of the IC in awake, adult mice. Sound level growth functions at the level of the auditory nerve and corticocollicular axon terminals are both strongly depressed hours after noise-induced damage of cochlear afferent synapses. Corticocollicular response gain rebounded above baseline levels by the following day and remained elevated for several weeks despite a persistent reduction in auditory nerve input. Sustained potentiation of excitatory ACtx projection neurons that innervate multiple limbic and subcortical auditory centers may underlie hyperexcitability and aberrant functional coupling of distributed brain networks in tinnitus and hyperacusis.
🔬 Techniques
🔭 Microscopes
✨ Fluorophores
🧪 Sample Preparation
🏭 Microscope Brands
🧪 Reagent Suppliers
📷 Detectors
🔎 Objectives
💻 Software Details
💾 Data Repositories
🏛️ Research Organizations (ROR)
Affiliated research institutions:
📋 Methods
Animal subjects Adult
CBA/CaJ mice of either sex were used for all experiments in the study. All procedures were approved by the Massachusetts Eye and Ear Infirmary Animal Care and Use Committee and followed the guidelines established by the National Institute of Health for the care and use of laboratory animals. Virus injections Mice 6–8 weeks of either sex were anesthetized using isoflurane in oxygen (5% induction; 1.5–2% maintenance), with core body temperature maintained at 36.5°. Virus solution was backfilled into a pulled glass capillary pipette and injected into the target brain area at 15 nl/min using an automated injection system (Stoelting). For CCol axon imaging, we opened two small burr holes in the skull (0.5–1 mm diameter each) along the caudal-rostral extent of the squamosal suture that overlies the ACtx. After inserting the pipette 0.5 mm into the cortex, we then injected 250 nl of undiluted AAV5.Syn.GCaMP6s.WPRE.SV40 (UPENN Vector Core). The virus incubated for approximately 3–4 weeks before imaging began. For axon tracing experiments, we injected 500 nl of undiluted CAV2-Cre 0.5 mm deep at three equally spaced sites along the medial-lateral extent of the IC (Universitat Autònoma de Barcelona Vector Core) in two C57BL/6J mice (aged 6–8 weeks). The following day, we injected a cre-dependent GCaMP virus into the ACtx using the same injection protocol listed above (AAV1.Flex.GCaMP6s) and allowed the virus to incubate for 4–6 weeks before sectioning the brain. Following injections, a dab of antibiotic ointment was applied to each burr hole and the craniotomies were sealed with a ultraviolet (UV)-curing cement (Flow-It ALC Flowable Composite). The wound was closed and mice were injected with an analgesic (Buprenex, 0.05 mg/kg and Meloxicam, 0.1 mg/kg) before recovering in a warmed chamber.
Show full methods section
Animal subjects Adult
CBA/CaJ mice of either sex were used for all experiments in the study. All procedures were approved by the Massachusetts Eye and Ear Infirmary Animal Care and Use Committee and followed the guidelines established by the National Institute of Health for the care and use of laboratory animals. Virus injections Mice 6–8 weeks of either sex were anesthetized using isoflurane in oxygen (5% induction; 1.5–2% maintenance), with core body temperature maintained at 36.5°. Virus solution was backfilled into a pulled glass capillary pipette and injected into the target brain area at 15 nl/min using an automated injection system (Stoelting). For CCol axon imaging, we opened two small burr holes in the skull (0.5–1 mm diameter each) along the caudal-rostral extent of the squamosal suture that overlies the ACtx. After inserting the pipette 0.5 mm into the cortex, we then injected 250 nl of undiluted AAV5.Syn.GCaMP6s.WPRE.SV40 (UPENN Vector Core). The virus incubated for approximately 3–4 weeks before imaging began. For axon tracing experiments, we injected 500 nl of undiluted CAV2-Cre 0.5 mm deep at three equally spaced sites along the medial-lateral extent of the IC (Universitat Autònoma de Barcelona Vector Core) in two C57BL/6J mice (aged 6–8 weeks). The following day, we injected a cre-dependent GCaMP virus into the ACtx using the same injection protocol listed above (AAV1.Flex.GCaMP6s) and allowed the virus to incubate for 4–6 weeks before sectioning the brain. Following injections, a dab of antibiotic ointment was applied to each burr hole and the craniotomies were sealed with a ultraviolet (UV)-curing cement (Flow-It ALC Flowable Composite). The wound was closed and mice were injected with an analgesic (Buprenex, 0.05 mg/kg and Meloxicam, 0.1 mg/kg) before recovering in a warmed chamber.
Chronic imaging preparation
Cranial windows were made by etching glass cover slips in piranha solution (H 2 O 2 mixed with H 2 SO 4 in a 3:1 ratio) and stored in 70% ethanol. A 4 mm diameter cover slip was centered and affixed to a 3 mm cover slip (#1 thickness, Warner Instruments) using a transparent, UV-cured adhesive (Norland Products). Windows were stored in double deionized water and rinsed with sterile saline before use. For Cranial window implantation surgery, animals were anesthetized with isoflurane in oxygen (5% induction; 1.5–2% maintenance). Dexamethasone sodium phosphate was administered to reduce brain edema (2 mg/kg, intramuscular). After removing the periosteum from the dorsal surface of the skull, an etchant (C&B Metabond) was applied for 30 s to create a better adhesive surface. A custom titanium headplate (iMaterialise) was bonded to the dorsal surface of the skull with dental cement (C&B Metabond). In accordance with a published protocol on chronic cranial window surgical procedure 38 , we made a 3 mm circular craniotomy atop the IC with a pneumatic dental drill and diamond burr (head diameter 1/10 mm, NeoDiamond–Microcopy Dental). Once liberated, the bone flap was removed with great care and continuously irrigated with saline to avoid rupturing the pial vessels underneath. The cranial window was then lowered into place using a three-dimensional manipulator and bonded to the surrounding regions of the skull to create a hermetic seal. Post-operative injections of Buprenex (0.05 mg/kg) and Meloxicam (0.1 mg/kg) were administered and the mice were allowed to recover in a warmed chamber. Imaging began 5–7 days following recovery from surgery.
Widefield calcium imaging
Calcium imaging was performed in awake, head-fixed mice inside of a light- and sound-attenuating chamber mounted to an isolated optical table (Thorlabs). Blue light illumination was supplied in epifluorescence configuration from a broadband arc lamp (Lumen Dynamics) passed through a filter cube housing an excitation filter (482 ± 9 nm), dichroic mirror (reflection band: 350–488 nm; transmission band: 502–950 nm) and emission filter (520 ± 14 nm, Thorlabs) and focused on the surface of the IC with a 4×/ 0.13 NA objective (Nikon). Images (1392 × 1040 pixels) were acquired with a 1.4 Megapixel CCD camera and transferred to a PC via a Gigabit Ethernet interface to a framegrabber PCI card (Thorlabs). Image acquisition was hardware-triggered at 10 frames/s using a TTL pulse train synched to stimulus generation. Stimulus presentation Stimuli were generated with a 24-bit digital-to-analog converter (National Instruments model PXI 4461) and presented via a free-field tweeter (Vifa) positioned 10 cm from the left (contralateral) ear canal. Stimuli were calibrated before recording with a wideband ultrasonic acoustic sensor (Knowles Acoustics, model SPM0204UD5). Broadband noise bursts (50 ms duration, 4 ms raised cosine onset/offset ramps) were pseudorandomly presented between 20 and 80 dB SPL in 10 dB increments (50 repetitions per stimulus). Trial duration was 2 s.
Imaging data analysis
Images were first downsampled by a factor of 4 using bicubic interpolation. A region of interest (ROI) was positioned over an IC region with maximum CCol fluorescence that did not include surface blood vessels. Exact ROI dimensions varied between mice depending on blood vessel patterns and craniotomy location (100 × 100 ± 50 pixels) but was fixed in size and position across imaging sessions for a given animal. Population GCaMP responses were computed from the mean of all pixels within the ROI.
Mice with low
GCaMP expression in the cranial window during the initial baseline period were excluded from all analyses. After averaging across trials, we computed the pre-stimulus fluorescence level ( F 0 ) as the mean fluorescence across a 0.5 s period immediately prior to stimulus onset. We then expressed the fractional change in fluorescence (( F − F 0 )/ F 0 ) for each frame ( F ). For each sound level, response amplitude was defined as the peak of the fractional change response, expressed as a percent change from baseline. A linear model was used to regress the response amplitudes on each day to the mean response amplitude from the first two baseline imaging sessions. The regression was limited to the region of linear growth (40–80 dB SPL) to improve the goodness of fit ( R 2 ) across all conditions. The slope of this least-squares fit ( m ) was used to quantify the degree of divisive ( m < 1) or multiplicative ( m > 1) gain changes across imaging days. Acoustic over-exposure Mice were exposed to an octave band of noise (8–16 kHz) presented at 100 dB SPL for 2 h. During exposures, animals were awake and unrestrained within a 12 × 16 × 16 cm, acoustically transparent cage. The cage was suspended directly below the horn of the sound-delivery loudspeaker in a reverberant chamber. Noise calibration to target SPL was performed immediately before each exposure session.
Cochlear function tests
Mice were anesthetized with ketamine and xylazine (100/10 mg/kg for ketamine/xylazine, respectively, with boosters of 50 mg/kg ketamine given as needed). Core body temperature was maintained at 36.5° with a homeothermic blanket system. Acoustic stimuli were presented via in-ear acoustic assemblies consisting of two miniature dynamic earphones (CUI CDMG15008–03A) and an electret condenser microphone (Knowles FG-23339-PO7) coupled to a probe tube. Stimuli were calibrated in the ear canal in each mouse before recording. ABR stimuli were tone bursts (8, 11.3, 16, 22.6 and 32 kHz) or white noise bursts (0–50 kHz), 5 ms duration with a 0.5 ms rise-fall time delivered at 27 Hz, and alternated in polarity to the left ear. Intensity was incremented in 5 dB steps, from 20 to 80 dB SPL. ABRs were measured with subdermal needle electrodes positioned beneath both pinna (+ and −) and the base of the tail (ground). Responses were amplified (gain = 10,000), filtered (0.3–3 kHz) and averaged (1024 repeats per level). ABR threshold was defined as the lowest stimulus level at which a repeatable wave 1 could be identified. DPOAEs were measured in the ear canal using primary tones with a frequency ratio of 1.2, with the level of the f 2 primary set to be 10 dB less than f 1 level, incremented together in 5 dB steps. The 2 f 1 – f 2 DPOAE amplitude and surrounding noise floor were extracted. DPOAE threshold was defined as the lowest of at least two consecutive f 2 levels for which the DPOAE amplitude was at least 2 standard deviations greater than the noise floor. All treated animals underwent rounds of DPOAE and ABR testing with tones before, 2 days and approximately 14 days after noise exposure. ABR to white noise bursts were measured every other day beginning ether 2 days before noise exposure ( n = 3) or the day before noise exposure ( n = 3), for a total of 4–5 ABR test sessions for a given mouse.
Visualization of corticofugal axons
Deeply anesthetized mice were perfused transcardially with 0.01 M phosphate-buffered saline (PBS; pH = 7.4) followed by 4% paraformaldehyde in 0.01 M PBS. Brains were removed and stored in 4% paraformadehyde for 12 h before transferring to cryoprotectant (30% sucrose in 0.01 M PBS) for at least 48 h. Sections (40 μm thick) were cut using a cryostat (Leica), mounted on glass slides and coverslipped using Vectashield Mounting Medium with DAPI (Vector Labs). ACtx cell bodies and distribution of CCol axons were visualized and photographed using an epifluorescence microscope (Leica).
Cochlear histology and synapse quantification
Cochleae were dissected and perfused through the round window and oval window with 4% paraformaldehyde in PBS, then post-fixed in the same solution. Cochleae were dissected into half-turns for whole-mount processing.
Immunostaining began with a blocking buffer
(PBS with 5% normal goat or donkey serum and 0.2–1% Triton X-100) for 1 to 3 h at room temperature and followed by incubation with a combination of the following primary antibodies: (1) rabbit anti-CtBP2 (BD Biosciences, Catalog No. 612044) at 1:100, (2) rabbit anti-myosin VIIa (Proteus Biosciences, Catalog No. 25–6790) at 1:200, (3) mouse anti-GluR2 (Millipore, Catalog No. AB1768-I) at 1:2000. Lengths of cochlear whole mounts were measured and converted to cochlear frequency. Confocal z -stacks from each ear were obtained in the inner hair cell area using a high-resolution glycerin-immersion objective (63×) and ×3.18 digital zoom with a 0.25 μm z -spacing on a Leica SP5 confocal microscope. For each stack, the z -planes imaged included all synaptic elements in the x – y field of view. Image stacks were imported to image-processing software (Amira, Visage Imaging), where synaptic ribbons, glutamate receptor patches, and inner hair cells were counted.
Statistical analyses
Statistical analyses were performed in Matlab (Mathworks). Descriptive statistics are provided as mean ± SEM. Inferential statistics between control and noise-exposed samples were performed with two-tailed tests of unmatched samples (between-subject ANOVA or unpaired t -tests). Statistical contrasts over the noise exposure period were performed with a repeated measures ANOVA. All post-hoc pairwise comparisons were corrected with Bonferroni–Holm to account for type-I error inflation due to multiple comparisons.
Data availability
All data and software scripts that support the findings of this study can be made available from the corresponding author upon reasonable request.
Electronic supplementary material Peer Review File
📊 Figures
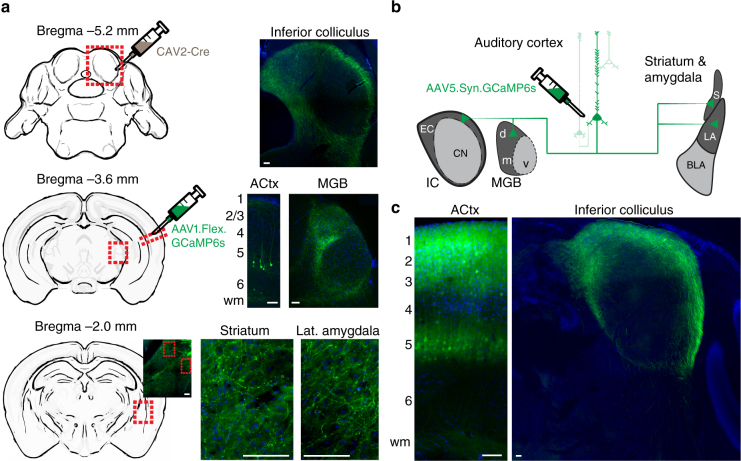
Fig. 1
Auditory corticofugal neurons that innervate the inferior colliculus have other widespread targets throughout the forebrain. a A canine adenovirus vector with efficient retrograde transport (CAV2) was...
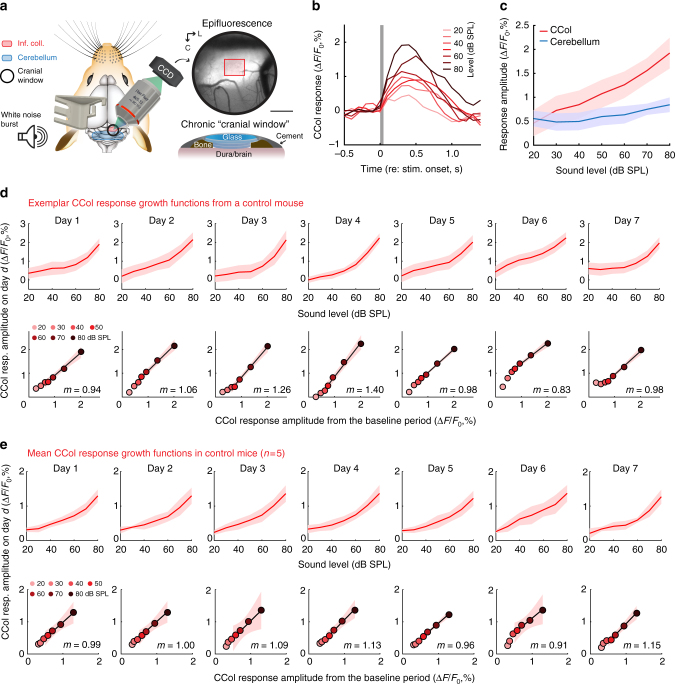
Fig. 2
Sound-evoked corticocollicular axon response increases monotonically with sound level and remains stable over 1 week of imaging. a A chronic preparation for epifluorescence imaging of GCaMP6s in CCol ...
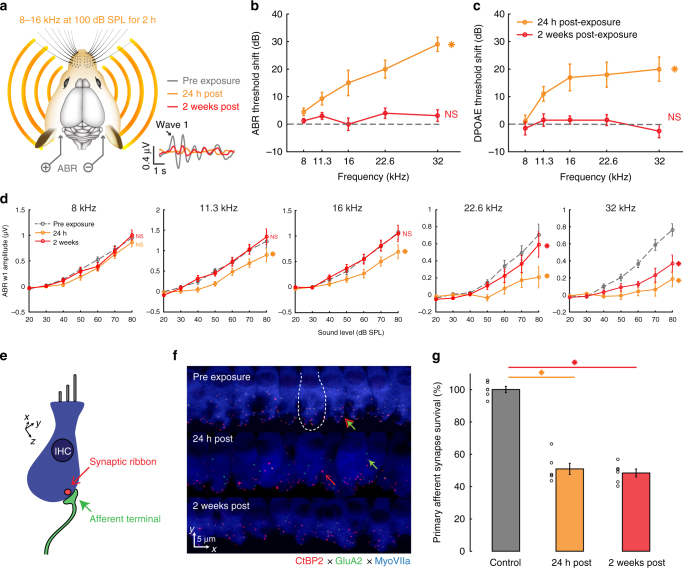
Fig. 3
Moderate intensity noise exposure induces a temporary shift in cochlear and brainstem response thresholds but a permanent loss of auditory nerve afferent fibers. a Schematic of noise exposure and audi...
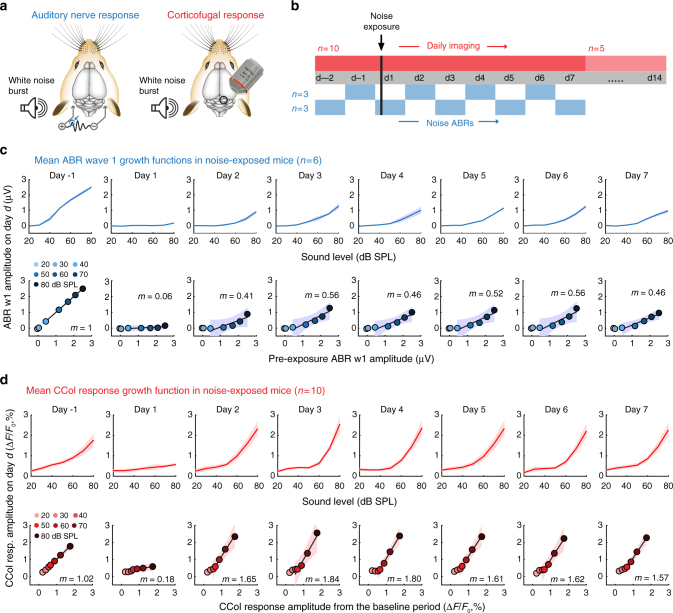
Fig. 4
Opposing changes in auditory nerve and corticocollicular response growth functions following cochlear synaptopathy. a Auditory nerve growth functions were measured under anesthesia every other day acc...
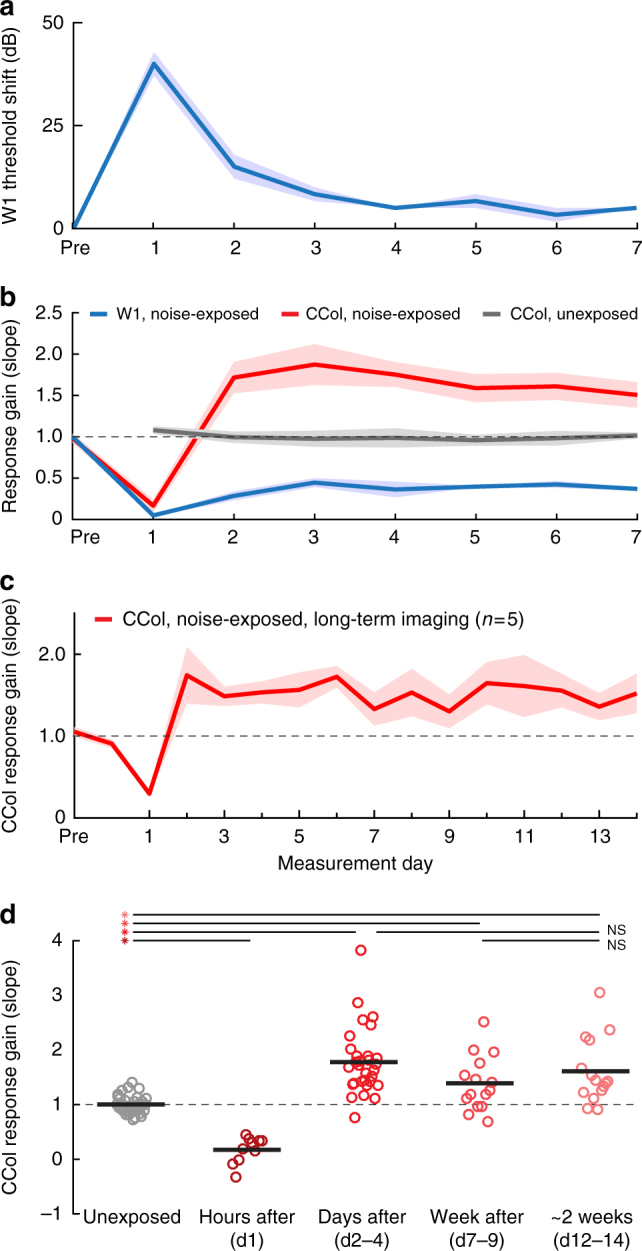
Fig. 5
ABR threshold recovery belies ongoing dynamics in auditory nerve and corticocollicular response gain. a Moderate noise exposure induces a temporary shift in the ABR wave 1 threshold to white noise bur...
Figure images are served from the NIH/NLM PubMed Central Open Access Subset or Europe PMC; copyright remains with the publishers and authors.
💬 Discussion
0 commentsNo comments yet. Be the first to start a discussion!
Leave a Comment