Abstract
The conjugation of anti-cancer drugs to endogenous ligands has proven to be an effective strategy to enhance their pharmacological selectivity and delivery towards neoplasic tissues. Since cell proliferation has a strong requirement for iron, cancer cells express high levels of transferrin receptors (TfnR), making its ligand, transferrin (Tfn), of great interest as a delivery agent for therapeutics. However, a critical gap exists in the ability to non-invasively determine whether drugs conjugated to Tfn are internalized into target cells in vivo. Due to the enhanced permeability and retention (EPR) effect, it remains unknown whether these Tfn-conjugated drugs are specifically internalized into cancer cells or are localized non-specifically as a result of a generalized accumulation of macromolecules near tumors. By exploiting the dimeric nature of the TfnR that binds two molecules of Tfn in close proximity, we utilized a Förster Resonance Energy Transfer (FRET) based technique that can discriminate bound and internalized Tfn from free, soluble Tfn. In order to non-invasively visualize intracellular amounts of Tfn in tumors through live animal tissues, we developed a novel near infrared (NIR) fluorescence lifetime FRET imaging technique that uses an active wide-field time gated illumination platform. In summary, we report that the NIR fluorescence lifetime FRET technique is capable of non-invasively detecting bound and internalized forms of Tfn in cancer cells and tumors within a live small animal model, and that our results are quantitatively consistent when compared to well-established intensity-based FRET microscopy methods used in in vitro experiments.
🔬 Techniques
🔭 Microscopes
✨ Fluorophores
🧪 Sample Preparation
🔬 Cell Lines
🏭 Microscope Brands
🧪 Reagent Suppliers
🔴 Lasers
📷 Detectors
🔎 Objectives
🎨 Filters
💻 Software Details
🏛️ Research Organizations (ROR)
Affiliated research institutions:
📋 Methods
Ethics Statement
All animal protocols were conducted with approval by the Institutional Animal Care and Use Committee at both Albany Medical College and Rensselaer Polytechnic Institute. Minimal discomfort to mice used in this study was ensured using guidelines in accordance with IACUC standards.
Cell Culture Conditions T47D
(HTB-122) and BT549 (HTB133) cells were purchased from ATCC and cultured in RPMI-1640 media (30–2001, ATCC) as recommended by ATCC. The media formulation was supplemented with 50 units/mL penicillin and 50 µg/mL streptocycin from MP Biomedicals (091670249), and with 10% fetal bovine serum (30–2020 ATCC). Human mammary epithelial cells (HMECs, CC-2551) were purchased from Lonza, using MEGM Complete media (CC-3051) as recommended. All cells were grown in 5% CO 2 at 37°C in a humidified incubation chamber, and were kept for less than 12 population doublings.
Tfn Uptake and Confocal Imaging
HMECs and T47D cells were passaged onto MatTek glass bottom culture dishes (P35GC-1.5-14-C) and allowed to grow to ∼75% confluency. For Tfn uptake experiments, cells were washed in phosphate buffered saline solution (PBS) and incubated in Tfn-free imaging media consisting of phenol-free Dulbecco’s Modified Eagle Medium (DMEM) (LifeTechnologies, 31053) and supplemented with 0.37 mg/mL sodium bicarbonate (Sigma, S7277), 5 mg/mL bovine serum albumin (Sigma, A9085), and 4.7 mg/mL HEPES (Sigma, H4034), at 37°C for 1 hour to clear internalized endogenous Tfn. After this pre-incubation period, cells were incubated at 37°C with human Tfn conjugated with AF488 dye purchased from LifeTechnologies, ( T13342 ; ∼2 fluorophore molecules per Tfn molecule) at 100 µg/mL for 0, 1, 2, 5, 10, 20, and 40 minutes. Uptake times were terminated by washing cell chambers with ice-cold PBS followed by cell fixation using 4% formaldehyde for 15 minutes and mounted onto coverslips with DAPI mounting media (LifeTechnologies, P36931 ). Cells were imaged with a Zeiss Laser Scanning Microscope 510, using a Plan-Apochromat 63x/1.4 oil DIC objective at 488 nm excitation wavelength, followed by detection using a 435–485 nm IR bandpass filter (pinhole = 1000 µm). DAPI imaging was achieved using two-photon excitation at 740 nm, followed by detection using a 500–550 nm IR bandpass filter (pinhole = 98 µm). For FRET analysis using confocal microscopy, cells were incubated for 1 hour at 37°C with media containing donor only (AF488-Tfn), acceptor only (AF555-Tfn) or both at a molar ratio of 2 acceptors to 1 donor molecules. No DAPI was used in FRET experiments. AF700 (LifeTechnologies; A20010) and AF750 (LifeTechnologies, A20011) NIR dye pairs were conjugated onto human Tfn (T3309, Sigma). Firstly, Tfn was saturated with iron after incubation with a molar excess of ferrous ammonium sulfate and nitrilotriacetate sodium salt solution in water. Then, after saturation, Tfn is conjugated to AF700 or AF750 dyes by incubating 5 µl of 10 µg/µl of dye in DMSO per 1 mg of Tfn at a concentration of 7 mg/ml solution. After 1 hour of gentle rotation in the dark, labeling was stopped by passage over a resin desalting column. Tfn-dye complexes were then concentrated using concentrators that exclude the flow-through of particles larger than 35 kD. Samples showed an average degree of labeling of ∼2 fluorophore molecules/Tfn molecule.
Show full methods section
Ethics Statement
All animal protocols were conducted with approval by the Institutional Animal Care and Use Committee at both Albany Medical College and Rensselaer Polytechnic Institute. Minimal discomfort to mice used in this study was ensured using guidelines in accordance with IACUC standards.
Cell Culture Conditions T47D
(HTB-122) and BT549 (HTB133) cells were purchased from ATCC and cultured in RPMI-1640 media (30–2001, ATCC) as recommended by ATCC. The media formulation was supplemented with 50 units/mL penicillin and 50 µg/mL streptocycin from MP Biomedicals (091670249), and with 10% fetal bovine serum (30–2020 ATCC). Human mammary epithelial cells (HMECs, CC-2551) were purchased from Lonza, using MEGM Complete media (CC-3051) as recommended. All cells were grown in 5% CO 2 at 37°C in a humidified incubation chamber, and were kept for less than 12 population doublings.
Tfn Uptake and Confocal Imaging
HMECs and T47D cells were passaged onto MatTek glass bottom culture dishes (P35GC-1.5-14-C) and allowed to grow to ∼75% confluency. For Tfn uptake experiments, cells were washed in phosphate buffered saline solution (PBS) and incubated in Tfn-free imaging media consisting of phenol-free Dulbecco’s Modified Eagle Medium (DMEM) (LifeTechnologies, 31053) and supplemented with 0.37 mg/mL sodium bicarbonate (Sigma, S7277), 5 mg/mL bovine serum albumin (Sigma, A9085), and 4.7 mg/mL HEPES (Sigma, H4034), at 37°C for 1 hour to clear internalized endogenous Tfn. After this pre-incubation period, cells were incubated at 37°C with human Tfn conjugated with AF488 dye purchased from LifeTechnologies, ( T13342 ; ∼2 fluorophore molecules per Tfn molecule) at 100 µg/mL for 0, 1, 2, 5, 10, 20, and 40 minutes. Uptake times were terminated by washing cell chambers with ice-cold PBS followed by cell fixation using 4% formaldehyde for 15 minutes and mounted onto coverslips with DAPI mounting media (LifeTechnologies, P36931 ). Cells were imaged with a Zeiss Laser Scanning Microscope 510, using a Plan-Apochromat 63x/1.4 oil DIC objective at 488 nm excitation wavelength, followed by detection using a 435–485 nm IR bandpass filter (pinhole = 1000 µm). DAPI imaging was achieved using two-photon excitation at 740 nm, followed by detection using a 500–550 nm IR bandpass filter (pinhole = 98 µm). For FRET analysis using confocal microscopy, cells were incubated for 1 hour at 37°C with media containing donor only (AF488-Tfn), acceptor only (AF555-Tfn) or both at a molar ratio of 2 acceptors to 1 donor molecules. No DAPI was used in FRET experiments. AF700 (LifeTechnologies; A20010) and AF750 (LifeTechnologies, A20011) NIR dye pairs were conjugated onto human Tfn (T3309, Sigma). Firstly, Tfn was saturated with iron after incubation with a molar excess of ferrous ammonium sulfate and nitrilotriacetate sodium salt solution in water. Then, after saturation, Tfn is conjugated to AF700 or AF750 dyes by incubating 5 µl of 10 µg/µl of dye in DMSO per 1 mg of Tfn at a concentration of 7 mg/ml solution. After 1 hour of gentle rotation in the dark, labeling was stopped by passage over a resin desalting column. Tfn-dye complexes were then concentrated using concentrators that exclude the flow-through of particles larger than 35 kD. Samples showed an average degree of labeling of ∼2 fluorophore molecules/Tfn molecule.
Intensity based FRET Microscopy
Images were acquired on a Zeiss LSM510 META-NLO laser scanning microscope using AIM software (Zeiss USA, Thornwood, NY) configured to donor excitation/donor emission (donor channel), acceptor excitation/acceptor emission (acceptor channel) and donor excitation/acceptor emission (FRET channel). Images were collected at 512×512 pixels, 8-bit depth, and mean of 2 images and at 1x. PMT gain and black-level settings, laser power, and pinhole were set at identical levels for all image collections. Single-labeled images were used to correct Spectral Bleed-Through (SBT) signal contamination.
Precision FRET
(PFRET) quantitative analysis algorithm [36] was used to calculate the FRET energy transfer efficiency (E%). After image background-subtraction and processing by the PFRET software, corrected FRET images (PFRET images) are generated for quantitative analyses, as described previously [35] . Energy transfer efficiency, E%, is calculated as the percentage of energy transfer in relation to the unquenched donor, i.e., unquenched donor (D) = quenched donor (qD)+γ⋅PFRET as described in the equation E% = 100×(γ⋅PFRET/D) or E% = 100×[1–(qD/D)]. γ value is a function of the quantum yield of the fluorophores and of the detection setup, where it is assumed to equal 1 as all imaging conditions remained constant [23] , [24] . Mathematical models previously described were used to discriminate a clustered from a random membrane protein organization based on the relationship between E% and A levels at specific ranges of acceptor to donor (A:D) ratios [23] , [24] , [37] – [41] . In a random situation, acceptor co-localization with a donor is positively correlated with acceptor levels and leads to an increase in E%. Conversely, in a clustered situation, E% is largely independent of acceptor levels, and it does not decrease to zero when acceptor trends to zero [38] , [39] , [42] .
Fluorescence Lifetime Imaging
FRET imaging was performed on a time-domain fluorescence lifetime imaging system using a gated intensified CCD (ICCD) with wide-field illumination described in detail [32] . Instead of a picoprojector, a digital micromirror device (DMD, DLP Discovery 4100 Kit and D2D module, Texas instruments Inc.) is used as a spatial light modulator to create a spatial distribution of light beams by providing a resolution of 1024×768 pixels and 256 grayscale levels. Briefly, a tunable Ti-Sapphire laser (Mai Tai HP, Spectra-Physics, CA, USA) is used as an illumination source to generate 100 fs pulses at 80 MHz in the NIR spectral band (690 nm–1020 nm). The overall laser power is adjustable using a computer-controlled variable attenuator (Application Note 30, Newport) based on the combination of a half-wave plate and a polarizer with a closed loop feedback-control system. The laser beam exiting the power control assembly is coupled into a 400 µm multimode fiber (NA = 0.22), and then it is collimated and focused into the integrator rod of the optical module (S2+optics, Texas instruments Inc.) for projecting the uniform illumination to the imaging stage over 3.2 cm×2.5 cm (up to 8 cm×4 cm). The transmitted light through an emission bandpass filter (FF01-720/13-25 for AF 700, Semrock ) is via a a Nikon 50 mm f/1.8D AF Nikon Lens and detected by the ICCD (PicoStar HR, LaVision GmbH, Germany) allowing the measurement of a maximum of 2 12 photons with spatial resolution of 1376×1040 pixels). Imaging in all animals and well-plates was performed in transmission geometry. The instrument response function (IRF) was measured by directly imaging on a white diffusing paper placed on the stage. For all experiments described herein, the excitation wavelength was set at 695 nm and the emission wavelength was set at 720 nm. Furthermore, the gatewidth on the ICCD camera was set to 300 ps. The IRF and the excitation signals were collected over a 2 ns time window at 40 ps resolution (50 gates) with the integration time of the camera set to 50 ms and the MCP voltage of 570 V. The measurements at the excitation wavelength for the complete set were acquired in 2.5 s. The fluorescence signals were recorded over a 4.6 ns time window at 40 ps resolution (115 gates) with the integration time of 800 ms and MCP voltage of 570 V. The emission measurements were acquired in 92 s.
Fluorescence Lifetime Fitting Model
In this work, the lifetime distribution of the FRET-complex components was analyzed using a bi-exponential decay model wherein we estimated 4 unknown parameters – lifetimes and relative abundances of the FRETing and non-FRETing component of the donor molecules in the sample. For the temporal fluorescence decay function Γ em(t), recorded in the absence of a diffusing medium on a system with instrument function response IRF(t), the biexponential decay model is given by: Here FD and NFD are corresponding to FRET donor fraction and non-FRET donor fraction, τ FRET and τ nonFRET are the lifetime values for the two species. Also, N is an arbitrary additive factor introduced to account for the noise in the fluorescence decay curve. The measured fluorescence decay (from 95% to 1% of peak intensity leading typically to ∼85 gates) is fit to this model and the above four parameters are estimated using a nonlinear constrained minimization method based on sequential quadratic programming, fmincon (MATLAB, MathWorks, USA). The fitting process, for different A:D ratios, was carried out in two steps. First, the fluorescence decay of donor only (A:D = 0∶1) was fit with unbound lifetime estimates. The mean value of long lifetime (unquenched donor) was then selected as a fixed parameter for the second step and τ FRET, FD and NFD were estimated. The lifetime of the NFD and FD were estimated to be 1.1±0.1 ns and 0.30±0.05 ns respectively. It should be noted that R-square for each fitting curve is around 0.99. Animal Experiments Athymic nude female mice (6–12 week old) (BALBNU) from Taconic were used for live imaging experiments. Cells were plated onto 100 mm cell culture dishes and grown to between 1.7−1.0×10 6 cells per dish. After the Tfn washout, cells were treated with AF700-Tfn and/or AF750-Tfn at molar ratios of 0∶1, 1∶2, 1∶1, or 2∶1 for 1 hour. Following uptake of NIR dye-conjugated Tfn, cells were washed in PBS and fixed with 4% formaldehyde for 15 minutes and suspended into 300 µL of matrigel substrate (BD, 356237). Cells are injected into the mammary fat pads of mice using a sterile 1 mL syringe and 27½ gauge needle (BD, 309623). Mice imaging was performed 3 hours post injection under vapor anesthesia (EZ-SA800 System, E-Z Anesthesia) using isofluorane and monitored using a physiological monitoring system (MouseOx Plus, STARR Life Sciences Corp.). Body temperature was maintained by an air warmer (Bair Hugger 50500, 3M Corporation) are integrated. All animal protocols were conducted with approval by the Institutional Animal Care and Use Committee at both Albany Medical College and Rensselaer Polytechnic Institute. For tumor studies, mice were injected with 1×10 6 live T47D cells re-suspended in 150 µL of growth media and 150 µL of matrigel substrate and allowed to grow for approximately 4–6 weeks. Following visible tumor growth, AF700-Tfn and/or AF750-Tfn at molar ratios of 0∶1 and 2∶1 were tail injected into mice with donor levels held constant at 40 µg/ml. After 1 hour post-injection, mice were anesthetized and imaged for the detection of FLIM FRET in live tumors.
Supporting Information File S1 (PDF) Click here for additional data file.
📊 Figures
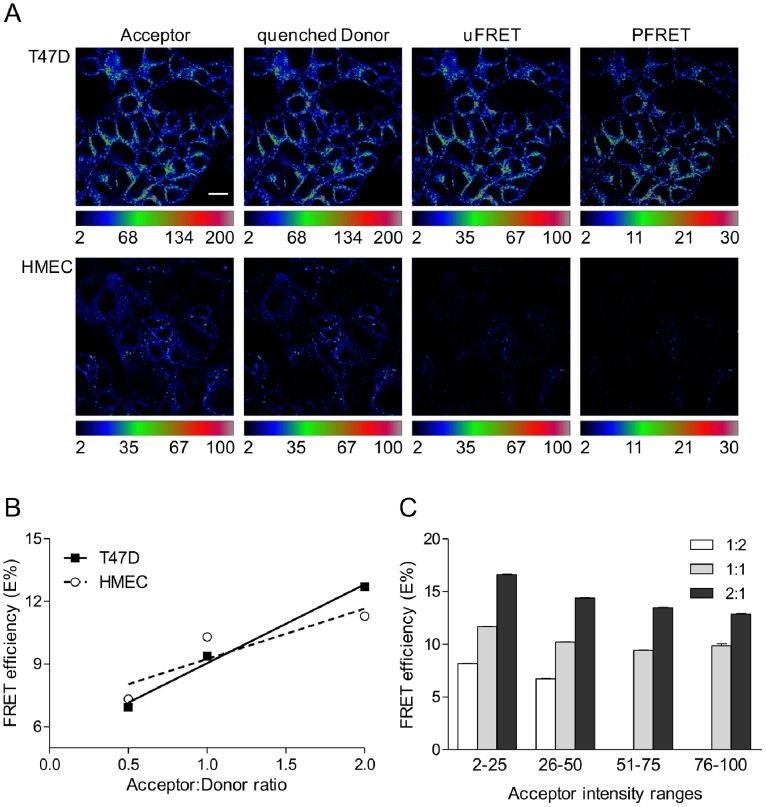
Figure 1
Characterization of Tfn-Tfn-R complexes in normal vs. cancer cells using intensity-based confocal microscopy FRET.
Tfn-TfnR FRET assay shows similar behavior in T47D breast cancer cells and HMECs. (A) T47D breast cancer cells have significantly more uptake of AF488-Tfn and AF555-Tfn compared to HMECs, as shown in ...
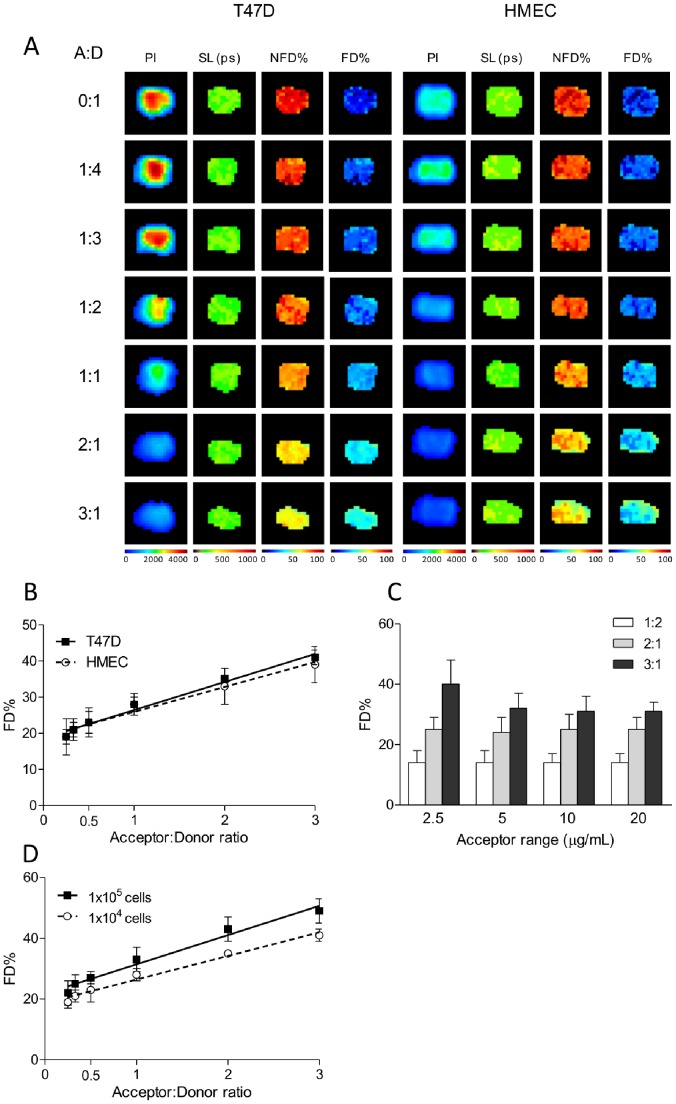
Figure 2
NIR fluorescence lifetime FRET of TfnR-Tfn complexes in normal vs. cancer cells using time-domain, wide-field macroscopic imaging in vitro.
Fluorescence lifetime analysis of TfnR-Tfn complexes using NIR FRET pair AF700u2013AF750 and a time-domain, wide-field macroscopic imaging system. (A) T47D (left panels) and HMECs (right panels) were ...
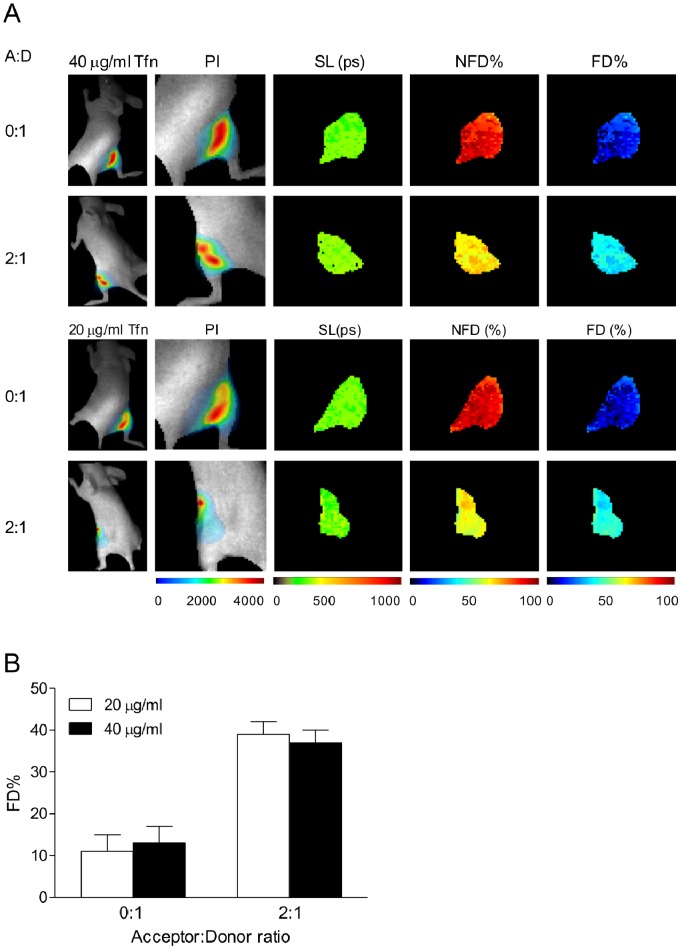
Figure 3
NIR fluorescence lifetime FRET of TfnR-Tfn complexes in normal vs. cancer cells using wide-field macroscopic imaging in vivo.
Fluorescence lifetime FRET is detected between AF700-Tfn (donor) and AF750-Tfn (acceptor) in T47D cells within a live mouse. (A) Mice injected with u223c1.5u00d710 6 T47D cells internalized with vario...
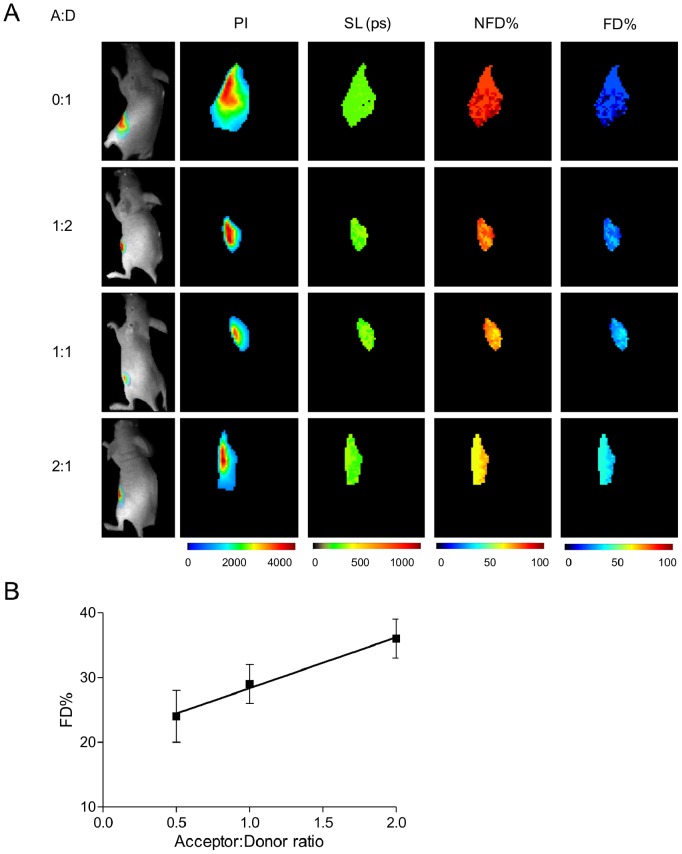
Figure 4
Accuracy of fluorescence lifetime FRET using NIR fluorophores in vivo.
Decreased fluorescence lifetime due to FRET is detectable through living mice. (A) Mice are injected with matrigel resuspended u223c1u00d710 6 cells pre-internalized with Tfn conjugated with NIR dyes ...
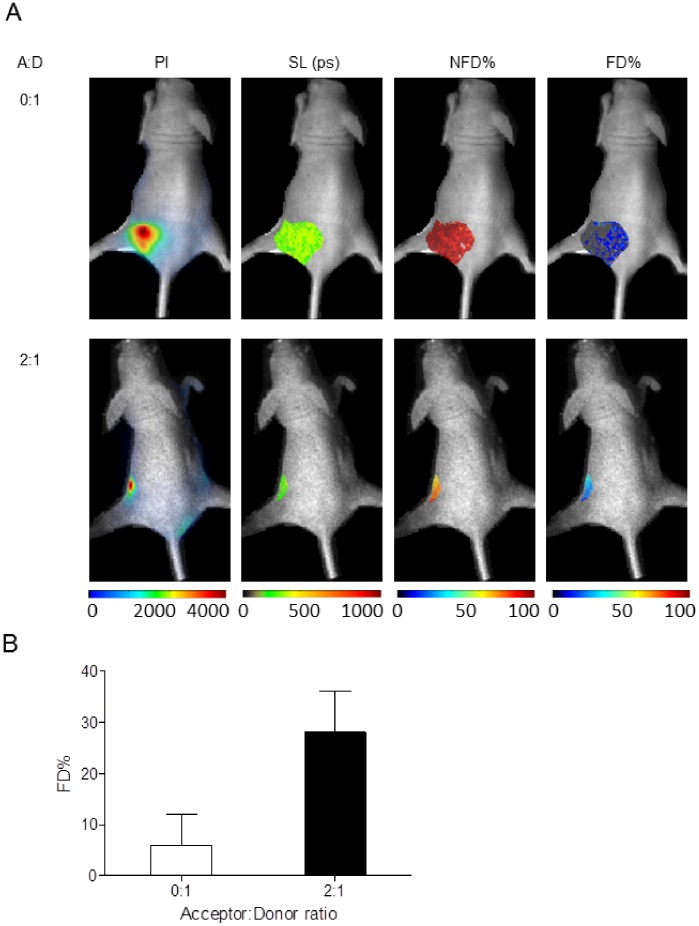
Figure 5
NIR fluorescence lifetime FRET of TfnR-Tfn complexes in tumor xenografts using wide-field macroscopic imaging in vivo.
Detection of decreased fluorescence lifetime due to FRET is achieved within mouse tumor model. (A) Mice implanted with live T47D cells developed tumors after 4u20136 weeks of growth. For FRET detectio...
Figure images are served from the NIH/NLM PubMed Central Open Access Subset or Europe PMC; copyright remains with the publishers and authors.
💬 Discussion
0 commentsNo comments yet. Be the first to start a discussion!
Leave a Comment