Abstract
AbstractCancer stem cells (CSCs) play an important role during metastasis, but the dynamic behavior and induction mechanisms of CSCs are not well understood. Here, we employ high-resolution intravital microscopy using a CSC biosensor to directly observe CSCs in live mice with mammary tumors. CSCs display the slow-migratory, invadopod-rich phenotype that is the hallmark of disseminating tumor cells. CSCs are enriched near macrophages, particularly near macrophage-containing intravasation sites called Tumor Microenvironment of Metastasis (TMEM) doorways. Substantial enrichment of CSCs occurs on association with TMEM doorways, contributing to the finding that CSCs represent >60% of circulating tumor cells. Mechanistically, stemness is induced in non-stem cancer cells upon their direct contact with macrophages via Notch-Jagged signaling. In breast cancers from patients, the density of TMEM doorways correlates with the proportion of cancer cells expressing stem cell markers, indicating that in human breast cancer TMEM doorways are not only cancer cell intravasation portals but also CSC programming sites.
🔬 Techniques
🔭 Microscopes
✨ Fluorophores
🧪 Sample Preparation
🔬 Cell Lines
🏭 Microscope Brands
🧪 Reagent Suppliers
📷 Detectors
💻 Software Details
💾 Data Repositories
🏛️ Research Organizations (ROR)
Affiliated research institutions:
📋 Methods
Cell culture The MDA-MB-231 human breast cancer cell line was obtained from ATCC and the identity of the line was re-confirmed by Short Tandem Repeat (STR) profiling (Laragen Corp.), after expansion and passaging. The human breast cancer stem reporter cell line, tdtomato MDA-MB-231 SORE6>GFP, and the vector control cell line, tdtomato MDA-MB-231 minCMV>GFP, were maintained in 10% fetal bovine serum (FBS) in Dulbecco’s modified Eagle medium (DMEM). The MDA-MB-231-LM2 subline 98 was obtained from Dr. Joan Massague, Sloan Kettering Institute; the Met-1 cell line derived from an MMTV-PyVT mouse mammary tumor 46 was obtained from Dr. Alexander Borowsky, University of California, Davis; the 4T1 metastatic mammary cancer cell line was obtained from Dr. Fred Miller, Karmanos Institute, Detroit. All were maintained in DMEM, 10% FBS. The BAC1.2F5 macrophage cell line was maintained in 10% FBS in α-MEM with 3000 unit/ml CSF-1. Cryopreserved human primary monocyte-derived macrophages that had been isolated from peripheral blood monocytes and polarized to an M2 phenotype by 4–5 days culture with 10% FBS + 50 ng/ml CSF-1 + 10 ng/ml IL4 were obtained from StemExpress, Folsom, CA (Cat# PBMAC001.5C), and were thawed and used upon receipt. HUVECs (Lonza, Walkersville, MD, USA Lot # 0000396930) were grown in EGM-2 SingleQuot Kit media (Lonza) and used at passages 4–6. All cells were maintained at 37 °C in a 5% CO 2 incubator and were shown to be mycoplasma-free (Sigma LookOut Mycoplasma PCR detection kit, Cat# MO0035-1KT). Design of CSC reporter The original SORE6+ CSC biosensor consisting of six repeats of a composite SOX2/OCT4 binding element coupled to a minimal CMV promoter driving the expression of a dsCopGFP has been described previously 25 . A second-generation version of this reporter was generated (readily available from the authors upon request) for these studies. As the dsCopGFP fluorescence is lost on formalin fixation, the new biosensor has an N-terminal 3× FLAG epitope tag on the dsCopGFP to enable immunohistochemical detection in FFPE tissue and the puromycin drug selection cassette has been replaced with an expression cassette for a C-terminally truncated CD19 marker to enable rapid FACS selection of transduced cells. New constructs were made by Gateway multisite recombinational cloning. The SORE6 enhancer, minimal CMV promoter, tagged destabilized fluorescent protein and SV40-driven truncated CD19 selection marker elements were separately cloned and sequence-verified before Gateway assembly into pDest-412, a lentiviral destination vector based on the pCDF lentiviral backbone to generate the stem cell biosensor (SORE6>GFP). A parallel construct (“minCMV”) lacking the SORE6 enhancer element was generated as a nonspecific background control for FACS gating and fluorescent image thresholding in every experiment. The dsCopGFP protein has a half-life of 1–2 h, which is similar to the 1.5 h half-life reported for the OCT4 protein in P19 mouse teratocarcinoma cells 99 . As a small reduction in OCT4 protein levels in sufficient to alter the balance between self-renewal and differentiation 100 , the SORE6 reporter kinetics are tuned to parallel closely the dynamics of the stem cell phenotype. The second-generation SORE sensor behaves identically to the first-generation sensor that was extensively validated by us in multiple breast cancer models 25 and used by others 101 – 107 . siRNA knockdown of stem cell transcription factors siGENOME SMARTpool siRNAs were purchased from Dharmacon as follows: OCT4/POU5F1 (Cat# M-019591-03-0005); SOX2 (Cat# M-011778-00-0005); SOX9 (M-021507-00-0005); Non-Targeting siRNA Control Pool #1 (Cat# D-001206-13-05). MDA-MB231 cells transduced with the SORE6>GFP reporter were transfected with 20 nM siRNAs using Lipofectamine RNAiMAX Reagent (Invitrogen #13778075) in OptiMEM TM Reduced Serum Medium (Thermo Fisher Scientific #31985062). The % SORE6+ cells in the transfected cultures was assessed after 3 days by flow cytometry, using cells transduced with the minCMV>GFP as a gating control.
Show full methods section
Cell culture The MDA-MB-231 human breast cancer cell line was obtained from ATCC and the identity of the line was re-confirmed by Short Tandem Repeat (STR) profiling (Laragen Corp.), after expansion and passaging. The human breast cancer stem reporter cell line, tdtomato MDA-MB-231 SORE6>GFP, and the vector control cell line, tdtomato MDA-MB-231 minCMV>GFP, were maintained in 10% fetal bovine serum (FBS) in Dulbecco’s modified Eagle medium (DMEM). The MDA-MB-231-LM2 subline 98 was obtained from Dr. Joan Massague, Sloan Kettering Institute; the Met-1 cell line derived from an MMTV-PyVT mouse mammary tumor 46 was obtained from Dr. Alexander Borowsky, University of California, Davis; the 4T1 metastatic mammary cancer cell line was obtained from Dr. Fred Miller, Karmanos Institute, Detroit. All were maintained in DMEM, 10% FBS. The BAC1.2F5 macrophage cell line was maintained in 10% FBS in α-MEM with 3000 unit/ml CSF-1. Cryopreserved human primary monocyte-derived macrophages that had been isolated from peripheral blood monocytes and polarized to an M2 phenotype by 4–5 days culture with 10% FBS + 50 ng/ml CSF-1 + 10 ng/ml IL4 were obtained from StemExpress, Folsom, CA (Cat# PBMAC001.5C), and were thawed and used upon receipt. HUVECs (Lonza, Walkersville, MD, USA Lot # 0000396930) were grown in EGM-2 SingleQuot Kit media (Lonza) and used at passages 4–6. All cells were maintained at 37 °C in a 5% CO 2 incubator and were shown to be mycoplasma-free (Sigma LookOut Mycoplasma PCR detection kit, Cat# MO0035-1KT). Design of CSC reporter The original SORE6+ CSC biosensor consisting of six repeats of a composite SOX2/OCT4 binding element coupled to a minimal CMV promoter driving the expression of a dsCopGFP has been described previously 25 . A second-generation version of this reporter was generated (readily available from the authors upon request) for these studies. As the dsCopGFP fluorescence is lost on formalin fixation, the new biosensor has an N-terminal 3× FLAG epitope tag on the dsCopGFP to enable immunohistochemical detection in FFPE tissue and the puromycin drug selection cassette has been replaced with an expression cassette for a C-terminally truncated CD19 marker to enable rapid FACS selection of transduced cells. New constructs were made by Gateway multisite recombinational cloning. The SORE6 enhancer, minimal CMV promoter, tagged destabilized fluorescent protein and SV40-driven truncated CD19 selection marker elements were separately cloned and sequence-verified before Gateway assembly into pDest-412, a lentiviral destination vector based on the pCDF lentiviral backbone to generate the stem cell biosensor (SORE6>GFP). A parallel construct (“minCMV”) lacking the SORE6 enhancer element was generated as a nonspecific background control for FACS gating and fluorescent image thresholding in every experiment. The dsCopGFP protein has a half-life of 1–2 h, which is similar to the 1.5 h half-life reported for the OCT4 protein in P19 mouse teratocarcinoma cells 99 . As a small reduction in OCT4 protein levels in sufficient to alter the balance between self-renewal and differentiation 100 , the SORE6 reporter kinetics are tuned to parallel closely the dynamics of the stem cell phenotype. The second-generation SORE sensor behaves identically to the first-generation sensor that was extensively validated by us in multiple breast cancer models 25 and used by others 101 – 107 . siRNA knockdown of stem cell transcription factors siGENOME SMARTpool siRNAs were purchased from Dharmacon as follows: OCT4/POU5F1 (Cat# M-019591-03-0005); SOX2 (Cat# M-011778-00-0005); SOX9 (M-021507-00-0005); Non-Targeting siRNA Control Pool #1 (Cat# D-001206-13-05). MDA-MB231 cells transduced with the SORE6>GFP reporter were transfected with 20 nM siRNAs using Lipofectamine RNAiMAX Reagent (Invitrogen #13778075) in OptiMEM TM Reduced Serum Medium (Thermo Fisher Scientific #31985062). The % SORE6+ cells in the transfected cultures was assessed after 3 days by flow cytometry, using cells transduced with the minCMV>GFP as a gating control.
Tumorsphere assays
MDA-MB-231 cells transduced with the SORE6>GFP stem cell reporter were FACS-sorted into SORE6+ and SORE6− populations using cells transduced with minCMV>GFP construct as a gating control. Five thousand cells/well were seeded into Costar 24-well Ultralow attachment plates (Corning Cat#3473) in DMEM/10% FBS. After 10 days, tumorspheres were quantified from images captured using an EVOS FL Auto2 Imaging system using ImageJ, to size the tumorspheres for binning by diameter. To address the functionality of SORE6+ cells generated by co-culture with macrophages, 20,000 MDA-MB-231 cells were cultured with or without 40,000 BAC cells in 24-well plates for 24 h in BAC culture medium. After 24 h, tumor cells were collected by brief trypsinization (30 s), which selectively removes tumor cells, whereas the BAC cells remain adherent. The collected tumor cells were seeded at 1500 cells/well in Ultralow attachment plates in DMEM/10% FBS and assessed for tumorsphere formation after 10 days as above. Taxol treatment Unsorted MDA-MB-231 cells containing the SORE6>GFP reporter were seeded into 24-well plates and grown for 24 h. Cells were then treated with dimethyl sulfoxide (DMSO) vehicle or the indicated concentrations of Paclitaxel (time t = 0 h) and imaged every 6 h using the Incucyte S5 Live-Cell imaging system. SORE6-positive cells were quantifed as GFP+ cells and SORE6-negative cells were quantitated as GFP− cells within the same culture, using a parallel culture with the minCMV>GFP construct to set the threshold for positivity. qRT-PCR for stem cell transcription factors in MDA-MB-231 and Met-1 cells RNA was prepared from freshly sorted cells using the Trizol Reagent (Ambion) and cDNA was synthesized using SuperScriptTM III First-Strand Synthesis System (Thermo Fisher Scientific) as per the manufacturer’s instructions. qRT-PCR was performed with Brilliant II Ultra-Fast SYBR® Green QPCR Master Mix (Agilent) using a Bio-Rad CFX96 Real-Time Detection System. Fold gene expression was calculated using the delta CT method formula: 2 (−ΔCt) . Peptidylprolyl Isomerase A was used as the reference transcript for normalization. Sequences for all the primers used are listed in Supplementary Table 1 .
Animal models
All procedures were conducted in accordance with the National Institutes of Health regulation concerning the care and use of experimental animals and with the approval of Albert Einstein College of Medicine Animal Care and Use Committee. The stem reporter cells tdTomato MDA-MB-231 SORE6>GFP or the reporter control cells tdTomato MDA-MB-231 minCMV>GFP were injected into the mammary fat pad of SCID mice (NCI) as previously described 35 . Enhanced cyan fluorescent protein (ECFP) macrophage/Rag2-knockout mice (Rag2KO Macblue) were generated from the crossing B6.129S6-Rag2 tm1Fwa N12(Rag2—Model RAGN12, Taconic) with Tg(Csf1r*-GAL4/VP16,UAS-ECFP) 1Hume/J (Stock No: 026051, the Jackson Laboratory). Tumor cells were orthotopically injected with 50% Matrigel (BD Biosciences, cat # 354234) into the fourth mammary fat pad of Rag2KO MacBlue mice. For drug treatment (Clodronate, DAPT) experiments, animals were randomly assigned to the drug-treated or vehicle-treated groups. All subsequent analyses were performed on randomized samples in a user-blinded manner. In vivo limiting dilution assay for stem cell reporter validation To validate the newly modified version of the reporter, MDA-MB-231 cells expressing the tdTomato volume marker were transduced with the new SORE6>dsCopGFP construct. In parallel, cells were transduced with the matched minCMV>dsCopGFP as a gating control. Transduced cells were first selected by FACS sorting for the CD19 selectable marker, to ensure the presence of the reporter in all cells. CD19+ cell populations that were either SORE6+ (CSCs) or SORE6− (non-CSCs) were generated by FACS sorting for GFP. SORE6+ and SORE6− populations were then orthotopically implanted into the #2 and #7 mammary fat pads of 6-week-old female SCID/NCr mice in 0.1 ml 50% Matrigel. Tumor formation was monitored by regular palpation and caliper measurements, and confirmed at necropsy. CSC frequency was calculated from tumor incidence at day 98 post inoculation, using the ELDA software tool ( http://bioinf.wehi.edu.au/software/elda/ ). It should be noted that this assay is useful for assessing the relative tumor-initiating ability (and hence CSC representation) of two cell populations, but that the absolute CSC frequencies calculated by this approach strongly under-represent the true absolute frequencies. This is because the efficiency of experimental tumor initiation is strongly affected by multiple parameters, such as degree of immunodeficiency, mouse strain background, site of tumor cell implantation, and others, as documented in the literature 108 .
FACS and flow cytometry
For cultured cells, cells were trypsinized, pelleted, and resuspended in 2% bovine serum albumin (BSA)/PBS as a single cell suspension for FACS sorting. Tissues from tdTomato MDA-MB-231 SORE6>GFP or tdTomato MDA-MB-231 minCMV>GFP primary tumors were washed once with PBS, diced, suspended in PBS, passed through a 70 μm cell strainer, and centrifuged down to cell pellets. Pellets were resuspended in PBS, filtered with a 40 μm cell strainer, spun down, resuspended in 200 μL of 2% BSA/PBS, and stained with Antigen presenting cell (APC)-lineage antibody cocktail (BD Pharmingen, APC mouse lineage antibody cocktail, Cat# 51-9003632) at 5 μL antibody/million cells for 30 min at room temperature. After staining, the cells were washed twice with PBS and resuspended in 2% FBS/PBS for FACS sorting. Comparing with isotype control, APC-negative cells are the tumor cells for analysis. When sorting the SORE6+ (GFP+) and SORE6− (GFP−) cells from tdTomato MDA-MB-231 SORE6>GFP tissue, tdTomato MDA-MB-231 minCMV>GFP was always used as the GFP gating control. Cell surface marker expression in the SORE6+ and SORE6− compartments of MDA-MB-231 cells cultured in vitro or recovered from primary tumors was assessed by flow cytometry following staining with Brilliant Violet 421 TM anti-human CD133 (Biolegend Cat#372807), used at 5 μl antibody per million cells. Flow cytometry of stained cells was performed on a BD LSRFortessa SORP1 (BD Biosciences) using collection software FACS Diva version 8 and data were analyzed using FlowJo v10.6.2 software. MDA-MB-231 cells transduced with the minCMV>GFP control construct and stained with isotype control (Biolegend cat #400157) were used to set the thresholds. To assess the relationship between SORE6 positivity and ALDH positivity, MDA-MB-231 cells transduced with SORE6>GFP but lacking the tdTomato volume marker were incubated with AldeRedTM 558A (AldeRedTM ALDH Detection Assay, EMD Millipore Cat# SCR150) for 1 h at 37 °C. The AldeRedTM 588-A oxidation product was detected in the red channel (610 nm) by flow cytometry. Treatment of MDA-MB-231 cells transduced with control minCMV>GFP construct with AldeRedTM 588-A plus the ALDH inhibitor DEAB established the thresholds for AldeRed and SORE6>GFP positivity.
Fixed-frozen tissue immunofluorescence staining and imaging
Primary tumors and the inflated lungs from tdTomato MDA-MB-231 SORE6>GFP or tdTomato MDA-MB-231 minCMV>GFP xenograft mice were collected. The tissues were fixed in 5% neutral buffered formalin (NBF) and 20% sucrose in 4 °C for 2 days before being embedded and frozen in Optimal cutting temperature (OCT) compound. The fixed-frozen sections were brought in room temperature for 30 min, treated with −20 °C cold acetone for 10 min, washed with PBS, outlined with PAP pen, stained with DAPI (4′,6-diamidino-2-phenylindole) for 10 min, washed with PBS, and mounted on a coverslip for imaging. In the case of immunofluorescent staining, before the DAPI staining was performed, each section was blocked with 1% BSA, 10% FBS in PBS for 1 h at room temperature, incubated with anti-Iba1 antibody at 1 : 200 (Wako) in blocking buffer for 1 h, washed with PBS three times, incubated with secondary antibody (1 : 200) for 1 h, and washed two times as validated previously 58 . The dried stained slides were imaged with the DeltaVision microscope. tdTomato MDA-231 minCMV>GFP tissue slides were used for thresholding the images. Images were analyzed in ImageJ. In vivo time-lapse intravital imaging and analysis A mammary imaging window was implanted into mice with an MDA-MB-231 primary tumor expressing tdTomato + SORE6>GFP or tdTomato + minCMV>GFP, and intravital multiphoton imaging was performed on a custom-built two-laser multiphoton microscope as described earlier 109 , 110 . Mice were anesthetized with 1–2% isofluorane and kept at physiological temperatures on the microscope stage with the built-in environmental heat enclosure and vitals were monitored with pulse oximeter (PhysioSuite, Kent Scientific). All images were captured using a ×25, 1.05 NA water-immersion objective. For SORE6>GFP stem biosensor imaging, GFP background was set using tumors expressing the minCMV>GFP control construct (Supplementary Fig. S3 ). All subsequent SORE6>GFP stem biosensor imaging was performed at this laser power and GFP gain setting. Far-red Q dots (Thermo Fisher Scientific, cat# Q21061MP) were used to visualize the blood vasculature. Long time-lapse z -stack imaging was performed by imaging multiple fields (512 × 512 μm 2 or 341 × 341 μm 2 ) with a 5 μm z -step size. Motility analysis (Fig. 2b ) in the intravital movies was performed as described before 35 . The majority of tumor cells in the field were stationary and not included in the analysis. Only motile tumor cells, consistent with ref. 35 , Supplementary Fig S2 , were analyzed for speed calculations. Individual 16-bit TIFF images were assembled into a CZT hyperstack using a custom ImageJ macro. Temporal drift in multiple-channel time-lapse hyperstacks was corrected using HyperStackReg plugin 111 . For single cells SORE6− and SORE6+ cell motility analysis, cells were manually tracked using TrackMate plugin 112 . In addition, we measured tissue drift in our intravital movies and found that tissue drift after post-acquisition drift correction is minimal (~0.02 µm/min, Supplementary Fig. S4e and Supplementary Movie 9 ) and does not contribute to the cell migration on the time scale of the movies. Macrophage depletion using Clodronate A chronic mammary imaging window was implanted into Rag2KO Macblue mice with an MDA-MB-231 primary tumor expressing tdTomato + SORE6>GFP, and intravital multiphoton imaging of multiple 512 × 512 µm 2 fields were performed on three consecutive days (day0, day1, and day2) using an in vivo micro-cartography technique 44 on a custom-built two-laser multiphoton microscope as described above. Mice were injected intraperitoneally with 200 µl of either control PBS liposomes or Clodronate liposomes (Encapsula Nano Sciences, SKU# CLD-8901) on day0 and day1 after intravital imaging. The 3D objects counter plugin in Fiji was used to quantify macrophage voxels in the 3D hyperstacks. Macrophage density was calculated as the voxels covered by macrophages divided by total voxels in the field. SORE6+ cells were manually counted in each 3D hyperstack. In PyMT model, mice were injected intraperitoneally with 200 µl of either control PBS liposomes or Clodronate liposomes (concentration 18.4 mM) every 2 days for 2 weeks. Mammary tumors from PBS liposomes or Clodronate liposome-treated mice were extracted. FFPE tumor sections were stained with Iba1 IHC and macrophage density was calculated by the area covered by macrophages (Iba1 IHC, brown staining, Supplementary Fig. S5f ) divided by the total area of the field. For Sox9 Hi quantification, FFPE tumor sections were stained with Sox9 antibody at 1 : 100 dilution (EMD Millipore, cat# ab5535) and Sox9Hi tumor cell population was defined by choosing ~top 5% of the tumor cells with the highest Sox9 fluorescence signal in the control tissues, which corresponded to a fluorescence intensity threshold range of 80–255. Same threshold was applied to the clodronate tissue. Both control and clodronate tissues were imaged at the same excitation intensity and exposure times on 3D Histech Pannoramic P250 digital whole slide scanner. To assess potential effects of clodronate directly on tumor cells, unsorted MDA-MB-231 cells containing the SORE6>GFP sensor were treated with 25 or 100 μM clodronate for 48 h and SORE6+ cells in the population were assessed at endpoint by flow cytometry as above. In vivo CSC identification in fixed tissue with anti-FLAG IF staining Primary MDA-MB-231 xenograft tumors from SCID and nude mice, expressing tdTomato + SORE6>GFP or tdTomato + minCMV>GFP, were excised, FFPE, and 5 µm sections were cut using a cryostat. For IF staining for the FLAG tag on the dsCopGFP, sections were deparaffinized, followed by antigen retrieval in 1 mM EDTA pH 8 for 20 min in a conventional steamer and 20 min incubation at room temperature. Tissues were washed 3 × 5 min and incubated in blocking buffer (1% BSA + 5% goat serum) for 1.5–2 h at the room temperature, followed by rat anti-FLAG at 1 : 1000 (BioLegend, cat# 637301) incubation overnight at 4 °C and secondary antibody goat anti-rat Alexa 647 for 1 h at room temperature. The FLAG channel in the minCMV>GFP tissue was used to set the background in SORE6>GFP tissue, to identify single stem cells. For in vivo characterization of FLAG antibody (Supplementary Fig. S2b ), SORE6>GFP sensor expressing MDA-MB-231 primary tumor FFPE sections were treated with 1× citrate pH 6.0 buffer (PerkinElmer, cat# AR6001) and stained with chicken anti-GFP antibody at 1 : 100 (Novus, cat# NB100-1614) and rat anti-FLAG antibody at 1 : 200 dilutions. In vivo invadopodia and degraded collagen IF staining, imaging, and quantification In live tissue (Fig. 2c–e ), invadopodia are identified morphologically as thin oscillatory protrusions with 8–10 min cycle 36 , 40 . For invadopodia identification in fixed tissue, primary MDA-MB-231 xenograft tumors were excised from SCID mice expressing tdTomato + SORE6>GFP or tdTomato + minCMV>GFP. FFPE tissues were deparaffinized, followed by antigen retrieval in 1 mM EDTA pH 8 for 20 min in a conventional steamer. Tissues were incubated in blocking buffer (1% BSA + 5% goat serum) for 2 h at the room temperature, followed by primary antibodies overnight at 4 °C and secondary antibodies for 1 h at room temperature. In fixed tissue (Fig. 2h ), invadopodia are identified molecularly by Cortactin + Tks5 colocalized dots 36 , 43 . Cortactin + Tks5 colocalized puncta within the cell boundary marks invadopodia in these cells, consistent with published literature 42 , 43 , 113 . We did not use phalloidin staining, as F-actin is present in other cellular structures (e.g., filopodia, focal adhesions, etc.) and is not a specific marker of invadopodia. Degraded collagen was detected with C1,2C (Col 2 3/4C short ) rabbit antibody at 1 : 100 dilution (Ibex Pharmaceuticals) 38 . Degraded collagen staining colocalizing with cortactin, one of the invadopodia marker, identifies mature invadopodia (i.e., actively degrading shown by white arrow in Fig. 2k ). The position of the cleaved collagen does not always colocalize with invadopodia, This is a well-known issue with cleaved collagen 38 . The reason is that cleaved collagen signal represents the current and historical buildup of degraded collagen as different invadopodia at different times degrade different areas of ECM and move on. Stem cells were identified with rat anti-FLAG antibody as described above. The slides were imaged on a 3D Histech Pannoramic P250 digital whole slide scanner, using a ×40, 0.95 NA air-objective lens. Digital whole slide scan tissue images were opened in CaseViewer v2.1. FLAG channel intensity in minCMV>GFP tissue was used to set the background in SORE6>GFP tissue to identify single stem cells and five to six random regions of interest (ROIs) at ×40 from non-necrotic areas were saved. Images were opened in ImageJ and a custom ImageJ macro was used for dividing each image into stem cell and non-stem cell areas. Cell areas were defined as the circular 36 µm diameter ROI around each single stem cell (3× diameter of a single cell, ~12 µm to capture all the extending invadopodia protrusions and their collagen-degrading activity from each cell). Invadopodia were identified as cortactin and Tks5 containing puncta and normalized to the size of stem and non-stem cell areas. Accordingly, collagen degradation was calculated as the Col3/4-positive area (%) in stem and non-stem cell areas as described above. In addition, a higher resolution analysis, to assign the origin of the cortactin and Tks5 containing puncta signal to SORE6+ or SORE6− cells, was done by reanalyzing random fields in Fig. 2j, m by drawing the boundary of FLAG+ cells manually (as shown in Fig. 2h, k ) to define stem cell and non-stem cell areas. Re-analyzed results (Supplementary Fig. S4f, g ) led to the same conclusions as that obtained using the automated 36 µm ROI method (Fig. 2j, m ), i.e., compared to non-stem cells, stem cells have significantly more invadopodia and higher degradation activity in vivo. CSC distance analysis relative to TMEM, and blood vessels without TMEM, in fixed tissue in vivo Sequential sections from primary MDA-MB-231 xenograft tumors from SCID mice, expressing tdTomato + SORE6>GFP or tdTomato + minCMV>GFP, were stained for TMEM IHC (mouse anti-Mena at 1 : 1000, rabbit anti-Iba1 at 1 : 5000, and rat anti-Endomucin at 1 : 50) 15 , 60 and anti-FLAG to identify SORE6+ stem cells. TMEMs were identified manually by a pathologist. Stem cells were identified by thresholding the anti-FLAG image based on the threshold value obtained from the anti-FLAG-stained minCMV>GFP control tumor section. TMEM IHC and FLAG images were aligned in ImageJ using Landmark Correspondences plugin. For scoring purposes, each TMEM doorway was visualized as 60 μm diameter circle and distance of all CSCs were measured to its nearest TMEM circle using a custom-written ImageJ macro (provided as a supplementary software). Cells that were inside or touching the TMEM boundary were counted in data point 0 μm in Fig. 6d, g , with subsequent cell counts measured within each 40 μm interval area contour moving away from the TMEM. For non-stem cell distance with the nearest TMEM in the field, DAPI channel was thresholded followed by watershed algorithm to find non-stem cells. Distance of each non-stem cell to its nearest TMEM was calculated using the same ImageJ macro as above. The distance of CSCs to TMEM was calculated in reference to TMEM, not the entire length of the blood vessel that contains TMEM (TMEM and blood vessel without TMEM schematics shown in Fig. 6c, e ). To exclude the possibility of CSCs being near TMEM by chance, CSC distance histograms (Fig. 6d, f–h ) were normalized by distances of all tumor cells in the field (DAPI staining) to nearest TMEM (Fig. 6d, g ) or blood vessel without TMEM (Fig. 6f, h ). Similarly, stem cell distance analysis with nearest blood vessel without TMEM was done by thresholding the blood vessel channel and removing blood vessels that contained TMEM. For scoring purposes, each blood vessel is visualized as an ROI delineating the vessel boundary and distance of all CSCs were measured to its nearest blood vessel using the ImageJ macro as above. Cells that are touching the vessel are counted in data point 0 μm in Fig. 6f, h , with subsequent cell counts measured within each 40 μm interval area contour moving away from the vessel. All distance histograms were analyzed and plotted in Excel. For MenaINV staining, MDA-MB-231 FFPE primary tumor tissues were stained with chicken anti-MenaINV antibody 19 at 1 : 200 dilution. In vitro tumor cell-macrophage co-culture assay In vitro, the baseline SORE6 positivity for the MDA-MB-231 subline used in the current study varied from ~15% to 40%. Tumor cells (tdtomato MDA-MB-231 SORE6>GFP) were plated alone or with macrophages (BAC1.2F5) or HUVEC (Lonza, cat# CC-2517) at a 1 : 5 ratio (5000 tumor cells and 25,000 macrophages or HUVEC) in a 35 mm glass-bottom dish (Ibidi, cat# 81156) and allowed to adhere overnight. Next day, cell media was replaced with imaging media (L-15 + 10% FBS) and cells were imaged live on an epi-fluorescence DeltaVision microscope (GE) with a ×20 objective and CoolSNAP HQ2 CCD camera. For live imaging, tumor cells were plated overnight. Next day, media was replaced with imaging media, followed by macrophage addition at the beginning of live imaging. To identify stem cells, control tdtomato MDA-MB-231 minCMV>GFP cells plated under identical conditions were used to set the background GFP level. For Notch1 inhibition, 10 µM DAPT (Sigma, cat# D5942) or 20 µM SAHM1 (Sigma, cat# 491002), or vehicle control DMSO was added to the co-culture dish. For Notch activation, 50 µM Jagged1 (AnaSpec, cat# AS-61298) and its control, Jagged1 scramble (AnaSpec, cat# AS- 64239) was added in solution to the co-culture dish. Cells were incubated with peptides overnight before the measurements were made. For Notch signaling blocking antibodies experiment, TC + Mac co-cultures were treated with 20 µM IgG (BioLegend, clone: HTK888, cat# 400901) or 20 µM Jag1 (BioLegend, clone: HMJ1-29], cat# 130902), or 20 µM Jag2 (BioLegend, cat# 131001) or 20 µM Jag1 + 20 µM Jag2 in solution overnight. To confirm the co-culture observations independently in different tumor models using different analysis procedures, 10,000 4T1 cells transduced with SORE6>dsEGFP (baseline %SORE6 positivity 3.3 ± 0.4%) were co-cultured with 50,000 BAC1 cells in BAC medium (α-MEM, 10% FBS, 10 ng/ml CSF-1) for 4 days and then trypsinized for flow cytometry analysis to identify the SORE6+ cells as % total tumor cells using the minCMV>dsEGFP as a gating control. BAC1 cells were gated out using the F4/80 macrophage marker. Similarly, MDA-MB-231-LM2 cells expressing a GFP volume marker were transduced with a SORE6>dsmCherry stem cell sensor (baseline %SORE6 positivity 21.2 ± 0.5%). Next, 10,000 tumor cells were co-cultured with 20,000 BAC cells in BAC medium for 36 h and then analyzed by FACS to determine SORE6+ CSCs (mCherry+ cells) as % total tumor cells (identified by GFP volume marker). To assess the requirement for direct contact, BAC cells were seeded into Millicell Hanging Cell Inserts (Millipore Sigma, 3 μm pore-size PET membrane), with tumor cells in the well below, so that direct cell contact was prevented but secreted factors could be freely exchanged between the two cell types. Microarray for Notch ligands For analysis of gene expression of Bac 1.2F5 cells, RNA was isolated using a Qiagen RNeasy mini kit. The RNA was quality controlled using an Agilent Bioanalyzer and then provided to the Einstein Genomics Core. The core performed labeling, hybridization, scanning, and RNA normalization using an Affymetrix Mouse Gene 2.0 ST microarray. The data discussed in this publication have been deposited in NCBI’s Gene Expression Omnibus and are accessible through GEO Series accession number GSE185443 . Notch1 signaling inhibition in vitro using siRNA AllStars Neg. Control siRNA (1027281) was from Qiagen and On-target plus human Notch1 siRNA smartpool was from Dharmacon (Thermo Scientific, cat# L-007771-00-0005). A total of 1.5 × 10 6 tumor cells (tdtomato MDA-MB-231 SORE6>GFP) were transfected with 10 µl of 20 µM siRNA stock solution using Nucleofector Kit V from Lonza (cat# VCA-1003) for 48 h, as described previously 19 . Notch1 knockdown was confirmed using western blotting with the following antibodies: rabbit anti-Notch1 at 1 : 1000 (Cell Signaling, cat# 3608), rabbit anti-Notch2 at 1 : 1000 (Cell Signaling, cat# 5732), and mouse anti-GAPDH at 1 : 10,000 (Abcam, cat# ab8245). At 36 h post siRNA transfection, tumor cells were plated with macrophages (1 : 5 ratio) overnight. Next day, cells were imaged live on DeltaVision microscope as described above. Notch signaling inhibition in vivo using DAPT DAPT (Sigma-Aldrich Cat# D5942) was reconstituted in 100% ethanol to a stock concentration of 20 mg/ml, then further diluted in corn oil to a final concentration of 2 mg/ml. Eight-week-old PyMT mice bearing palpable tumors and separate cohort of SCID mice with MDA-MB-231 xenograft tumors expressing tdTomato + SORE6>GFP or tdTomato + minCMV>GFP were given daily intraperitoneal injections of 10 mg/kg DAPT or vehicle control (1 : 10 ethanol in corn oil) for 14 days. On day 15, the primary tumors, lungs, and duodenums were collected from the mice and fixed in 10% formalin. Mice were weighed on day1 and day 15, to determine that no significant weight loss was suffered due to the DAPT treatment. Duodenums were stained using the Periodic acid-Schiff staining. In PyMT model, primary FFPE tumor sections were stained with Iba1 antibody and macrophage density was calculated by the area covered by macrophages divided by the total area of the field. For Sox9 quantification, FFPE tumor sections were stained with Sox9 antibody at 1 : 100 and Sox9Hi tissue coverage area was quantified. For NICD1 and Hes1 staining, FFPE tumor sections from PyMT mice bearing SORE6>GFP and treated with either control or DAPT were stained with either Cleaved Notch1 (Val1744) (D3B8) at 1 : 200 (Cell Signaling, cat# 4147) or Hes1 antibody at 1 : 100 (Millipore, cat# AB5702). In MDA-MB-231 model, FFPE lung sections were stained with FLAG antibody to identify SORE6+ CSCs.
Time-lapse imaging of in vitro tumor cell-macrophage co-culture
In vitro time-lapse movies of co-cultured cells were taken with a DeltaVision microscope at 2 min intervals for 16 h, at ×20 magnification. To avoid phenol red autofluorescence, the cells were plated into L-15 culturing media. Fixed culture plates were also imaged at ×20; these images were used to determine percentage of SORE6+ cells by GFP intensity, thresholded based on the background GFP expression in vector control cell, tdtomato MDA-MB-231 minCMV>GFP. For cell-fate mapping in co-culture experiment shown in Fig. 4f , 25,000 tumor cells (MDA-MB-231 SORE6>GFP) were plated in BAC culture media in 35 mm glass-bottom dish (Ibidi, cat# 81156) and allowed to adhere overnight. Next day, media was changed to L-15 + 10% FBS + CSF-1 media and cells were imaged live every 10 min on an epi-fluorescence DeltaVision microscope (GE) with a ×20 objective and CoolSNAP HQ2 CCD camera. After 30 min of imaging, 125,000 BAC cells were added to tumor cells in the dish on the imaging stage and imaging was continued for 30 h. Time-lapse movies were analyzed by identifying SORE6− cells in the frames before macrophage addition, based on the GFP threshold set by MDA-MB-231 mCMV>GFP fluorescence. SORE6− cells were manually tracked frame-by-frame for macrophage touch or no touch in the phase channel time lapse and the corresponding GFP fluorescence increase or no change in the GFP channel time lapse. For cell-origin mapping in co-culture experiments as shown in Fig. 4g , MDA-MB-231 tumor cells were FACS-sorted to give a starting population that contained ~2% SORE6+ cells so as to simplify the mapping process. Next, 20,000 tumor cells were co-cultured with or without 30,000 BAC cells in 24-well plates in BAC medium and live imaged every hour starting at 6 h after plating, using an Incucyte S3 Live-Cell Analysis System at ×10 magnification (Essen BioScience). Cells that were SORE6+ at t = 30 h were origin-traced back to their starting state at t = 6 h, to determine whether they originated from pre-existing SORE6+ cells or from direct induction of a stem phenotype in SORE6− cells. The fraction of SORE6+ cells at 30 h that originated from SORE6− cells at 6 h was assessed by origin mapping 32 SORE6+ cells/well from four wells/condition, for a total of 128 SORE6+ cells/condition.
Gelatin degradation assay and in vitro immunofluorescent staining
Invadopodia matrix degradation assay was performed as described previously 37 . SORE6+ and SORE6− cells were FACS-sorted and plated on fluorescent Alexa-405-labeled gelatin matrix-coated plates overnight. Cells were fixed with 3.7% paraformaldehyde for 15 min and permeabilized with 0.1% Triton X-100 for 5 min. Cells were blocked in 1% BSA + 5% FBS for 1 h, incubated with primary antibodies; anti-cortactin (1 : 400) and anti-Tks5 (1 : 100 dilution) for 1 h, followed by incubation with appropriate secondary Alexa antibodies (1 : 400) for 1 h. Cells were images on DeltaVision widefield fluorescence microscope. Images were processed in ImageJ.
Intravasation assay
(CTC analysis) About 1 ml of blood was drawn from the right heart ventricle of anesthetized mice bearing an ~1.5 cm diameter primary tumor. Blood was immediately fixed in 5% NBF at room temperature for 15 min, then washed with 10 ml PBS 3 times by centrifugation at 200 × g for 5 min. The pellet was resuspended in PBS/0.1% Triton X for 1 min, washed once, and stained with DAPI. The final pellet was resuspended in 300 µl PBS, dropped onto 35 mm glass-bottom µ-Dishes (Ibidi, cat #81156), and left in 4 °C overnight before imaging on an epi-fluorescence DeltaVision microscope (GE).
Quantification of SORE6+
CSCs was done in ImageJ. CTCs from minCMV>GFP control reporter tumor mice were used for setting the GFP threshold.
Live lung imaging
The stem reporter cells tdTomato MDA-MB-231 SORE6>GFP or the reporter control cells tdTomato MDA-MB-231 minCMV>GFP were injected into the mammary fat pad of SCID mice (NCI). In ~6 weeks, SCID mice bearing orthotopic MDA-MB-231 SORE6+ tumors of size ~1 cm in diameter, underwent placement of permanent lung imaging window as previously described 44 . Large volume high-resolution intravital (LVHR-IVI) imaging 109 was performed through the window 24 h post implantation (Day0), to capture the architecture of lung vasculature. Vasculature was labeled with an intravenous injection of 50 µL of a fluorescently tagged dextran (50 µg/mL, 10kD Cascade Blue Dextan). Twenty-four hours later (Day1), LVHR-IVI imaging was repeated to capture disseminated tumor cells that arrived in the lung vasculature. SORE6− and SORE6+ cells were distinguished by the presence or absence of the green GFP signal in addition to the red tdTomato cell volume marker present in all tumor cells.
Ex vivo lung processing
SCID mice, bearing 1–1.5 cm orthotopic MDA-MB-231 SORE6+ tumors, were killed and lungs were inflated with 5% formalin injected into trachea. Lungs were removed and incubated in 5% formalin/20% sucrose solution overnight at 4 °C. Next day, lungs were embedded in OCT compound and 7 μm-thick sections were cut. Slides containing lung sections were equilibrated at room temperature for 10 min, permeabilized in cold acetone for 10 min, and washed once with PBS. Slides were then mounted with mounting media containing DAPI (Vector Laboratories, Burlingame, CA). Slides were imaged on P250 scanner and images were acquired in DAPI, fluorescein isothiocyanate (FITC) (SORE6-GFP), and TRITC (tdTomato) channels.
Quantification of micrometastatic foci in the lung
After the termination of the DAPT treatment scheme and animal sacrifice, lungs were collected and immersed in 10% formalin. The tissues were processed for histological examination by embedding in paraffin. Two consecutive sections cut at 50 μm intervals were obtained for each lung and stained for hematoxylin and eosin. Metastatic foci containing >5 cancer cells were counted in the tissue section of the entire lung in both slides for each case. Effect of passage through circulatory system on CSC representation in tumor cell population Half a million unsorted MDA-MB-231 cells transduced with the SORE6 reporter and a constitutive volume marker were injected into the tail vein of 6- to 8-week-old female nude mice. The % SORE6+ cells at the time of injection ( t = 0) was assessed by flow cytometry. At t = 6 h, lungs were collected and immediately imaged using a Zeiss LSM 880 microscope. The % SORE6+ cells in the lung at t = 6 h after tail vein injection was assessed by counting SORE6+ and SORE6− cells in 25 random ×40 high-power fields/lung for each of 3 mice (347, 450, and 271 total cells/mouse). SORE6+ cells were identified using the minCMV reporter as a gating (flow) or thresholding (microscopy) control.
Human breast cancer tissue collection
Breast cancer tissue was collected from 49 patients under the Albert Einstein College of Medicine/Montefiore Medical Center Institutional Review Board protocol approval. Patient consent was not required for this study (IRB# 2016-7193 & IRB# 2017-8158). Cancer cells were collected by FNA from unfixed mastectomies and lumpectomies and used for the assessment of stem cell marker expression as described below. FNA primarily collects loose tumor cells, with very few macrophages and no endothelial cells and incurs minimal tissue damage 114 . Briefly, five to ten FNA aspiration biopsies per tumor were performed on at least 3 areas of grossly visible tumor using 25-gauge needles. The adequacy of the sample was assessed by the standard Diff-Quick protocol 115 . Only samples composed of at least 90% malignant epithelial cells, as determined by standard pathologic characteristics, were used for the analysis 116 . The cells obtained by FNA were analyzed by flow cytometry for the expression of CD44+/CD24−. They were also analyzed for the expression of ALDH1 and CD133 by in situ hybridization and qRT-PCR. After cell collection by FNA, the remaining tissue was FFPE and sent for routine pathological analysis. FFPE tissue blocks with representative tumor were used for triple-IHC staining of TMEM and TMEM doorways score analysis. Thus, the TMEM analysis and the analyses for the expression of stem cell markers were blinded and done on the very same tumor. This approach allowed us to assess the percentage of cancer cells expressing stem cell markers and the density of TMEM doorways from the same samples (Fig. 8b ).
Tissue selection for TMEM staining and scoring
At the time of routine microscopic examination of the lesions on which FNA biopsies had been performed, an appropriate area containing invasive cancer suitable for TMEM analysis was identified by low power scanning. The following criteria were used: high density of tumor, adequacy of tumor, lack of necrosis or inflammation, and lack of artifacts such as retraction or folds. TMEM stain is a triple immunostain for predicting metastatic risk in which three antibodies are applied sequentially and developed separately with different chromogens on a Bond Max Autostainer. We used the pan-Mena mouse monoclonal antibody at 1 : 1000 (BD# 610693), CD68 at 1 : 300 (Dako # M0876), and CD31 at 1 : 500 (Dako # M0823). The assessment of TMEM scores was performed using Adobe Photoshop Version: 2015.1.2 on 10 contiguous 400× digital images of the most representative areas of the tumor. The total TMEM for each image was tabulated and the scores from all ten images were summed to give a final TMEM density for each patient sample, expressed as the number of TMEM per 10,400× fields (total magnification) 59 , 60 . Twenty-five randomly chosen cases were each independently scored by two pathologists. As the correlation between the scores read by 2 pathologists was excellent with the correlation coefficient r = 0.97, the remaining 24 cases were scored by one pathologist. Flow cytometry analysis of human breast cancer specimens for CD44+/24− The cells obtained by FNA were washed with PBS and filtered through 35 µm cell strainer to make it into a single cell suspension (4 °C was maintained all the time). The cells were then diluted to 500 cells/µl in PBS to 400 µl and divided into two eppendorf tubes at 200 µl each. In the first tube, 2 µl each of the isotype controls for CD44 and CD24 were added. Then, in the second tube each of two antibodies anti-human/Mouse CD44 PE-Cyanine5 and anti-human/Mouse CD24 PE were added. These solution mixtures were kept at room temperature for 20 min in the dark. The samples were then run through GUAVA flow cytometer. The first tube was run to set up the quadrants and antibody isotype controls were used to setup the gain in the machine. Then the samples with antibodies were analyzed. Cells present in lower right quadrant showed the % of CD44+/CD24− cell population. In situ hybridization for ALDH1 and CD133 In situ hybridization was performed using Cy3 labeled ALDH1 and CD133 probes (Aanera Biotech, Albany, NY), the cell membrane was stained with 5-Hexadecanoylaminofluorescein and the nucleus with and DAPI (Thermo Fisher Scientific, Waltham, MA). The cells were fixed in 3% formaldehyde and permeabilized using 0.1% Triton-100 buffer. Fifty nanograms of probe was mixed with 100 µl of hybridization buffer containing 1 mg of tRNA, 10 mg Dextran Sulfate, 20 µl of deionized formamide, 10 ng of N30 oligonucleotide in 2× saline-sodium citrate (SSC) and hybridized at 37 °C in dark in a shaker incubator at 50 r.p.m. The cells were resuspended in 10% deionized formamide in 2× SSC and incubated at 42 °C in dark in a shaker incubator at 50 r.p.m. Re-suspend cells in wash buffer containing 10 ng/µl DAPI for nuclear counterstaining and 200 ng of FITC dye an incubate for 5 min at 37 °C in dark. Reconstitute in 50 µl of Anti-fade Mounting Buffer (Thermo Fisher Scientific, Waltham, MA) and mount in a glass-bottom petriplate (MatTek Corporation, Ashland, MA). Imaging was performed for DAPI, FITC, and Cy3 channels. Using ImageJ, the FITC area labeling the membrane and DAPI-stained nucleus area was identified. Cy3 signal was quantified in the donut-like cytoplasmic area and was compared to the TMEM values. qRT-PCR for ALDH1 and CD133 Total RNA was amplified as previously described 117 . Briefly, 1× lysis buffer was added to the cancer cells. Primer mix (50 and 100 µg/µl) was added to the lysis solution. After incubation (80 °C for 10 min), RT master mix (5× First-strand buffer, dithiothreitol, 10 mM dNTP mix, RNase inhibitor, SS III enzyme) was added. This reaction mixture was incubated at 42 °C for 60 min for reverse transcription. cDNA was purified by ZYMO column and 1× wash buffer. Purified cDNA was eluted by nuclease free water. Tailing master mix (10× TdT Buffer, 10 mM dTTP, TdT enzyme) was added to the purified cDNA for TdT tailing. The reaction mixture was incubated for 37 °C for 2 min, 80 °C for 10 min, and 4 °C for 2 min. Then promoter synthesis master mix (10× Klenows buffer, 50 µg/µl T7 promoter oligo, dNTP mix, Klenow enzyme) was added to the poly A tailed cDNA solution. This reaction mixture was incubated for 22 °C for 30 min, hold at 4 °C for T7 promoter synthesis. Finally, in vitro transcription with T7 polymerase was done by T7 high-yield RNA synthesis kit (New England Biolabs). Purification of mRNA was done by Qiagen mini column. After eluting the amplified mRNA, was quantified spectrophotometrically using the NanoDrop 2000 spectrophotometer (Thermo Scientific). After the first-round amplification, 100 ng RNA was taken for second-round amplification (same procedure described above). The first-strand cDNA synthesis was carried out by N9, dTVN, Superscript transcriptase II, dNTPs, RNAase, using this 2 µg of second-round amplified RNA. Quantitative PCR was performed with stem cell marker-specific primers. The expression of each gene was quantified by using the comparative Ct (ΔCt) method as described in the Assays-on-Demand User’s Manual (Applied Biosystems). The fold values ( X ) were calculated using the formula: X = 2(−ΔCt), where the data for the sample and sham-treated cell (here, the calibrator being the sham-treated cells) were first normalized against variations of sample quality and quantity. The ΔCt was determined using the formula: ΔC( t ) sample = C( t ) target gene of sample − C( t ) reference gene. The expression of the target genes was normalized to GAPDH. Sox9 and triple-IHC TMEMs staining in human samples The FFPE human tumor sections with known TMEM scores 18 were stained with Sox9 antibody at 1 : 100 dilution (EMD Millipore, cat# ab5535). Sections were then scanned on 3D Histech Pannoramic P250 digital whole slide scanner and images were analyzed in Visiopharm program by first thresholding them based on the negative control (secondary antibody only) and then measuring the mean Sox9 fluorescence intensity. For Sox9Hi CSC distribution with respect to the TMEM doorways, sequential tissue sections were stained with triple-IHC (pan-Mena, CD68, and CD31 antibodies) and Sox9 antibody. TMEM-rich areas are defined as at least three TMEM doorways per ×40 magnification field of view, or 30 TMEM doorways per the ten ×40 fields (TMEM score). This cutoff point is chosen, because TMEM score of 23 is associated with increased risk of developing metastatic disease 59 . Sox9Hi tumor cell population was defined by choosing approximately top 5% of the tumor cells with the highest Sox9 fluorescence signal, which corresponded to a fluorescence intensity threshold range of 60–255. All slides were scanned at the same excitation intensity and exposure times on the whole slide scanner. Statistical analysis GraphPad Prism 7 and Excel were used to generate graphs/plots and for statistical hypothesis testing. Statistical significance was determined by either t -test (normally distributed paired or unpaired dataset), Mann–Whitney test (non-normally distributed unpaired dataset), or Wilcoxon matched-pairs test (non-normally distributed paired dataset). Normality (Gaussian distribution) of each dataset was checked with D’Agostino and Pearson’s normality test in GraphPad Prism 118 . Statistical significance was defined as p -value < 0.05. For the correlation of TMEM density with the proportion of cancer cells expressing stem cell markers, we used Pearson’s correlation. Reporting summary Further information on research design is available in the Nature Research Reporting Summary linked to this article.
Supplementary information Supplementary Information Peer Review File Description of Additional Supplementary Files Supplementary Movie 1 Supplementary Movie 2 Supplementary Movie 3 Supplementary Movie 4 Supplementary Movie 5 Supplementary Movie 6 Supplementary Movie 7 Supplementary Movie 8 Supplementary Movie 9 Supplementary Movie 10 Supplementary Movie 11 Supplementary Movie 12 Supplementary Movie 13 Supplementary Movie 14 Reporting Summary Custom Code
📊 Figures
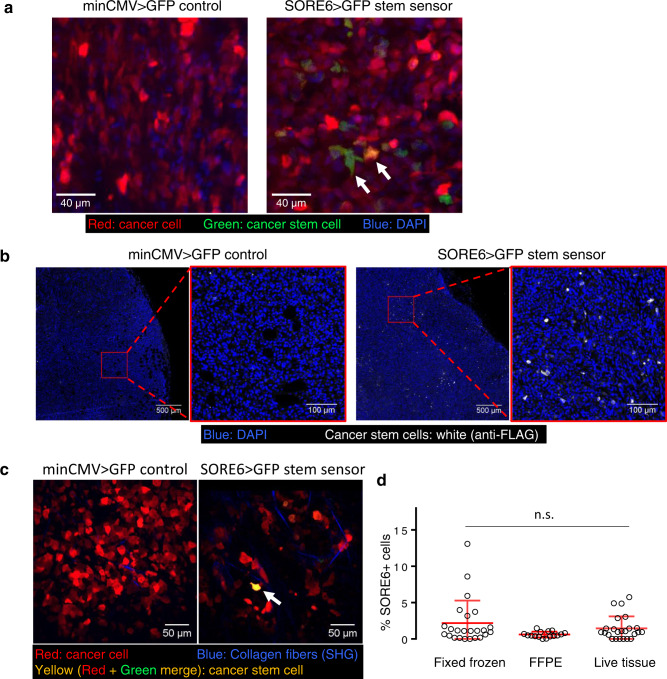
Fig. 1
Breast carcinoma stem cells are a minority population in the primary tumor in vivo.
a Representative images of fixed-frozen tumor tissues. Left panel: tdTomato-minCMV>GFP vector control tumor tissue; right panel: tdTomato-SORE6>GFP reporter MDA-MB-231 tumor tissue. Arrows point to tw...
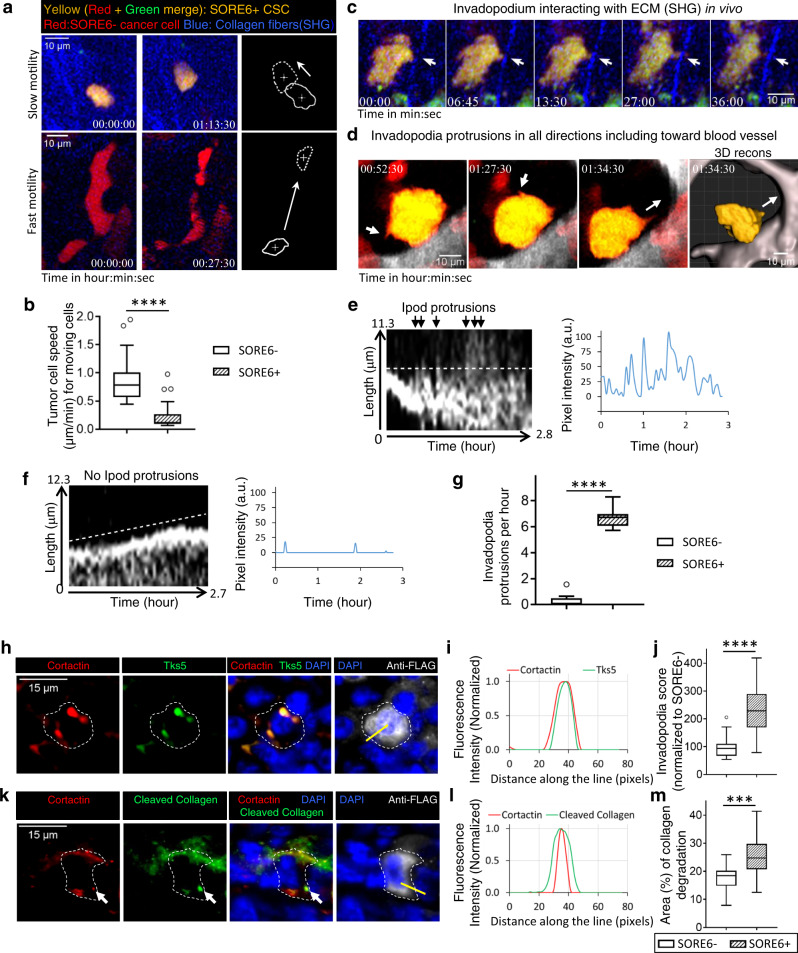
Fig. 2
Breast carcinoma stem cells exhibit the slow-migratory, invadopodium-rich phenotype in vivo.
a Examples of slow motility of CSC (top panel, Supplementary Movie 1 ) and fast motility of non-CSC (bottom panel, Supplementary Movie 2 ). Rightmost panels show cell outlines in first (solid) and las...
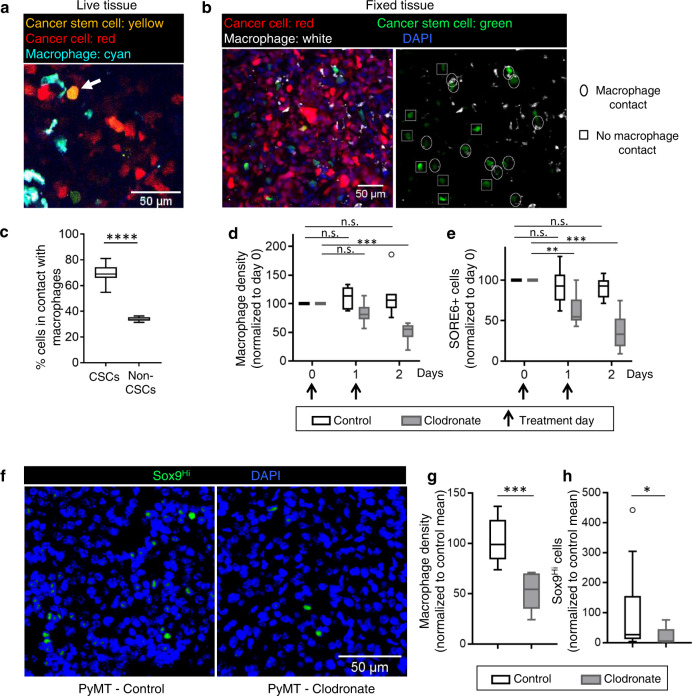
Fig. 3
Macrophages regulate stemness in breast cancer cells.
a Intravital microscopy image of a CSC (arrow) in contact with a macrophage in primary tumor in a living mouse. b Left panel: representative images of fixed-frozen primary tumor tissue showing cancer ...
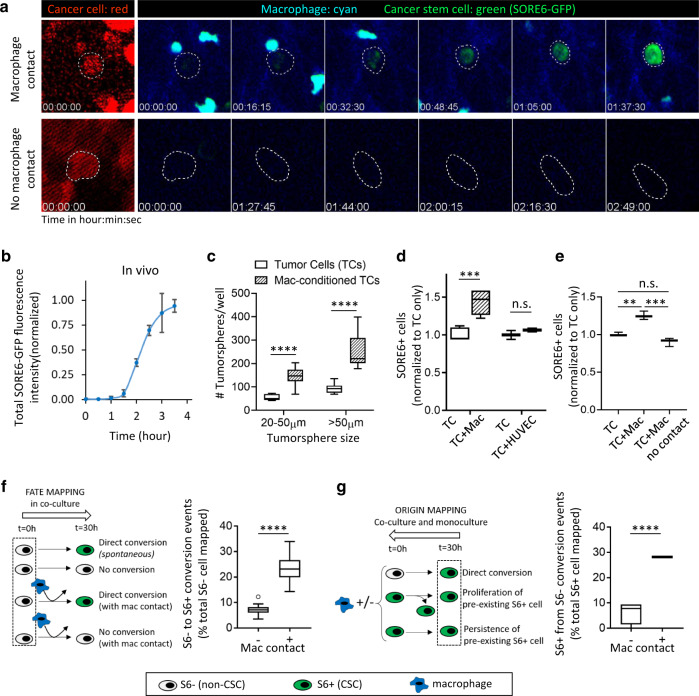
Fig. 4
Macrophage contact induces stemness in breast cancer cells.
a Upper panels show SORE6>GFP induction (green) in vivo in a tumor cell after macrophage contact (Supplementary Movie 10 ). Lower panels show lack of stemness induction (no SORE6-GFP increase) in a tu...
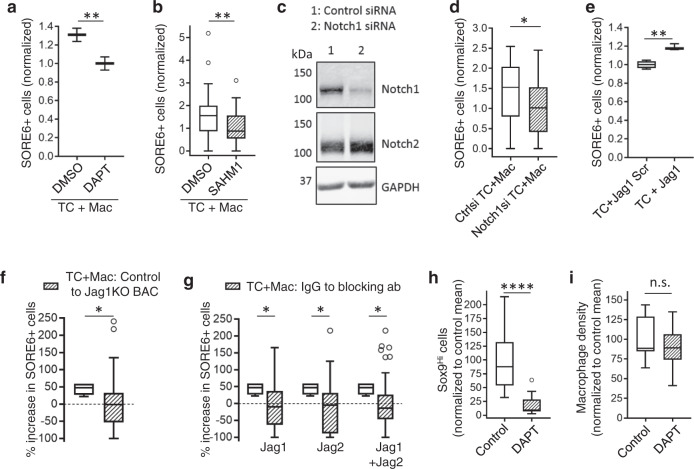
Fig. 5
Notch1-Jagged signaling regulates macrophage contact-induced stemness in breast cancer cells.
a Quantification of SORE6+ cells in TCu2009+u2009Mac co-cultures treated with DMSO or DAPT. n =u200960 fields at u00d720 magnification; data normalized to the DAPT mean; unpaired two-tailed Studentu20...
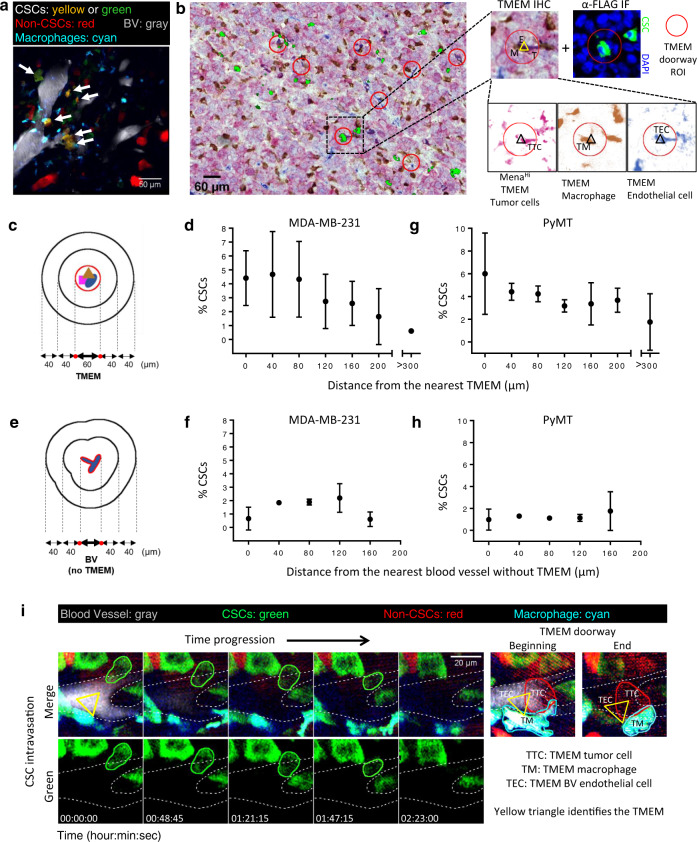
Fig. 6
Breast carcinoma stem cells preferentially associate with and intravasate at TMEM doorways.
a Still image from Supplementary Movie 13 of SORE6>GFP xenograft MDA-MB-231 tumor in Rag2KO mice, showing CSCs (yellow: tdTomato volume markeru2009+u2009SORE6-GFP or green: SORE6-GFP only) enriched in...
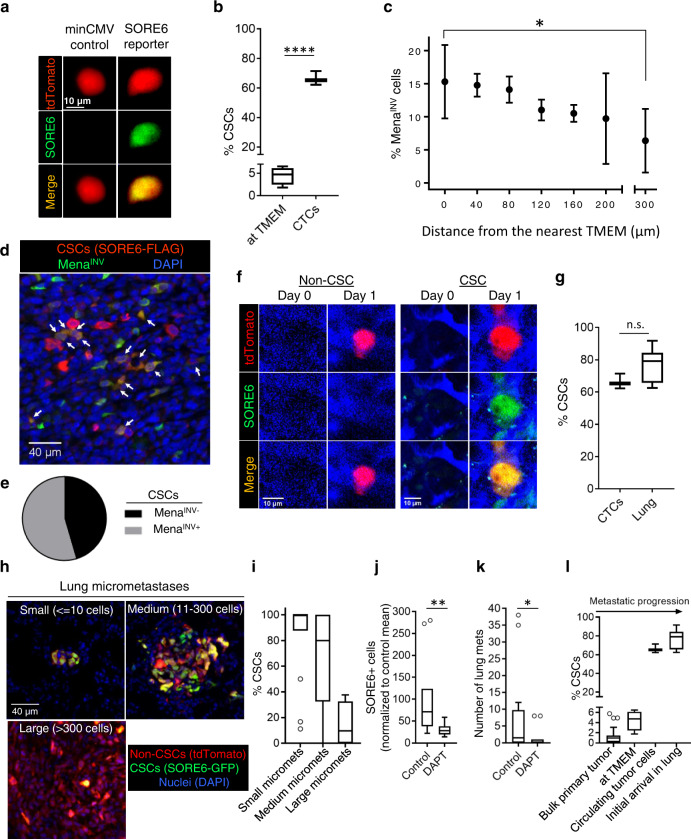
Fig. 7
CSCs are highly enriched in circulation and at their first arrival in the lung, where they seed new micro-metastases.
a CSCs are found in CTCs collected from the mice imaged in Fig. 6i . Images of stem cell (top panelsu2014tdTomato red, middle panelsu2014SORE6-GFP, green) collected from blood. b Quantification of % C...
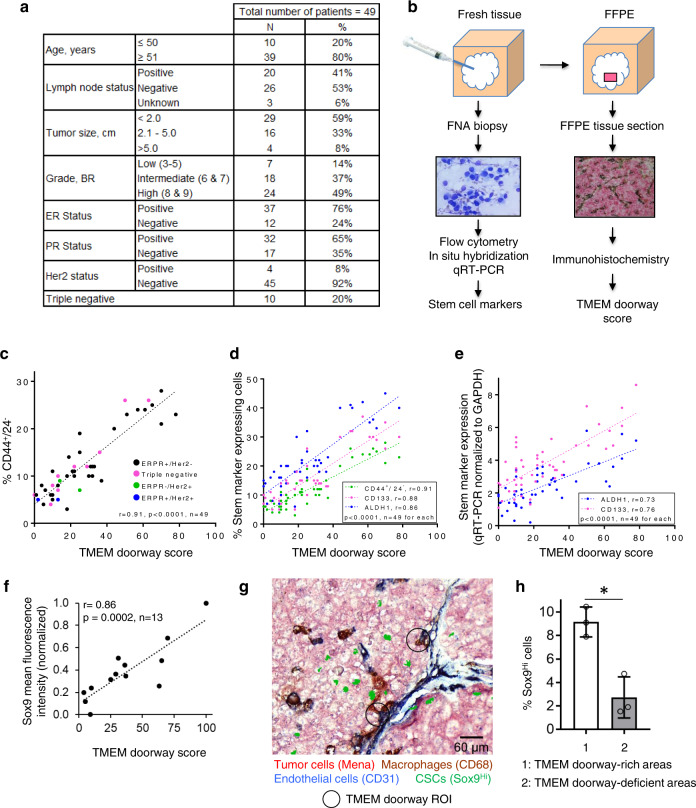
Fig. 8
Correlation of TMEM density with the proportion of tumor cells expressing stem cell markers in breast cancer tissues from patients.
a Clinical and pathological characteristic of the 49 breast cancer cases included in the analysis. b A schematic of tissue collection procedure for the correlation of TMEM doorway score with the propo...
Figure images are served from the NIH/NLM PubMed Central Open Access Subset or Europe PMC; copyright remains with the publishers and authors.
💬 Discussion
0 commentsNo comments yet. Be the first to start a discussion!
Leave a Comment