Abstract
Cryo-electron tomography (cryo-ET) is emerging as a revolutionary method for resolving the structure of macromolecular complexes in situ. However, sample preparation for in situ Cryo-ET is labour-intensive and can require both cryo-lamella preparation through cryo-focused ion beam (FIB) milling and correlative light microscopy to ensure that the event of interest is present in the lamella. Here, we present an integrated cryo-FIB and light microscope setup called the Photon Ion Electron microscope (PIE-scope) that enables direct and rapid isolation of cellular regions containing protein complexes of interest. Specifically, we demonstrate the versatility of PIE-scope by preparing targeted cryo-lamellae from subcellular compartments of neurons from transgenic Caenorhabditis elegans and Drosophila melanogaster expressing fluorescent proteins. We designed PIE-scope to enable retrofitting of existing microscopes, which will increase the throughput and accuracy on projects requiring correlative microscopy to target protein complexes. This new approach will make cryo-correlative workflow safer and more accessible.
🔬 Techniques
🧬 Organisms
✨ Fluorophores
🧪 Sample Preparation
🔬 Cell Lines
🏭 Microscope Brands
🧪 Reagent Suppliers
💻 Software Details
💻 Code & Software
💾 Data Repositories
🏛️ Research Organizations (ROR)
Affiliated research institutions:
📋 Methods
The PIE-Scope setup The illumination source is a four wavelength combiner with a single multimode fibre output (Toptica iCLE-50 405, 488, 561, 640 nm). The choice between a multi-band-pass dichroic (Chroma 89402 m) and a Thorlabs 10/90 (R/T) beam splitter allows for fluorescence or reflected light imaging. The maximum laser power used during imaging corresponded to 0.5 mW out of the fibre, which was further reduced to 0.2 mW at the back-focal plane of the objective, although there might be occasions where more laser power is required for imaging, we noted that these conditions have provided sufficient illumination on all tested samples. Currently, the camera used is a Basler acA1920-155um with USB3.0 interface. This camera is a heated CMOS detector with a quantum efficiency in the visible range of ~70%, it represents a cost-effective solution which comes with a dark noise of 6.6 e - . The major advantage of this component, beside its price, is that it does not require active cooling, making the system less susceptible to vibrations. If single-molecule imaging is required, or if the fluorescence signal is extremely dim, then cooled CMOS cameras such as the Hamamatsu Flash4.0 V3 should be used. In this case, in order to ensure that no vibration is introduced in the system, the camera cooling lines should be connected to the FIB/SEM water chiller. The feedthrough from the atmosphere to the high-vacuum is realised through a glass window (Thorlabs VPCH42-A). The optical path is steered using three axes mirror holders embedded in the custom build microscope body/flange visible in Figure 2a . The focus drive is a high-vacuum-compatible piezoelectric linear positioner (Smaract SLC-2445HV). The objectives tested were Olympus MPLFNL 10x/0.3, MPLFNL 20x/0.45, UPFLN 20x/0.8 and MPLAPON 50x/0.95. The microscope body and the adapters were machined at the Monash University Mechanical and Aerospace Engineering Workshop. All atmosphere parts were made of Aluminium alloy 7075. All vacuum parts were machined from Stainless Steel 316 l. Mounting of the microscope body on the vacuum chamber of the FIB/SEM occurs directly on the middle front GIS port (GIS2 on ThermoFisher instruments). The only strict requirement of this design is that neither a gas injection system (GIS) nor detector can be mounted on the front GIS ports at the FIB side of the chamber, we resolved this issue by repositioning our GISs from the flanges GIS1 and GIS2 to the rear flanges (GIS4 and GIS5). Although this can be a limitation for highly equipped material science microscopes, on systems where biological imaging and lamella cryo-preparation is the major focus this will not result in a problem. Also, with the advent of multi-line-GISs offered by most instrument manufacturers, it is extremely unlikely that all GIS flanges will be required. All custom components were designed using Autodesk Inventor Pro 2016 and Siemens NX. Parts were fabricated in the Mechanical and Aerospace engineering mechanical workshop at Monash University. Ray tracing was performed using Zemax OpticsStudio. The control software has been developed using National Instruments LabVIEW 2015, Python three with Numpy 1.15, Scipy 1.1.0 and ThermoFisher AutoScript 4.0. All drawings, latest Bill of Material (matched to the stable software released), a stable software release, list of dependencies and instructions are available at https://www.demarco-lab.com/resources . Sample preparation All Caenorhabditis elegans strain RJP3088 (Pets-5::mCherry +Pelt-2::GFP) ( Juozaityte et al., 2017 ) was maintained at 20°C on NGM plates seeded with Escherichia coli OP50 bacteria (Porta-de-la-Riva, Fontrodona et al.). Isolation of L1 larvae was performed as previously described ( Porta-de-la-Riva et al., 2012 ). Larvae were deposited on a holey carbon EM-grid and plunge-frozen in liquid ethane. C. elegans samples were kept in M9 medium, concentrated to a density of 3–4 worms / µL. 5 µL of solution were deposited on a Cu-300-mesh Quantifoil R-2/2 grid which was glow discharged for 30 s using a Pelco EasyGlow. The excess of medium was manually blotted using Whatman filter paper grade 595 (Merck) and vitrified by plunge freezing in liquid ethane. Drosophila melanogaster used were a cross between Engrailed-Gal4 (BL30564) and UAS-eGFP (BL6874) from the Bloomington Drosophila Stock Center (Indiana). Flies were raised on standard media at 25°C. Drosophila brains at the third instar larval stage were dissected in cold phosphate buffered saline before being mounted in 20% (w/v) dextran solution prior vitrification. Samples were high-pressure frozen using a Leica EM-PACT2 on 200 µm deep planchettes. In order to expose the sample to the surface, therefore reducing the milling time required, we performed manual freeze-fracture by scraping the surface with a scalpel under liquid nitrogen. The difference in density between the dextran solution and the sample itself ensures an easy separation. Saccharomyces cerevisiae cells were cultured at overnight 30°C in 2 YPD+. Cell growth was monitored through the measurement of the optical density. Cells were harvested when the optical density reached 0.6, washed in PBS and stained using Nuclear-ID (Enzo Life Sciences). 5 µL were deposited on a Cu-300-mesh Quantifoil R-2/2 grid which was previously glow discharged for 30 s in a Pelco EasyGlow. Grids were manually blotted for 5 s using Whatman 595 blotting pads and plunge-frozen in liquid ethane.
Show full methods section
The PIE-Scope setup The illumination source is a four wavelength combiner with a single multimode fibre output (Toptica iCLE-50 405, 488, 561, 640 nm). The choice between a multi-band-pass dichroic (Chroma 89402 m) and a Thorlabs 10/90 (R/T) beam splitter allows for fluorescence or reflected light imaging. The maximum laser power used during imaging corresponded to 0.5 mW out of the fibre, which was further reduced to 0.2 mW at the back-focal plane of the objective, although there might be occasions where more laser power is required for imaging, we noted that these conditions have provided sufficient illumination on all tested samples. Currently, the camera used is a Basler acA1920-155um with USB3.0 interface. This camera is a heated CMOS detector with a quantum efficiency in the visible range of ~70%, it represents a cost-effective solution which comes with a dark noise of 6.6 e - . The major advantage of this component, beside its price, is that it does not require active cooling, making the system less susceptible to vibrations. If single-molecule imaging is required, or if the fluorescence signal is extremely dim, then cooled CMOS cameras such as the Hamamatsu Flash4.0 V3 should be used. In this case, in order to ensure that no vibration is introduced in the system, the camera cooling lines should be connected to the FIB/SEM water chiller. The feedthrough from the atmosphere to the high-vacuum is realised through a glass window (Thorlabs VPCH42-A). The optical path is steered using three axes mirror holders embedded in the custom build microscope body/flange visible in Figure 2a . The focus drive is a high-vacuum-compatible piezoelectric linear positioner (Smaract SLC-2445HV). The objectives tested were Olympus MPLFNL 10x/0.3, MPLFNL 20x/0.45, UPFLN 20x/0.8 and MPLAPON 50x/0.95. The microscope body and the adapters were machined at the Monash University Mechanical and Aerospace Engineering Workshop. All atmosphere parts were made of Aluminium alloy 7075. All vacuum parts were machined from Stainless Steel 316 l. Mounting of the microscope body on the vacuum chamber of the FIB/SEM occurs directly on the middle front GIS port (GIS2 on ThermoFisher instruments). The only strict requirement of this design is that neither a gas injection system (GIS) nor detector can be mounted on the front GIS ports at the FIB side of the chamber, we resolved this issue by repositioning our GISs from the flanges GIS1 and GIS2 to the rear flanges (GIS4 and GIS5). Although this can be a limitation for highly equipped material science microscopes, on systems where biological imaging and lamella cryo-preparation is the major focus this will not result in a problem. Also, with the advent of multi-line-GISs offered by most instrument manufacturers, it is extremely unlikely that all GIS flanges will be required. All custom components were designed using Autodesk Inventor Pro 2016 and Siemens NX. Parts were fabricated in the Mechanical and Aerospace engineering mechanical workshop at Monash University. Ray tracing was performed using Zemax OpticsStudio. The control software has been developed using National Instruments LabVIEW 2015, Python three with Numpy 1.15, Scipy 1.1.0 and ThermoFisher AutoScript 4.0. All drawings, latest Bill of Material (matched to the stable software released), a stable software release, list of dependencies and instructions are available at https://www.demarco-lab.com/resources . Sample preparation All Caenorhabditis elegans strain RJP3088 (Pets-5::mCherry +Pelt-2::GFP) ( Juozaityte et al., 2017 ) was maintained at 20°C on NGM plates seeded with Escherichia coli OP50 bacteria (Porta-de-la-Riva, Fontrodona et al.). Isolation of L1 larvae was performed as previously described ( Porta-de-la-Riva et al., 2012 ). Larvae were deposited on a holey carbon EM-grid and plunge-frozen in liquid ethane. C. elegans samples were kept in M9 medium, concentrated to a density of 3–4 worms / µL. 5 µL of solution were deposited on a Cu-300-mesh Quantifoil R-2/2 grid which was glow discharged for 30 s using a Pelco EasyGlow. The excess of medium was manually blotted using Whatman filter paper grade 595 (Merck) and vitrified by plunge freezing in liquid ethane. Drosophila melanogaster used were a cross between Engrailed-Gal4 (BL30564) and UAS-eGFP (BL6874) from the Bloomington Drosophila Stock Center (Indiana). Flies were raised on standard media at 25°C. Drosophila brains at the third instar larval stage were dissected in cold phosphate buffered saline before being mounted in 20% (w/v) dextran solution prior vitrification. Samples were high-pressure frozen using a Leica EM-PACT2 on 200 µm deep planchettes. In order to expose the sample to the surface, therefore reducing the milling time required, we performed manual freeze-fracture by scraping the surface with a scalpel under liquid nitrogen. The difference in density between the dextran solution and the sample itself ensures an easy separation. Saccharomyces cerevisiae cells were cultured at overnight 30°C in 2 YPD+. Cell growth was monitored through the measurement of the optical density. Cells were harvested when the optical density reached 0.6, washed in PBS and stained using Nuclear-ID (Enzo Life Sciences). 5 µL were deposited on a Cu-300-mesh Quantifoil R-2/2 grid which was previously glow discharged for 30 s in a Pelco EasyGlow. Grids were manually blotted for 5 s using Whatman 595 blotting pads and plunge-frozen in liquid ethane.
Additional files 10.7554/eLife.45919.011 Transparent reporting form
📊 Figures
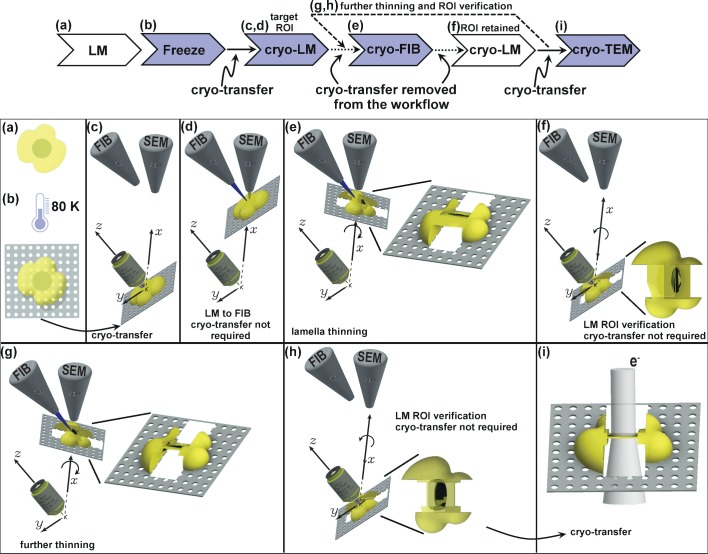
Figure 1.
Schematic presentation of the workflow.
( a ) Live cell imaging. ( b ) Plunge or high-pressure freezing of the sample for cryo-preservation (note, cells can be either cultured on the grid in ( a ) or in case of suspension be added onto the ...
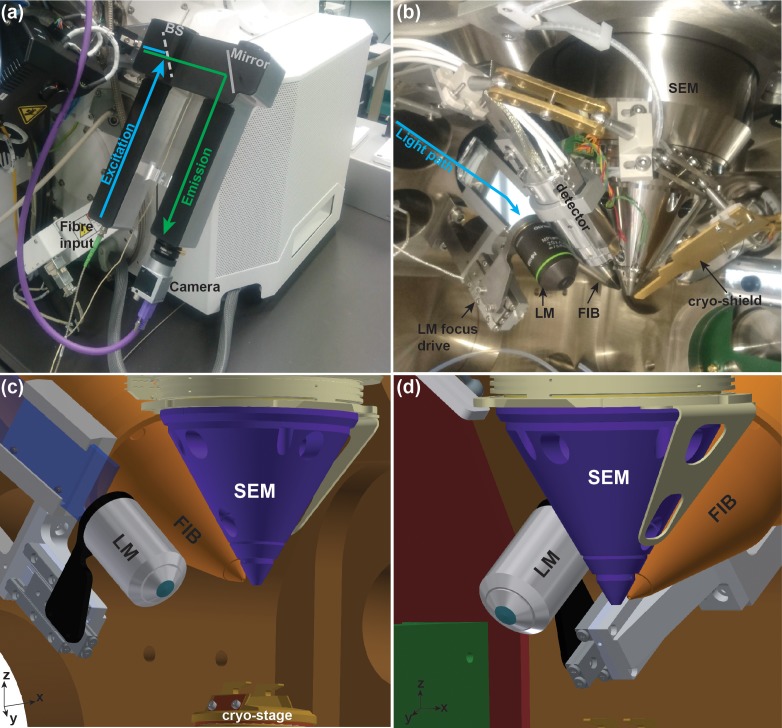
Figure 2.
Integrated cryo-FIB and light microscope setup (PIE-scope).
( a ) Outside view of the PIE-scope. The atmospheric (external) retrofitted component consisting of one excitation and one emission arms. The camera at the end of the emission arm can be replaced. The...
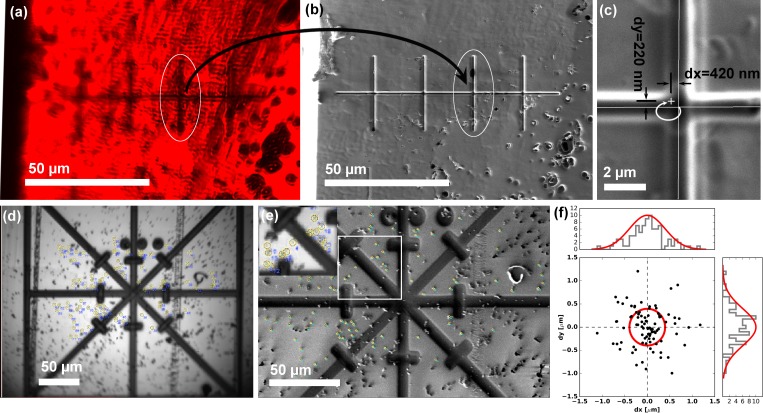
Figure 3.
Translation and correlation precision of the integrated PIE-scope.
( a,b ) Optical ( a ) and FIB ( b ) image of the same sample region, containing a series of pre-milled test patterns (crosses). After the stage translation calibration and targeting steps one can sele...
Video 1.
PIE-scope operation.
This video provides an overview of the capabilities provided by PIE-scope and provides an overview of its capabilities.
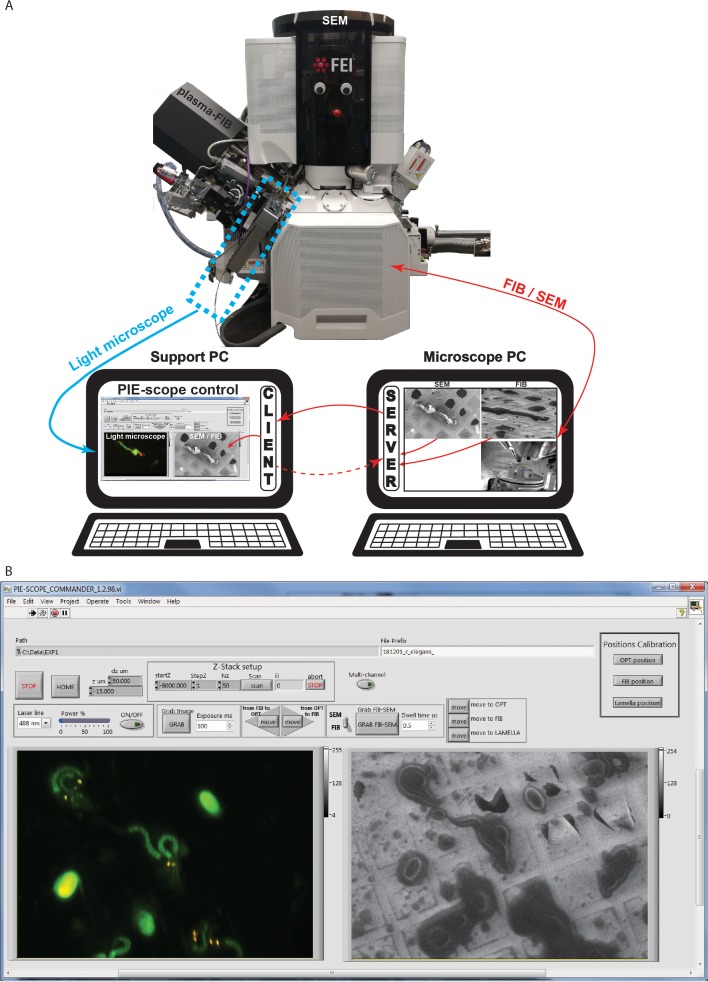
Figure 4.
PIE-Scope commander, a CLEM-friendly interface.
( a ) A scheme of the communication setup. Here the microscope computer controls the FIB/SEM and runs the python control server. On the support computer, we run a python client (ThermoFisher Autoscrip...
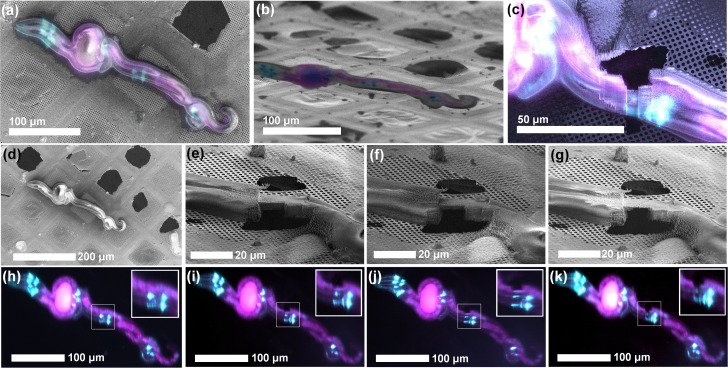
Figure 5.
ROI identification, targeting and cryo-lamella preparation in C. elegans larvae.
( a ) Correlation between the SEM (top view) and fluorescence microscopy images. ( b ) Correlation between the FIB and fluorescence microscopy images. The sample is tilted into the lamella preparation...
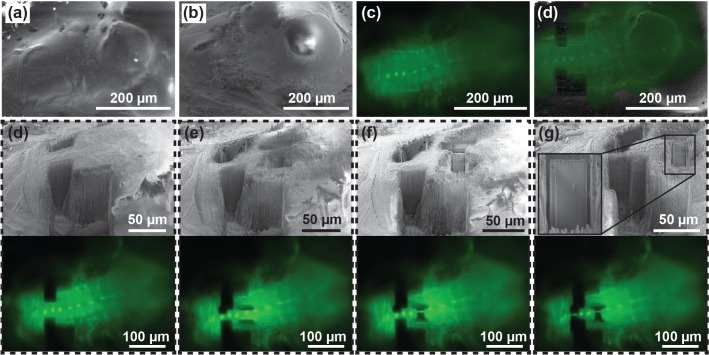
Figure 6.
Targeted lamella preparation in a bulk cryo-sample (larval D.u00a0melanogaster brain expressing EGFP in interneurons).
( a, b, c ) Initial FIB ( a ), SEM ( b ) and LM ( c ) images. ( d ) Milling of straight edges in the sample allows improved precision of correlation between images acquired in different modalities. He...
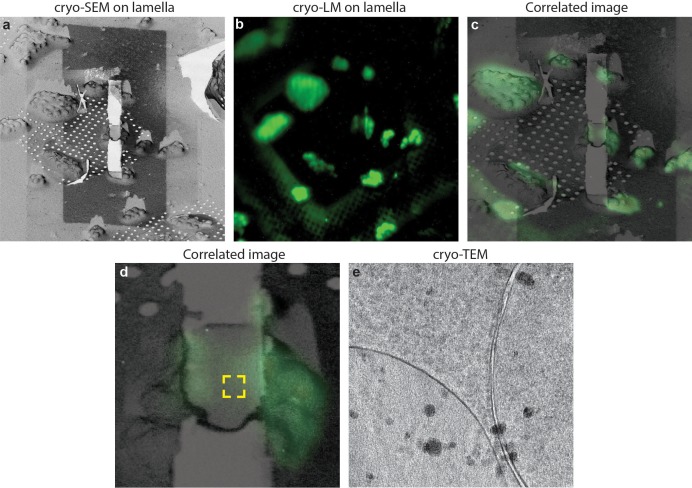
Figure 7.
Cryo-correlative microscopy on fluorescent yeast cells.
( au2013b ) S. cerevisiae cells were labelled with nucleolar staining, lamellas were prepared and then imaged using cryo-fluorescence microscopy. ( c ) Correlated image between the SEM and LM images, ...
Video 2.
Cryo-electron tomogram on a lamella after fluorescence imaging.
The region imaged on this tomogram correspond to the one visible in Figure 7d . no de-vitrification is visible as a result of LM imaging.
Figure images are served from the NIH/NLM PubMed Central Open Access Subset or Europe PMC; copyright remains with the publishers and authors.
💬 Discussion
0 commentsNo comments yet. Be the first to start a discussion!
Leave a Comment