Abstract
AbstractRespiratory complex I (NADH:ubiquinone oxidoreductase) captures the free energy from oxidising NADH and reducing ubiquinone to drive protons across the mitochondrial inner membrane and power oxidative phosphorylation. Recent cryo-EM analyses have produced near-complete models of the mammalian complex, but leave the molecular principles of its long-range energy coupling mechanism open to debate. Here, we describe the 3.0-Å resolution cryo-EM structure of complex I from mouse heart mitochondria with a substrate-like inhibitor, piericidin A, bound in the ubiquinone-binding active site. We combine our structural analyses with both functional and computational studies to demonstrate competitive inhibitor binding poses and provide evidence that two inhibitor molecules bind end-to-end in the long substrate binding channel. Our findings reveal information about the mechanisms of inhibition and substrate reduction that are central for understanding the principles of energy transduction in mammalian complex I.
🔬 Techniques
🧬 Organisms
💻 Software
🧪 Sample Preparation
🏭 Microscope Brands
🧪 Reagent Suppliers
📷 Detectors
💻 Software Details
💾 Data Repositories
🏛️ Research Organizations (ROR)
Affiliated research institutions:
📋 Methods
Preparation of mouse complex I inhibited by piericidin for cryoEM
Piericidin-inhibited mouse complex I was prepared by adapting the method of Agip and coworkers for mouse complex I 4 . Six-week old C57BL/6 female mice were sacrificed by cervical dislocation in accordance with the UK Animals (Scientific Procedures) Act, 1986 (PPL: 70/7538, approved by the local ethics committees of the MRC Laboratory of Molecular Biology and the University of Cambridge and by the UK Home Office) and the University of Cambridge Animal Welfare Policy. Hearts were excised, immersed in ice-cold solution containing 10 mM Tris-HCl (pH 7.4 at 4 °C), 75 mM sucrose, 225 mM sorbitol, 1 mM EGTA and 0.1% (w/v) fatty acid-free bovine serum albumin (Sigma-Aldrich), then cut into 1-mm pieces and washed. The tissue was homogenised (10 mL buffer per gram tissue) by seven to ten strokes of a Potter–Elvehjem homogeniser fitted with a Teflon pestle at ~1000 r.p.m then the homogenate was centrifuged (1000 × g , 5 min), and the supernatant recentrifuged (9000 × g , 10 min) to collect the crude mitochondria. The mitochondria were washed several times by resuspension and centrifugation and then collected by centrifugation at 15,000 × g for 2 min, resuspended in 20 mM Tris-HCl (pH 7.4 at 4 °C), 1 mM EDTA and 10% (v/v) glycerol to 10–20 mg protein mL −1 and frozen for storage. After thawing they were diluted to 5 mg protein mL −1 , then ruptured by three 5 s bursts of sonication (with 30 s intervals on ice) using a Q700 Sonicator (Qsonica) at 65% amplitude setting and the membranes were collected by centrifugation (75,000 × g , 1 h), resuspended to 5 mg protein mL −1 and frozen for storage. Starting from 16 mg membrane protein, the membranes were solubilized by addition of 1% n -dodecyl β- d -maltoside (DDM, Glycon), stirred for 30 min on ice, and centrifuged (48,000× g , 30 min). The supernatant was loaded onto a 1 mL Hi-Trap Q HP anion exchange column (GE Healthcare) pre-equilibrated with buffer A (20 mM Tris-HCl (pH 7.14 at 20 °C), 1 mM EDTA, 0.1% DDM, 10% (v/v) ethylene glycol, 0.005% asolectin (Avanti) and 0.005% CHAPS (Calbiochem)). The column was washed at 0.3 mL min −1 with buffer A for 2 min, then with 20% buffer B (buffer A + 1 M NaCl) for 7 min, and then complex I was eluted in 35% buffer B for 10 min 4 . Complex I-containing fractions were pooled and concentrated to 100 μL using a 50 kDa MWCO spin column (Sartorius) and the following were then added: 200 μM NADH, 6 μM decylubiquinone (DQ), 0.15% asolectin (20% soy PC, Avanti) and 0.15% CHAPS (Calbiochem) to drive complex I catalysis; 150 μg mL −1 alcohol dehydrogenase from Saccharomyces cerevisiae (Sigma) and 1% ethanol to regenerate the NADH from NAD + ; 100 μg mL −1 alternative oxidase from Trypanosoma brucei brucei (AOX 8 ) to regenerate the ubiquinone from ubiquinol; 10 KU mL −1 catalase from Corynebacterium glutamicum (Sigma) and 400 U mL −1 superoxide dismutase from bovine erythrocytes (Sigma) to minimise oxidative damage. After ~5 min at 4 °C, 15 μL of the mixture was removed as a control, and the remaining sample added to a glass vial containing sufficient piericidin A (dried from an ethanolic stock solution to avoid addition of solvent) to give 200 μM. Then, each sample was applied to a Superose 6 Increase 5/150 column (GE Healthcare) and eluted in 20 mM Tris-Cl (pH 7.14 at 20 °C), 150 mM NaCl and 0.05% DDM 4 . The concentration of the peak piericidin-bound fraction (at ∼1.65 mL) was estimated as 4.1 mg mL −1 using a nanodrop UV–vis spectrophotometer ( ε 280 = 0.2 (mg mL −1 ) −1 ). It was found to be 88.7 ± 3.4% inhibited by comparing initial rates of catalysis by the control and inhibited samples in 20 mM Tris-HCl (pH 7.5 at 20 °C), 0.012% asolectin and 0.012% CHAPS, using 5 μM DQ and 10 μg mL −1 AOX, with catalysis initiated by 200 μM NADH and monitored at 340–380 nm ( ε = 4.81 mM −1 cm −1 ). The low DQ concentration was used to minimise competition with the piericidin. The specific activity of the control (measured in 0.075% asolectin, 0.075% CHAPS and 100 μM DQ) was 11.3 ± 0.6 μmol min −1 mg −1 . CryoEM grid preparation, data acquisition, and processing UltrAuFoil® gold grids (0.6/1, Quantifoil Micro Tools GmbH) were glow discharged (20 mA, 60 s), incubated in a solution of 5 mM 11-mercaptoundecyl hexaethyleneglycol (SPT-0011P6, SensoPath Technologies) in ethanol for 2 days in an anaerobic glovebox, then washed with ethanol and air-dried just before use 11 . Using an FEI Vitrobot Mark IV, 2.5 μL of complex I solution (3–5 mg mL −1 ) was applied to each grid at 4 °C in 100% relative humidity and blotted for 10–12 s at force setting –10, before the grid was frozen by plunging it into liquid ethane. Grids for the piericidin-K2 dataset were imaged using a Gatan K2 detector and GIF Quantum energy filter mounted on an FEI 300 keV Titan Krios microscope with a 100 μm objective aperture and EPU-1.9 software at the UK National Electron Bio-Imaging Centre (eBIC) at Diamond. The energy filter was operated in zero-energy-loss mode with a slit width of 20 eV. Data were imaged at 1.05 Å pixel −1 (magnification 47,600×) with a defocus range −2.2 to −3.4 μm and the autofocus routine run every 10 μm. The dose rate was 5 electrons Å −2 s −1 with 10 s exposures captured in 25 frames (total dose ~50 electrons Å −2 ). Grids for the piericidin-FIII dataset were imaged using a Falcon III detector on an FEI 300 keV Titan Krios microscope with a 100 μm objective aperture and EPU-1.9 at the Astbury Centre for Structural Molecular Biology, University of Leeds. The detector was operated in counting mode and data were imaged at 1.06 Å pixel −1 (magnification 130,000×) with a defocus range −2.2 to −3.8 μm and the autofocus routine run every 10 μm. The dose rate was 0.64 electrons Å −2 s −1 with 71.5 s exposures captured in 40 frames (total dose 46 electrons Å −2 ). All data were processed first using RELION-2.1-patchb1 47 . First, beam-induced movement was corrected for using MotionCor2 48 , both with and without dose weighting. CFT estimations were taken from nondose weighted micrographs using GCTF-1.06 49 . Following autopicking and manual curation 60,107 particles were extracted from 1200 K2 micrographs and 76,802 particles from 1454 Falcon III micrographs. The particles were extracted from dose-weighted micrographs and CTF corrected with an amplitude contrast of 0.1 for 2D classification, then CTF parameters were re-estimated with an amplitude contrast of 0.08 thereafter. For the K2 dataset, frames 1–12 were used for movie refinement (total dose 24 electrons Å −2 ) with a running average window of 3, and polished to account for movement and radiation damage using a single frame average for B-factor estimation. For the Falcon III dataset, frames 122 were used with a total dose of 25 electrons Å −2 , with a running average window of 5 and polished using a 3-frame average for B-factor estimation. The particles were then subjected to 3D classification into five classes with angular sampling gradually incremented to 0.9°. For the K2 dataset, the major class containing 27,193 particles was taken forward to the final 3D refinement with solvent flattened FSC curves. For the Falcon III dataset, two classes containing similar numbers of particles at the same resolution were selected and combined in a single class of 36,759 particles for refinement. Subsequently, both datasets plus the previously-described data for the active state of mouse complex I 4 were re-analysed using RELION-3.0. Beam-induced movement was re-analysed using the in-built version of MotionCor2 and the final particles were re-extracted in RELION-3.0, refined, and subjected to Bayesian polishing and CTF refinement, including beam tilt and per-particle astigmatism correction, before the final refinement with solvent flattened FSC curves 50 . 12 frames were used for both K2 datasets, and all 40 frames for the Falcon III dataset. All three maps were post-processed using default parameters using a mask created with the mask creation tool in RELION, and a soft edge of 5, starting from a Molmap command on a pdb model of the piericidin-inhibited enzyme in UCSF Chimera-1.13.1 51 . Map resolution estimates are based on the FSC = 0.143 criterion 52 . Pixel sizes were adjusted to three decimal places; the scaling was determined by using the Chimera “fit in map” command to maximise the correlation between the maps. Example micrographs and 2D classes for all three datasets are shown in Supplementary Fig 2 and local resolution estimates, particle orientation distributions and FSC curves are shown in Supplementary Fig 3 . Model building, refinement, and validation The model for the active mouse (6G2J.PDB 4 ) was fitted into the piericidin-K2 map using Chimera 51 , then refined against the RELION-sharpened piericidin-K2 map by cycles of manual adjustment in Coot-0.8.9.1/0.9-pre 53 and real-space refinement in Phenix-1.13-2998 or 1.16-3549 54 with secondary structure restraints. Model building in poorly resolved areas was aided by the unsharpened map and a blurred map. The piericidin A molecule was imported from ChemSpider and restraints generated using AceDRG 55 . The piericidin-K2 final model was then fitted into the active map using Chimera; the piericidin was removed, the B-factors reset to 20, and the model refinement and inspection carried out as above. Model-to-map FSC curves were generated by simulating a map from the model at Nyquist frequency created with Molmap in Chimera 51 . The created map was compared to a masked unfiltered, unsharpened experimental map from RELION using the Xmipp tool in SCIPION-1.2 56 . Final model statistics were produced by Phenix-1.16-3549, MolProbity-4.4 57 (Supplementary Table 1 ) and EMRinger 58 (scores 3.77 for piericidin K2, 3.33 for active, and 3.06 for the piericidin-K2 model in the piericidin-FIII map). Finally, each model was checked for overfitting by first “shaking” it using Phenix simple dynamics and resetting its B-factors to 20, then refining it against an unsharpened half map filtered to the FSC = 0.143 resolution of the combined map, and comparing the model-to-map FSC curves against each unfiltered, masked half map. Local resolution maps were produced in RELION-3.0 and visualised in Chimera. Small changes to the model (Supplementary Table 1 ), relative to PDB ID: 6G2J include: identification of a cis -proline, present in high resolution structures of the homologous NiFe hydrogenase enzymes such as from Ralstonia eutropha (PDB ID: 4IUC) 59 , next to cluster N2 (NDUFS7 Pro160); replacement of the ADP bound to NDUFA10 with ATP, with π-stacking between its adenine ring and nearby Phe134; replacement of two PE molecules (M505 and M506 from 6G2J) by a single cardiolipin (N501); improvements to poorly resolved areas such as the N-terminal loops of subunits NDUFS2, NDUFA13, NDUFB7, and NDUFB10.
Show full methods section
Preparation of mouse complex I inhibited by piericidin for cryoEM
Piericidin-inhibited mouse complex I was prepared by adapting the method of Agip and coworkers for mouse complex I 4 . Six-week old C57BL/6 female mice were sacrificed by cervical dislocation in accordance with the UK Animals (Scientific Procedures) Act, 1986 (PPL: 70/7538, approved by the local ethics committees of the MRC Laboratory of Molecular Biology and the University of Cambridge and by the UK Home Office) and the University of Cambridge Animal Welfare Policy. Hearts were excised, immersed in ice-cold solution containing 10 mM Tris-HCl (pH 7.4 at 4 °C), 75 mM sucrose, 225 mM sorbitol, 1 mM EGTA and 0.1% (w/v) fatty acid-free bovine serum albumin (Sigma-Aldrich), then cut into 1-mm pieces and washed. The tissue was homogenised (10 mL buffer per gram tissue) by seven to ten strokes of a Potter–Elvehjem homogeniser fitted with a Teflon pestle at ~1000 r.p.m then the homogenate was centrifuged (1000 × g , 5 min), and the supernatant recentrifuged (9000 × g , 10 min) to collect the crude mitochondria. The mitochondria were washed several times by resuspension and centrifugation and then collected by centrifugation at 15,000 × g for 2 min, resuspended in 20 mM Tris-HCl (pH 7.4 at 4 °C), 1 mM EDTA and 10% (v/v) glycerol to 10–20 mg protein mL −1 and frozen for storage. After thawing they were diluted to 5 mg protein mL −1 , then ruptured by three 5 s bursts of sonication (with 30 s intervals on ice) using a Q700 Sonicator (Qsonica) at 65% amplitude setting and the membranes were collected by centrifugation (75,000 × g , 1 h), resuspended to 5 mg protein mL −1 and frozen for storage. Starting from 16 mg membrane protein, the membranes were solubilized by addition of 1% n -dodecyl β- d -maltoside (DDM, Glycon), stirred for 30 min on ice, and centrifuged (48,000× g , 30 min). The supernatant was loaded onto a 1 mL Hi-Trap Q HP anion exchange column (GE Healthcare) pre-equilibrated with buffer A (20 mM Tris-HCl (pH 7.14 at 20 °C), 1 mM EDTA, 0.1% DDM, 10% (v/v) ethylene glycol, 0.005% asolectin (Avanti) and 0.005% CHAPS (Calbiochem)). The column was washed at 0.3 mL min −1 with buffer A for 2 min, then with 20% buffer B (buffer A + 1 M NaCl) for 7 min, and then complex I was eluted in 35% buffer B for 10 min 4 . Complex I-containing fractions were pooled and concentrated to 100 μL using a 50 kDa MWCO spin column (Sartorius) and the following were then added: 200 μM NADH, 6 μM decylubiquinone (DQ), 0.15% asolectin (20% soy PC, Avanti) and 0.15% CHAPS (Calbiochem) to drive complex I catalysis; 150 μg mL −1 alcohol dehydrogenase from Saccharomyces cerevisiae (Sigma) and 1% ethanol to regenerate the NADH from NAD + ; 100 μg mL −1 alternative oxidase from Trypanosoma brucei brucei (AOX 8 ) to regenerate the ubiquinone from ubiquinol; 10 KU mL −1 catalase from Corynebacterium glutamicum (Sigma) and 400 U mL −1 superoxide dismutase from bovine erythrocytes (Sigma) to minimise oxidative damage. After ~5 min at 4 °C, 15 μL of the mixture was removed as a control, and the remaining sample added to a glass vial containing sufficient piericidin A (dried from an ethanolic stock solution to avoid addition of solvent) to give 200 μM. Then, each sample was applied to a Superose 6 Increase 5/150 column (GE Healthcare) and eluted in 20 mM Tris-Cl (pH 7.14 at 20 °C), 150 mM NaCl and 0.05% DDM 4 . The concentration of the peak piericidin-bound fraction (at ∼1.65 mL) was estimated as 4.1 mg mL −1 using a nanodrop UV–vis spectrophotometer ( ε 280 = 0.2 (mg mL −1 ) −1 ). It was found to be 88.7 ± 3.4% inhibited by comparing initial rates of catalysis by the control and inhibited samples in 20 mM Tris-HCl (pH 7.5 at 20 °C), 0.012% asolectin and 0.012% CHAPS, using 5 μM DQ and 10 μg mL −1 AOX, with catalysis initiated by 200 μM NADH and monitored at 340–380 nm ( ε = 4.81 mM −1 cm −1 ). The low DQ concentration was used to minimise competition with the piericidin. The specific activity of the control (measured in 0.075% asolectin, 0.075% CHAPS and 100 μM DQ) was 11.3 ± 0.6 μmol min −1 mg −1 . CryoEM grid preparation, data acquisition, and processing UltrAuFoil® gold grids (0.6/1, Quantifoil Micro Tools GmbH) were glow discharged (20 mA, 60 s), incubated in a solution of 5 mM 11-mercaptoundecyl hexaethyleneglycol (SPT-0011P6, SensoPath Technologies) in ethanol for 2 days in an anaerobic glovebox, then washed with ethanol and air-dried just before use 11 . Using an FEI Vitrobot Mark IV, 2.5 μL of complex I solution (3–5 mg mL −1 ) was applied to each grid at 4 °C in 100% relative humidity and blotted for 10–12 s at force setting –10, before the grid was frozen by plunging it into liquid ethane. Grids for the piericidin-K2 dataset were imaged using a Gatan K2 detector and GIF Quantum energy filter mounted on an FEI 300 keV Titan Krios microscope with a 100 μm objective aperture and EPU-1.9 software at the UK National Electron Bio-Imaging Centre (eBIC) at Diamond. The energy filter was operated in zero-energy-loss mode with a slit width of 20 eV. Data were imaged at 1.05 Å pixel −1 (magnification 47,600×) with a defocus range −2.2 to −3.4 μm and the autofocus routine run every 10 μm. The dose rate was 5 electrons Å −2 s −1 with 10 s exposures captured in 25 frames (total dose ~50 electrons Å −2 ). Grids for the piericidin-FIII dataset were imaged using a Falcon III detector on an FEI 300 keV Titan Krios microscope with a 100 μm objective aperture and EPU-1.9 at the Astbury Centre for Structural Molecular Biology, University of Leeds. The detector was operated in counting mode and data were imaged at 1.06 Å pixel −1 (magnification 130,000×) with a defocus range −2.2 to −3.8 μm and the autofocus routine run every 10 μm. The dose rate was 0.64 electrons Å −2 s −1 with 71.5 s exposures captured in 40 frames (total dose 46 electrons Å −2 ). All data were processed first using RELION-2.1-patchb1 47 . First, beam-induced movement was corrected for using MotionCor2 48 , both with and without dose weighting. CFT estimations were taken from nondose weighted micrographs using GCTF-1.06 49 . Following autopicking and manual curation 60,107 particles were extracted from 1200 K2 micrographs and 76,802 particles from 1454 Falcon III micrographs. The particles were extracted from dose-weighted micrographs and CTF corrected with an amplitude contrast of 0.1 for 2D classification, then CTF parameters were re-estimated with an amplitude contrast of 0.08 thereafter. For the K2 dataset, frames 1–12 were used for movie refinement (total dose 24 electrons Å −2 ) with a running average window of 3, and polished to account for movement and radiation damage using a single frame average for B-factor estimation. For the Falcon III dataset, frames 122 were used with a total dose of 25 electrons Å −2 , with a running average window of 5 and polished using a 3-frame average for B-factor estimation. The particles were then subjected to 3D classification into five classes with angular sampling gradually incremented to 0.9°. For the K2 dataset, the major class containing 27,193 particles was taken forward to the final 3D refinement with solvent flattened FSC curves. For the Falcon III dataset, two classes containing similar numbers of particles at the same resolution were selected and combined in a single class of 36,759 particles for refinement. Subsequently, both datasets plus the previously-described data for the active state of mouse complex I 4 were re-analysed using RELION-3.0. Beam-induced movement was re-analysed using the in-built version of MotionCor2 and the final particles were re-extracted in RELION-3.0, refined, and subjected to Bayesian polishing and CTF refinement, including beam tilt and per-particle astigmatism correction, before the final refinement with solvent flattened FSC curves 50 . 12 frames were used for both K2 datasets, and all 40 frames for the Falcon III dataset. All three maps were post-processed using default parameters using a mask created with the mask creation tool in RELION, and a soft edge of 5, starting from a Molmap command on a pdb model of the piericidin-inhibited enzyme in UCSF Chimera-1.13.1 51 . Map resolution estimates are based on the FSC = 0.143 criterion 52 . Pixel sizes were adjusted to three decimal places; the scaling was determined by using the Chimera “fit in map” command to maximise the correlation between the maps. Example micrographs and 2D classes for all three datasets are shown in Supplementary Fig 2 and local resolution estimates, particle orientation distributions and FSC curves are shown in Supplementary Fig 3 . Model building, refinement, and validation The model for the active mouse (6G2J.PDB 4 ) was fitted into the piericidin-K2 map using Chimera 51 , then refined against the RELION-sharpened piericidin-K2 map by cycles of manual adjustment in Coot-0.8.9.1/0.9-pre 53 and real-space refinement in Phenix-1.13-2998 or 1.16-3549 54 with secondary structure restraints. Model building in poorly resolved areas was aided by the unsharpened map and a blurred map. The piericidin A molecule was imported from ChemSpider and restraints generated using AceDRG 55 . The piericidin-K2 final model was then fitted into the active map using Chimera; the piericidin was removed, the B-factors reset to 20, and the model refinement and inspection carried out as above. Model-to-map FSC curves were generated by simulating a map from the model at Nyquist frequency created with Molmap in Chimera 51 . The created map was compared to a masked unfiltered, unsharpened experimental map from RELION using the Xmipp tool in SCIPION-1.2 56 . Final model statistics were produced by Phenix-1.16-3549, MolProbity-4.4 57 (Supplementary Table 1 ) and EMRinger 58 (scores 3.77 for piericidin K2, 3.33 for active, and 3.06 for the piericidin-K2 model in the piericidin-FIII map). Finally, each model was checked for overfitting by first “shaking” it using Phenix simple dynamics and resetting its B-factors to 20, then refining it against an unsharpened half map filtered to the FSC = 0.143 resolution of the combined map, and comparing the model-to-map FSC curves against each unfiltered, masked half map. Local resolution maps were produced in RELION-3.0 and visualised in Chimera. Small changes to the model (Supplementary Table 1 ), relative to PDB ID: 6G2J include: identification of a cis -proline, present in high resolution structures of the homologous NiFe hydrogenase enzymes such as from Ralstonia eutropha (PDB ID: 4IUC) 59 , next to cluster N2 (NDUFS7 Pro160); replacement of the ADP bound to NDUFA10 with ATP, with π-stacking between its adenine ring and nearby Phe134; replacement of two PE molecules (M505 and M506 from 6G2J) by a single cardiolipin (N501); improvements to poorly resolved areas such as the N-terminal loops of subunits NDUFS2, NDUFA13, NDUFB7, and NDUFB10.
EPR measurements
Piericidin-bound bovine complex I was prepared by combining the standard method for bovine complex I 8 , 32 with the method for the piericidin-bound mouse enzyme. Starting from 70 mg membrane protein, the sample was concentrated to 500 μL after ion-exchange chromatography. Two hundred and fifty microliter (the nonturnover control) were applied immediately to a 10/300 Superose 6 Increase column; the other 250 μL were divided in two and treated like the mouse preparation to generate a 125 μL “turnover control” without piericidin and a 125 μL sample inhibited with 320 μM piericidin. Both were applied to a 5/150 Superose 6 increase column. All three resulting samples were concentrated, and ~ 8 μL per sample was placed in a 1.6 mm O.D. Suprasil quartz EPR tube and frozen immediately. Their concentrations were 18 (nonturnover), 13.9 (turnover) and 10 (piericidin-containing) mg mL −1 and the maximal activity of the nonturnover control was 16.4 ± 0.2 μmol min −1 mg −1 . All the procedures described were carried out in air (not anaerobically), to match the conditions of cryo-EM grid preparation. EPR measurements were performed using an X/Q-band Bruker Elexsys E580 spectrometer (Bruker BioSpin GmbH, Germany) equipped with a closed cycle cryostat (Cryogenic Ltd. UK) and Bruker Xepr software. Measurements were carried out at X-band (9.5 GHz) using a split-ring resonator module with 2 mm sample access (ER 4118X-MS2) 60 . The temperature and magnetic field were calibrated with an external Cernox thermometer and a Bruker strong pitch sample ( g = 2.0028) at room temperature. Acquisition times for spectra were approximately 12.5 min per sample. All spectra have been baseline-subtracted using an oxidised complex I sample.
Preparation and characterisation of proteoliposomes
Proteoliposomes were produced using complex I from bovine heart and recombinant Trypanosoma brucei brucei AOX 8 , 32 . Briefly, liposomes were formed from 8 mg phosphatidylcholine, 1 mg phosphatidylethanolamine and 1 mg cardiolipin (bovine heart extracts from Avanti Polar Lipids) together with varying amounts of Q 10 (Sigma-Aldrich) in 10 mM Tris-SO 4 (pH 7.5 at 4 °C) and 50 mM KCl. Following extrusion with a 0.1 µm track etched membrane, they were partially solubilized with 1.5% octyl-glucoside (Anatrace). AOX (0.2 mg) and then complex I (0.2 mg) were added for reconstitution. Aliquots of Biobeads (Bio-Rad) were added hourly over 4 h to remove the detergent then the proteoliposomes collected by centrifugation, resuspended, and flash frozen for storage at –80 °C. Total protein concentrations were quantified using the amido black assay, and the amount and orientation of complex I using the NADH:APAD + activity assay 8 , 32 . Total phospholipid contents were determined as follows 8 , 32 . Hundred microliter of sample or KH 2 PO 4 as standard, 50 μL of methanol and 30 μL of 390 mM Mg(NO 3 ) 2 in ethanol were heated in boiling tubes over a roaring blue flame until no further brown fumes were formed to leave a white residue. After 5 min, 0.3 mL of 500 mM HCl was added, and the tubes were lightly stoppered, incubated at 99 °C for 15 min, cooled, and then 0.7 mL of an aqueous solution of 114 mM ascorbic acid, 2.72 mM (NH 4 ) 6 Mo 7 O 24 and 400 mM H 2 SO 4 was added, and the tubes incubated at 37 °C for 1 h. The absorbances were measured at 820 nm. One milligram of phospholipid was assumed to occupy a volume of 1 μL 8 , 32 . Q 10 was quantified by HPLC. Five to ten microliter of sample were solubilised in 190 µL HPLC grade ethanol, then 50 µL loaded onto a Nucleosil 100-5C18 (Hichrom) column maintained at 30 °C on an Agilent 1100 series HPLC system. The mobile phase (run at 800 µL min −1 ) contained 70% ethanol, 30% methanol, 0.7% NaClO 4 , 0.07% HClO 4 8 with elution monitored using a Dionex Ultimate 3000 RS electrochemical detector. A conditioning electrode (6020RS omni Coulometric cell) placed before the sample injector was set to +1000 mV and the dual electrodes of the detecting Coulometric cell (6011RS Ultra Analytical cell) were set to –500 and +450 mV. The ubiquinone content was calculated from its +450 mV-peak area, by comparison to a set of standards. Ubiquinone concentrations are expressed as nmol of Q 10 per mg of phospholipids, which equates to mM concentration units. Piericidin inhibition kinetics of complex I-AOX proteoliposomes Catalytic activity assays were conducted at 32 °C in 10 mM Tris-SO 4 (pH 7.5 at 32 °C) and 50 mM KCl in 96-well plates using a Molecular Devices Spectramax 384 plus platereader with Softmax Pro 5.4.42.1. Piericidin was added in ethanol and catalysis initiated by addition of 200 µM NADH and monitored at 340 and 380 nm ( ε 340–380 = 4.81 mM −1 cm −1 ). Linear rates were measured, typically after a 100 s period of equilibration and/or activation. Inhibitor insensitive rates (recorded using 20 nM piericidin) were subtracted. The data are presented as mean values with standard deviations propagated from the quantifications of enzyme, sidedness, membrane volume, quinone content as well as the activity, which was performed in triplicate. The data were modelled using the ordinary differential equation solver, ode15s, in MATLAB (Mathworks, R2018a) with all the reverse rate constants ( k −1 , k −3 , etc.) set to 1. k 4 was set to 1000 s −1 to ensure reoxidation of ubiquinol by AOX was not rate limiting 8 . Rate calculations were terminated once they reached steady state (judged as a change in enzyme-substrate complex concentration of
📊 Figures
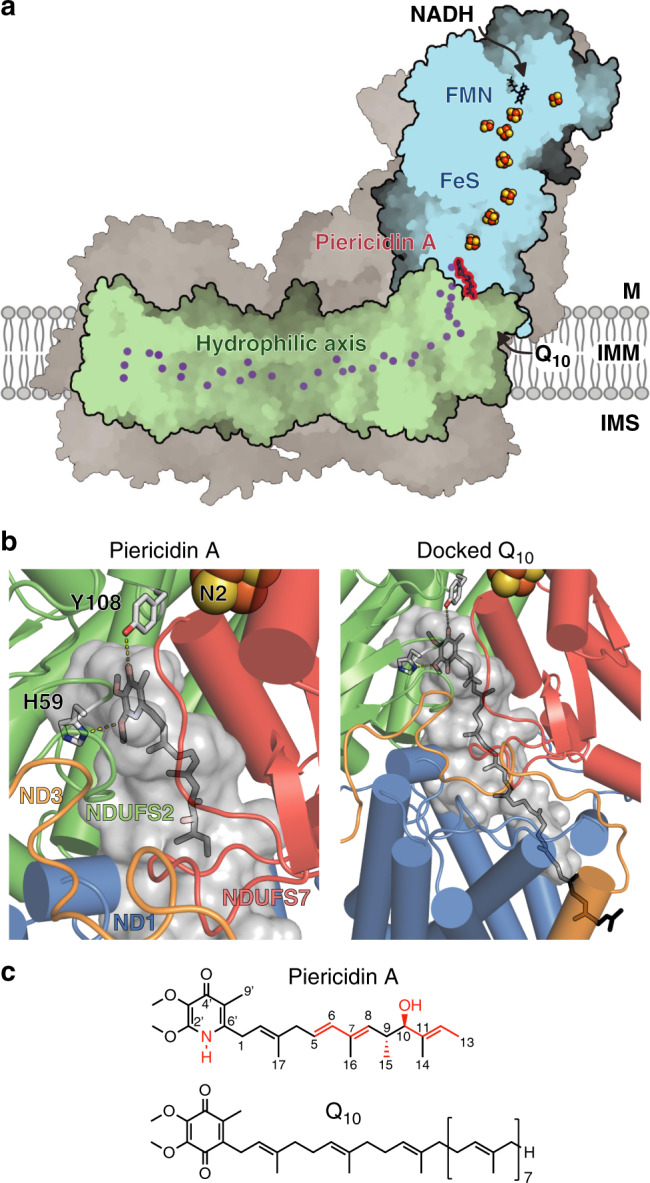
Fig. 1
Piericidin bound in the structure of mammalian complex I.
a The piericidin molecule is located at the interface between the redox (blue) and proton-transfer (green) domains; supernumerary subunits in grey. Charged residues in the proton-transfer domain are m...
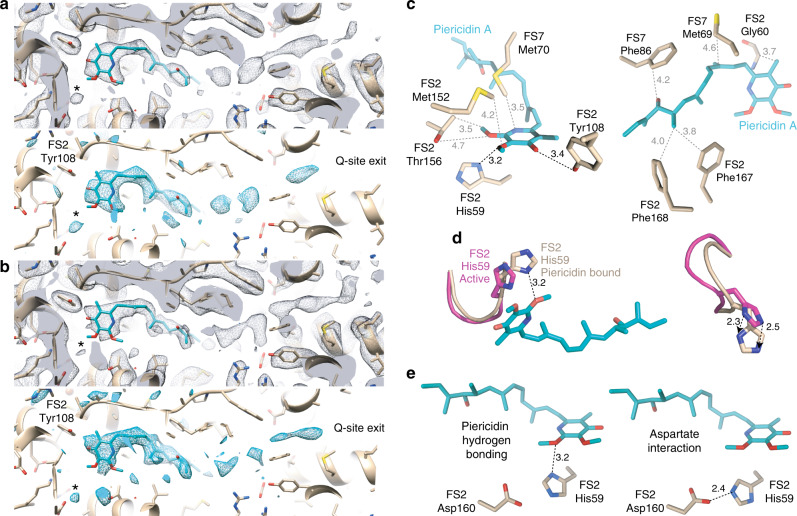
Fig. 2
Cryo-EM densities for the piericidin molecule, and interactions between the protein and the bound piericidin.
a , b Cryo-EM densities for the piericidin-containing region (black mesh, top) and the difference between the piericidin-free protein model and the piericidin-bound density (teal mesh, calculating usi...
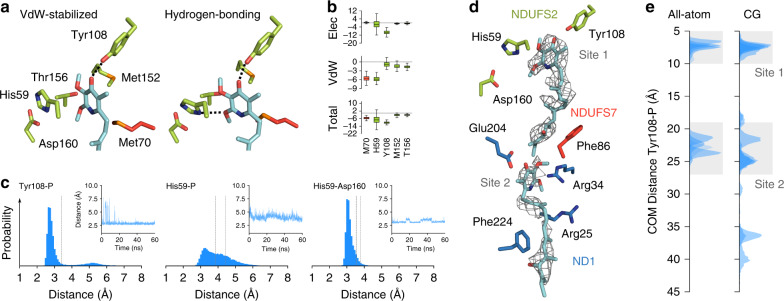
Fig. 3
Molecular dynamics simulations of piericidin in complex I.
a Snapshots from the MD simulations of piericidin in van der Waals (VdW)-stabilised and hydrogen-bonded conformations. Hydrogen bonds are indicated by dotted lines. b Interaction energies between pier...
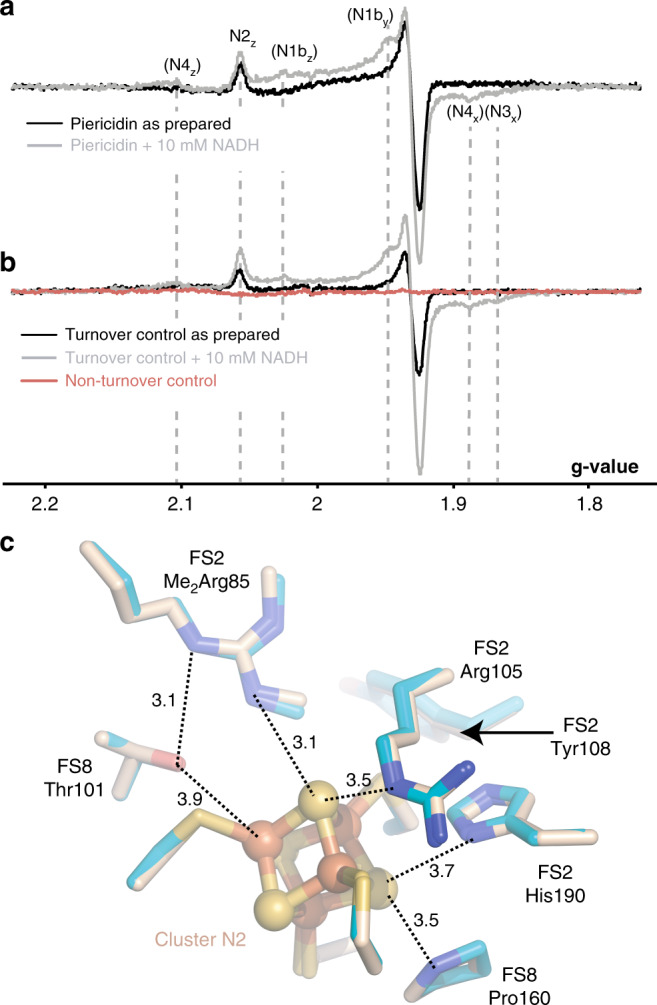
Fig. 4
Cluster N2 is reduced in the piericidin-bound enzyme but its surrounding structure does not change.
a EPR spectra showing reduced clusters in the piericidin-treated sample as prepared (black) and following addition of 10u2009mM NADH (grey). b EPR spectra showing reduced clusters in the piericidin-fr...
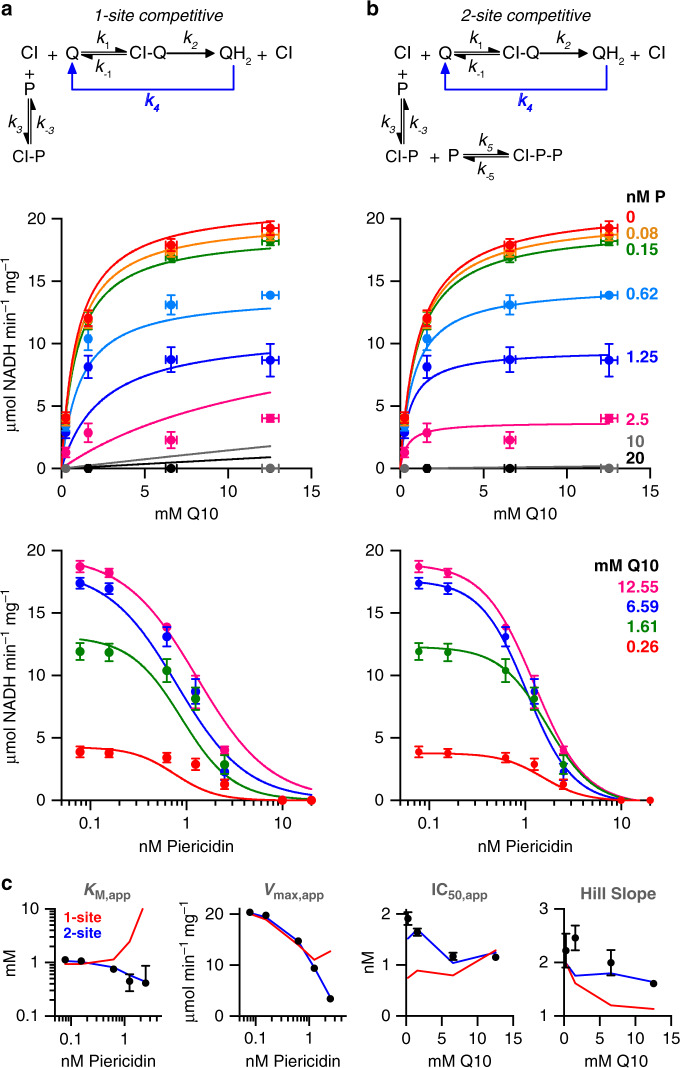
Fig. 5
Competitive models for piericidin inhibition of complex I in proteoliposomes.
a One-site competitive inhibition mechanism. b Two-site competitive inhibition mechanism. In both cases, rapid reoxidation of ubiquinol by AOX ( k 4 ) prevents appreciable levels accumulating. Experim...
Figure images are served from the NIH/NLM PubMed Central Open Access Subset or Europe PMC; copyright remains with the publishers and authors.
💬 Discussion
0 commentsNo comments yet. Be the first to start a discussion!
Leave a Comment