Abstract
AbstractEfficient cytosolic delivery of RNA molecules remains a formidable barrier for RNA therapeutic strategies. Lipid nanoparticles (LNPs) serve as state-of-the-art carriers that can deliver RNA molecules intracellularly, as exemplified by the recent implementation of several vaccines against SARS-CoV-2. Using a bottom-up rational design approach, we assemble LNPs that contain programmable lipid phases encapsulating small interfering RNA (siRNA). A combination of cryogenic transmission electron microscopy, cryogenic electron tomography and small-angle X-ray scattering reveals that we can form inverse hexagonal structures, which are present in a liquid crystalline nature within the LNP core. Comparison with lamellar LNPs reveals that the presence of inverse hexagonal phases enhances the intracellular silencing efficiency over lamellar structures. We then demonstrate that lamellar LNPs exhibit an in situ transition from a lamellar to inverse hexagonal phase upon interaction with anionic membranes, whereas LNPs containing pre-programmed liquid crystalline hexagonal phases bypass this transition for a more efficient one-step delivery mechanism, explaining the increased silencing effect. This rational design of LNPs with defined lipid structures aids in the understanding of the nano-bio interface and adds substantial value for LNP design, optimization and use.
🔬 Techniques
✨ Fluorophores
🧪 Sample Preparation
🔬 Cell Lines
🏭 Microscope Brands
🧪 Reagent Suppliers
📷 Detectors
💻 Software Details
🏛️ Research Organizations (ROR)
Affiliated research institutions:
📋 Methods
Reagents
Cholesterol was purchased from Sigma-Aldrich (Zwijndrecht, The Netherlands). 1,1’-Dioctadecyl-3,3,3’,3’-Tetramethylindodicarbocyanine (DiD) was purchased from Thermo Fisher Scientific (Landsmeer, The Netherlands). L-α-phosphatidylserine (Brain, Porcine, PS), L-α-phosphatidylcholine (Brain, Porcine, PC), L-α-phosphatidylethanolamine (Brain, Porcine, PE), L-α-phosphatidylinositol (Brain, Porcine, PI), 1,2-dioleoyl- sn -glycero-3-phosphoethanolamine-N-(7-nitro-2-1,3-benzoxadiazol-4-yl) (PE-NBD), 1,2-dioleoyl- sn -glycero-3-phosphoethanolamine-N-(lissamine rhodamine B sulfonyl) (PE-LR), 1,2-dioleoyl- sn -glycero-3-phosphoethanolamine (DOPE), 1,2-dimyristoyl- sn -glycero-3-phosphoethanolamine-N-methoxypolyethylene glycol-2000 (DMPE-PEG2k), 1,2-dioleoyl-3-dimethylammonium-propane (DODAP) and 1,2-distearoyl-3-dimethylammonium-propane (DSDAP) were purchased from Avanti Polar Lipids through Merck. All siRNA molecules were purchased from Integrated DNA Technologies (Leuven, Belgium) through custom synthesis, exact sequences can be found in Supplementary Table 1 and are provided in the source data. HeLa-CD63-eGFP, U2OS-UBE21-eGFP cell line were kindly provided by Dr. Ilana Berlin (LUMC, Leiden) and cultured in DMEM growth medium (Sigma Aldrich) containing sodium bicarbonate, without sodium pyruvate and HEPES, was supplemented with 10% fetal bovine serum (Sigma), 1% of L-glutamine (Thermo Fisher Scientific) and 1% penicillin/streptomycin (Thermo Fisher Scientific), at 37 °C in the presence of 5% CO2. Opti-MEM reduced serum medium (Thermo Fisher Scientific) was applied among transfection experiments. All cell lines were routinely tested (negatively) for mycoplasma. Self-assembly of lipid nanoparticles (LNPs) Lipids were combined at the desired molar ratios and concentrations from stock solutions (1-10 mM) in chloroform:methanol (1:1). Solvents were evaporated under a nitrogen flow and residual solvent was removed in vacuo for at least 30 minutes. The lipid film was dissolved in absolute ethanol and used for the assembly. A solution of siRNA was made by dissolving siRNA in 50 mM citrate buffer (pH = 4, RNase free). The solutions were loaded into two separate syringes and connected to a T-junction microfluidic mixer. The solutions were mixed in a 3:1 flow ratio of siRNA against lipids (1.5 mL/min for siRNA solution, 0.5 mL/min for lipids solution). After mixing, the solution was directly loaded in a 10k MWCO dialysis cassette (Slide-A-Lyzer™, Thermo Scientific) or a 1 MDa MWCO dialysis cassette (Spectra-Por® Float-A-Lyzer® G2, Thermo Scientific) and dialyzed against Phosphate Buffered Saline (PBS, 137 mM NaCl, 2.7 mM KCl, 8 mM Na 2 HPO 4 , and 2 mM KH 2 PO 4 ) overnight. After overnight dialysis, siRNA encapsulation efficiency was determined by Quant-iT™ RiboGreen™ RNA Assay Kit as described below. If necessary, LNPs were concentrated using 100k MWCO centrifugal filters (Amicon® Ultra, Merck). Adjustment and dilution of LNPs was done with Dulbecco’s PBS (Merck).
Show full methods section
Reagents
Cholesterol was purchased from Sigma-Aldrich (Zwijndrecht, The Netherlands). 1,1’-Dioctadecyl-3,3,3’,3’-Tetramethylindodicarbocyanine (DiD) was purchased from Thermo Fisher Scientific (Landsmeer, The Netherlands). L-α-phosphatidylserine (Brain, Porcine, PS), L-α-phosphatidylcholine (Brain, Porcine, PC), L-α-phosphatidylethanolamine (Brain, Porcine, PE), L-α-phosphatidylinositol (Brain, Porcine, PI), 1,2-dioleoyl- sn -glycero-3-phosphoethanolamine-N-(7-nitro-2-1,3-benzoxadiazol-4-yl) (PE-NBD), 1,2-dioleoyl- sn -glycero-3-phosphoethanolamine-N-(lissamine rhodamine B sulfonyl) (PE-LR), 1,2-dioleoyl- sn -glycero-3-phosphoethanolamine (DOPE), 1,2-dimyristoyl- sn -glycero-3-phosphoethanolamine-N-methoxypolyethylene glycol-2000 (DMPE-PEG2k), 1,2-dioleoyl-3-dimethylammonium-propane (DODAP) and 1,2-distearoyl-3-dimethylammonium-propane (DSDAP) were purchased from Avanti Polar Lipids through Merck. All siRNA molecules were purchased from Integrated DNA Technologies (Leuven, Belgium) through custom synthesis, exact sequences can be found in Supplementary Table 1 and are provided in the source data. HeLa-CD63-eGFP, U2OS-UBE21-eGFP cell line were kindly provided by Dr. Ilana Berlin (LUMC, Leiden) and cultured in DMEM growth medium (Sigma Aldrich) containing sodium bicarbonate, without sodium pyruvate and HEPES, was supplemented with 10% fetal bovine serum (Sigma), 1% of L-glutamine (Thermo Fisher Scientific) and 1% penicillin/streptomycin (Thermo Fisher Scientific), at 37 °C in the presence of 5% CO2. Opti-MEM reduced serum medium (Thermo Fisher Scientific) was applied among transfection experiments. All cell lines were routinely tested (negatively) for mycoplasma. Self-assembly of lipid nanoparticles (LNPs) Lipids were combined at the desired molar ratios and concentrations from stock solutions (1-10 mM) in chloroform:methanol (1:1). Solvents were evaporated under a nitrogen flow and residual solvent was removed in vacuo for at least 30 minutes. The lipid film was dissolved in absolute ethanol and used for the assembly. A solution of siRNA was made by dissolving siRNA in 50 mM citrate buffer (pH = 4, RNase free). The solutions were loaded into two separate syringes and connected to a T-junction microfluidic mixer. The solutions were mixed in a 3:1 flow ratio of siRNA against lipids (1.5 mL/min for siRNA solution, 0.5 mL/min for lipids solution). After mixing, the solution was directly loaded in a 10k MWCO dialysis cassette (Slide-A-Lyzer™, Thermo Scientific) or a 1 MDa MWCO dialysis cassette (Spectra-Por® Float-A-Lyzer® G2, Thermo Scientific) and dialyzed against Phosphate Buffered Saline (PBS, 137 mM NaCl, 2.7 mM KCl, 8 mM Na 2 HPO 4 , and 2 mM KH 2 PO 4 ) overnight. After overnight dialysis, siRNA encapsulation efficiency was determined by Quant-iT™ RiboGreen™ RNA Assay Kit as described below. If necessary, LNPs were concentrated using 100k MWCO centrifugal filters (Amicon® Ultra, Merck). Adjustment and dilution of LNPs was done with Dulbecco’s PBS (Merck).
RNA encapsulation and dose determination assay Encapsulation efficiency
(EE%) defined as the amount of siRNA encapsulated versus the free siRNA in solution after dialysis was determined using a Quant-iT™ RiboGreen™ RNA Assay Kit (Invitrogen). For the determination of non-encapsulated siRNA, LNPs after dialysis were diluted with the supplied 1 x TE buffer (RNase free) and treated with the RiboGreen™ reagent. For the determination of the complete amount of siRNA in the sample, LNPs after dialysis were treated with 1% Triton X-100 in TE buffer (RNase free) and incubated for 15 minutes followed by dilution with TE buffer and treatment with the RiboGreen™ reagent. Both conditions were performed in triplicate to ensure proper lysis of the LNPs. Change in fluorescence was measured in 96-well plates using a TECAN Infinite M1000 Pro microplate reader and the percentage of siRNA encapsulation (EE%) was determined using the fraction of (F total RNA – F free RNA )/F total RNA × 100%. Quantification of the dose was determined using a similar protocol, in which the RiboGreen™ fluorescence was determined of concentrated LNPs. The supplied RNA standards were used to generate a standard curve and the concentration of encapsulated mRNA was determined by inserting (F total RNA – F free RNA ) in the standard curve. Cryogenic transmission electron microscopy (cryoTEM) Vitrification of concentrated LNPs ( ~ 10-15 mM) was performed using a Leica EM GP operating at 22 °C or 37 °C and 95% relative humidity. Sample suspensions were placed on glow discharged 150 µm lacey carbon films supported by 200 mesh copper grids (Electron Microscopy Sciences). In general, optimal results were achieved using a 30-60 second pre-blot and a 1 second blot time. After vitrification, sample grids were maintained below −170 °C and imaging was performed on a Tecnai T12 (ThermoFisher) with a biotwin lens and LaB6 filament operating at 120 keV equipped with an Eagle 4 K x 4 K CCD camera (ThermoFisher). Images were acquired at a nominal underfocus of −2 to −3 µm (49,000× magnification) with an electron dose of ∼2000 e − ·nm −2 . For higher resolution cryoEM, grids were loaded into a Titan Krios transmission electron microscope (FEI Company) equipped with a field emission gun operating at 300 kV and were imaged using a Falcon 3 direct electron detector (FEI). Images were acquired a calibrated magnification of 75,000× with a nominal underfocus of −1 to −2 µm and an electron dose of ∼2000 e − ·nm −2 .
Single particle analysis of cryoTEM data
Single particles were chosen based on the presence of structure formation from a collection of 2D cryoTEM images, divided over three independent assemblies of the same LNP formulation. Only particles present in vitreous ice were considered for analysis. Regions of interest from individual particles and the fast Fourier transform (FFT), as well as the determination of particle size was performed using the Fiji distribution of ImageJ 75 . Cryogenic electron tomography (cryoET) Samples for cryoET were prepared as described for 2D cryoTEM, but with the addition of BSA-coated 10 nm gold beads immediately prior to vitrification to act as fiducial markers for tomogram reconstruction. Tilt series were collected using Tomo 4.0 (FEI) on a Titan Krios at a magnification of 75,000×, for a final pixel size 1.87 Å/pixel, using a continuous tilt series from −60° to +60° with increments of 2° and an electron dose of ~200-250 e − /nm 2 per tilt image. Focusing to −4 to −5 μm was performed every second image acquisition using a low-dose routine. Tomograms were processed using IMOD software (v4.x) 76 , using fiducial tracking and reconstructed with both weighted back-projection and 5 iterations of a SIRT-like filter within IMOD to enhance contrast. Tomograms were visualised and analysed using a combination of IMOD and UCSF Chimera (v1.17) 77 . Model building DOPE and DODAP lipids were built using PyMOL (v2.x) 78 , before parametrization in eLBOW within Phenix (v1.19) 79 , 80 . Lipids were relaxed into varied appropriate geometries using ISOLDE within UCSF ChimeraX (v1.17) 81 , 82 . UCSF Chimera (v1.17) was used to build models of siRNA and lipid-siRNA structures. Small Angle X-ray scattering (SAXS) SAXS measurements were performed in transmission mode on a SAXSLAB GANESHA system with a Pilatus 300 K solid-state photon-counting 2D detector using a high brilliance Microfocus Cu Source, Xenocs Genix3D, wavelength 1.54184 Å. The LNPs ( ~ 12 mM) were loaded into 2 mm lockable thin wall capillaries and measured at a q-range of 0.0129 – 0.6870 Å −1 with an exposure time of 6 hours. Prior to each measurement series, a silver behenate standard was used to correct for deviations in the sample to detector distance. For temperature-dependent experiments, the temperature was equilibrated to 25 °C or 37 °C for 30 minutes prior to measurement. The measured SAXS profiles are displayed as the average intensity I(q) vs. the q-range. For kinetic temperature experiments, the measurement time was divided into the average intensity of 1-hour sections. Assembly of large unilamellar vesicles (LUVs) LUVs were assembled using a combination of freeze-thaw cycles and extrusion. Lipids were combined from stock solutions (2-10 mM) in chloroform to a achieve a lipid composition of PC:PE:PS:Chol:PI of 50:27:10:10:3 mol% or PC:PE:PS:Chol:PI:PE-NBD:PE-LR of 50:24:10:10:3:1.5:1.5 mol%. The solvent was evaporated from the mixture under a nitrogen flow, followed by removal of trace solvents in vacuo for at least 1 hour. The resulting lipid film was hydrated with either 100 mM citrate buffer (pH = 5.5) or phosphate buffered saline (PBS, pH = 7.3), to achieve the desired total lipid concentration (10-20 mM) and vortexed until the entire lipid film was fully suspended in solution. The suspension was subjected to seven freeze-thaw cycles. In each cycle, the mixture was frozen completely with liquid nitrogen and left to thaw at room temperature, followed by vigorous mixing to ensure complete thawing. After these cycles, the mixture was extruded at 40 °C (Mini-extruder, Avanti Polar Lipids, Alabaster, US). The mixture was passed 11 times through a 200 nm polycarbonate (PC) membrane (Nucleopore Track-Etch membranes, Whatman). All liposome formulations were stored at 4 °C and used within 2 days. Lipid mixing determined by Fluorescence Resonance Energy Transfer (FRET) For the determination of lipid mixing efficiency by FRET, LUVs with a composition of PC:PE:PS:Chol:PI:PE-NBD:PE-LR of 50:24:10:10:3:1.5:1.5 mol% were prepared in 100 mM citrate buffer (pH = 5.5) or PBS (pH = 7.4) as described above. The LUVs were diluted with their respective buffers to 250 µM and 100 µL was transferred to black F-bottom chimney 96-well plates (Greiner®). The LUVs were heated to 37 °C prior to further use. For the control serving as 100% lipid mixing, 20 µL of 1% Triton X-100 in H 2 O was added followed by the addition of 80 µL PBS. For the control serving as 0% lipid mixing, 100 µL PBS was added to the LUVs. LNPs were assembled and diluted in PBS (pH = 7.4) to 500 µM and 100 µL was added to the acceptor LUVs, yielding a final concentration 125 µM LUVs and 250 µM LNPs. In the case where 100 mM citrate buffer was used for the LUVs, the final pH was ~6.0. All of the conditions were performed in triplicate. After addition of the LNPs, the dequenching of the PE-NBD signal was measured every 15 seconds for 25 minutes using a TECAN Infinite M1000 Pro microplate reader (ʎ: excitation = 460 nm ± 10 nm, emission = 535 nm ± 10 nm).
CryoTEM and SAXS analysis of lipid mixing
For the assessment of lipid mixing with cryoTEM and SAXS analysis, LUVs with a composition of PC:PE:PS:Chol:PI of 50:27:10:10:3 mol% were prepared in 100 mM citrate buffer (pH = 5.5) at a concentration of 20 mM as described above. LNPs were prepared as described before and concentrated to ~20 mM. The LUVs and LNPs were mixed at a volumetric ratio of 1:2, respectively, and incubated at 37 °C. For cryoTEM, samples were vitrified after 1 hour of incubation as described above. In the case of SAXS measurements, the mixture of LUVs and LNPs were loaded into capillaries and equilibrated at 37 °C for 1 hour prior to the start of the measurement, as described above. The presented data is of the mixed samples minus the background of LUVs in citrate buffer mixed with PBS (without LNPs) at the same final concentration. Cell transfection and FACS experiments HeLa-CD63-eGFP, U2OS-UBE21-eGFP were seeded in 96-well plate at the density of 1*10 4 cells/well on the day before, different concentrations of siRNA-GFP encapsulated LNPs (0 – 83 nM) in 100 μL Opti-MEM medium were added to the cells and incubated for 24 h, then the medium was removed and refreshed with new Opti-MEM for continuous 48 h culturing. After 72 h incubation, cells were digested, collected and resuspended in PBS for FACS measurements (Guava easyCyte Flow Cytometers). DiD mean fluorescence intensities (Red-R channel) was quantified as the uptake of LNPs into cells. The eGFP expression (GFP MFI, Green-B channel) of all LNP treated cells are relative to PBS treated cells, for which the values are set as 100%. Cell viability assay HeLa-CD63-eGFP, U2OS-UBE21-eGFP cells were seeded 96-well plate at a density of 1*10 4 cells per well the day before, then followed with the same procedure as the transfection with different concentrations of LNPs determined by the Ribogreen RNA assay. After 72 h incubation, cell viabilitity reagent alarmaBlue HS solution (10 μL, ThermoFisher) was added to the medium (100 μL) and incubated for another 4 h at 37 °C. After 4 h, the absorbance at 570 nm (using 600 nm as a reference wavelength) was measured at room temperature using a Tecan infinite M1000, which was shaken for 60 s before measurement (2 mm linearly, 654 rpm). The cell viability was normalized with control (blank HeLa-CD63-eGFP, U2OS-UBE21-eGFP cells), which was set at 100% cell survival. All conditions were performed in triplicate. Reporting summary Further information on research design is available in the Nature Portfolio Reporting Summary linked to this article.
Supplementary information Supplementary Information Peer Review File Reporting Summary Source data Source data
📊 Figures
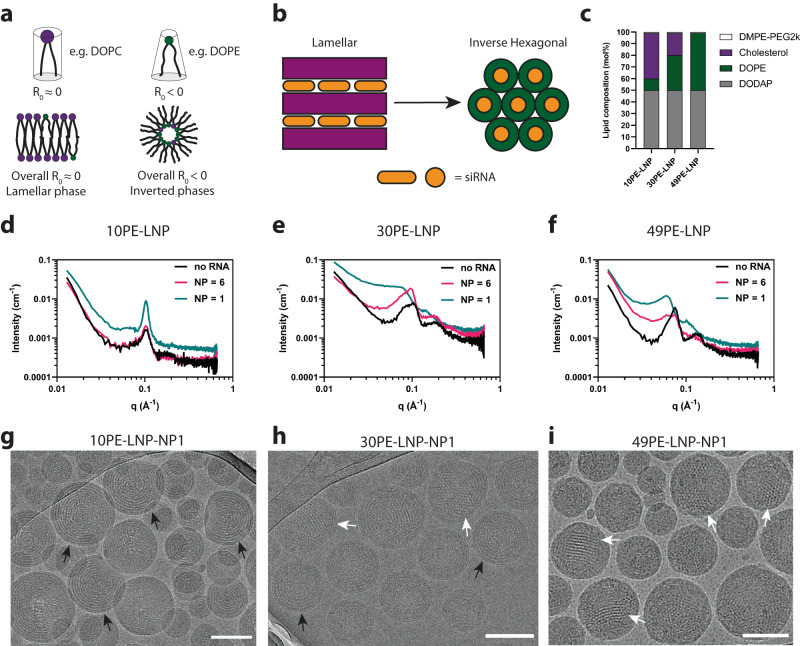
Fig. 1
Design of LNPs containing defined lipid phases.
a Curvature in lipid mixtures is driven by the composition of lipids with various curvature profiles Compositions with larger amounts of lipids with a R 0 <u20090 lead to the formation of inverted ...
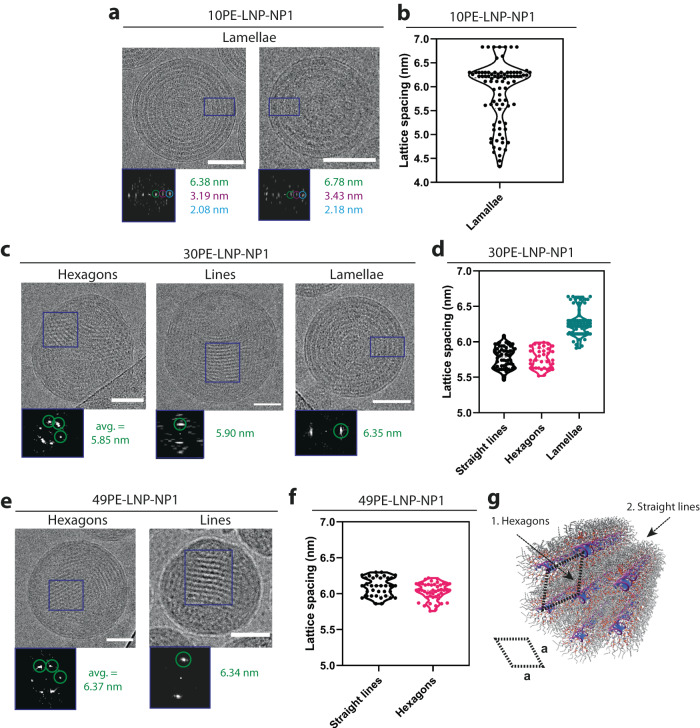
Fig. 2
Identification and quantification of lipid-siRNA structures in LNPs.
a CryoTEM of representative structures found in 10PE-LNP-NP1. FFT values represent the [100] structure and higher-order reflections. Scale bars are 50u2009nm. b Quantification of lamellar spacings ( n...
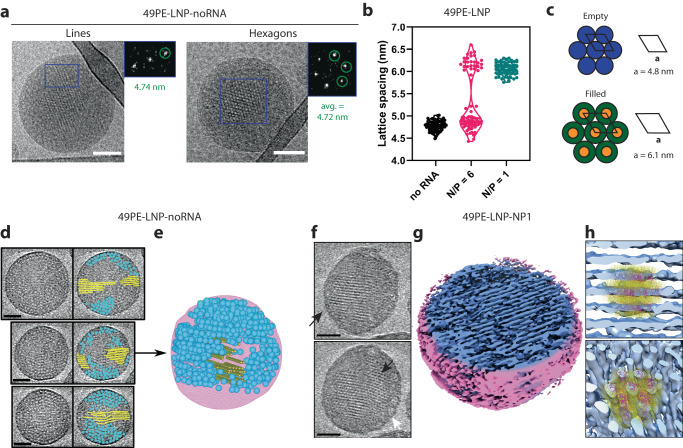
Fig. 3
Identification of filled and empty inverse hexagonal structures.
a Representative cryoTEM and FFTs of 49PE-LNP-noRNA showing two distinct structures: straight lines and hexagons. Scale bars are 50u2009nm. b Quantification of lattice spacings of structures found in ...
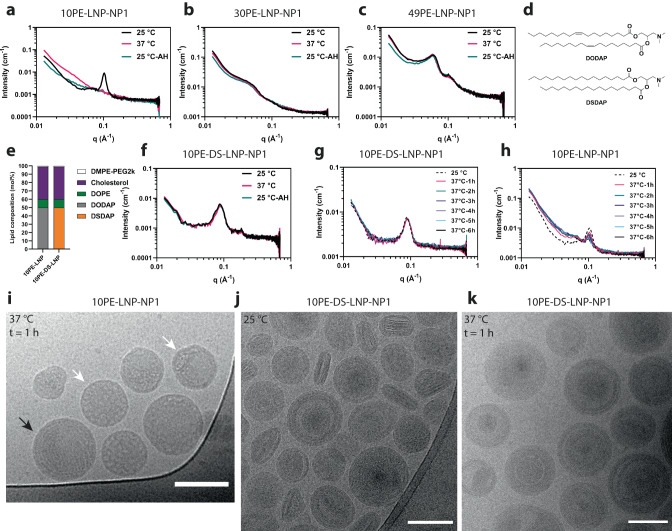
Fig. 4
The effect of temperature on LNP core structure.
au2013c SAXS profiles of LNP-10PE-NP1, LNP-30PE-NP1 and LNP-49PE-NP1 at 25u2009u00b0C, 37u2009u00b0C and 25u2009u00b0C after heating (AH). d Chemical structures of the ionizable lipids DODAP and DSDAP...
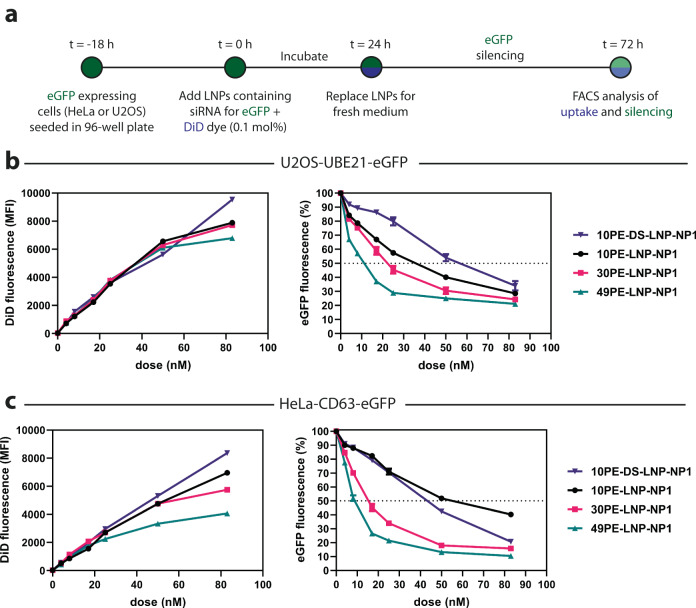
Fig. 5
Intracellular silencing of eGFP with lamellar and liquid crystalline inverted hexagonal LNPs.
a Schematic representation of the cell culture eGFP silencing experiment. Cells are incubated with LNPs for 24u2009hours, followed by medium replacement and culturing for an additional 48u2009hours. A...
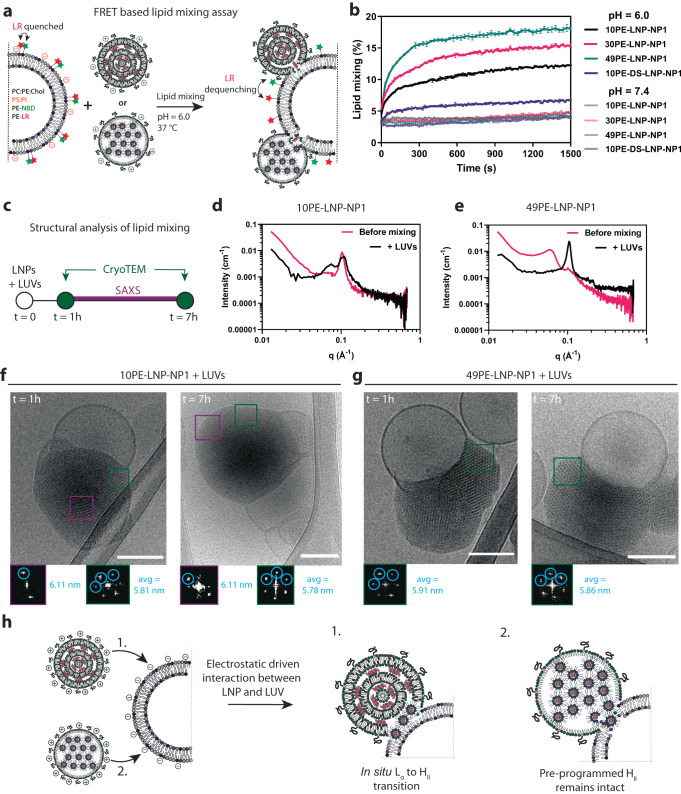
Fig. 6
Interaction of LNPs with anionic LUVs.
a Schematic representation of the FRET based lipid mixing assay. LNPs are mixed with anionic acceptor liposomes containing two lipid conjugated fluorophores (PE-NBD and PE-LR), after which the dequenc...
Figure images are served from the NIH/NLM PubMed Central Open Access Subset or Europe PMC; copyright remains with the publishers and authors.
💬 Discussion
0 commentsNo comments yet. Be the first to start a discussion!
Leave a Comment