Abstract
Abstract Neuronal hyperactivity is a key feature of early stages of Alzheimer's disease (AD). Genetic studies in AD support that microglia act as potential cellular drivers of disease risk, but the molecular determinants of microglia‐synapse engulfment associated with neuronal hyperactivity in AD are unclear. Here, using super‐resolution microscopy, 3D‐live imaging of co‐cultures, and in vivo imaging of lipids in genetic models, we found that spines become hyperactive upon Aβ oligomer stimulation and externalize phosphatidylserine (ePtdSer), a canonical “eat‐me” signal. These apoptotic‐like spines are targeted by microglia for engulfment via TREM2 leading to amelioration of Aβ oligomer‐induced synaptic hyperactivity. We also show the in vivo relevance of ePtdSer‐TREM2 signaling in microglia‐synapse engulfment in the hAPP NL‐F knock‐in mouse model of AD. Higher levels of apoptotic‐like synapses in mice as well as humans that carry TREM2 loss‐of‐function variants were also observed. Our work supports that microglia remove hyperactive ePtdSer + synapses in Aβ‐relevant context and suggest a potential beneficial role for microglia in the earliest stages of AD.
🔬 Techniques
🔭 Microscopes
💻 Software
✨ Fluorophores
🧪 Sample Preparation
🔬 Cell Lines
🏭 Microscope Brands
🧪 Reagent Suppliers
📷 Detectors
🔎 Objectives
💻 Software Details
🏛️ Research Organizations (ROR)
Affiliated research institutions:
📋 Methods
Reagents and Tools table qPCR primers Gene
Primer sequence 5′‐3′ Actb Forward: CATTGCTGACAGGATGCAGAAGG, Reverse: TGCTGGAAGGTGGACAGTGAGG Cx3cr1 Forward: GAGTATGACGATTCTGCTGAGG, Reverse: CAGACCGAACGTGAAGACGAG Gapdh Forward: CATCACTGCCACCCAGAAGACTG, Reverse: ATGCCAGTGAGCTTCCCGTTCAG Gfap Forward: CACCTACAGGAAATTGCTGGAGG, Reverse: CCACGATGTTCCTCTTGAGGTG Itgam Forward: ATGGACGCTGATGGCAATACC, Reverse: TCCCCATTCACGTCTCCCA Mag Forward: GGCCGAGGAGCAAGAATGG, Reverse: CATGCACTCTGCGATACGCT Map2 Forward: ATGACAGGCAAGTCGGTGAAG, Reverse: CATCTCGGCCCTTTGGACTG Rpl32 Forward: ATCAGGCACCAGTCAGACCGAT, Reverse: GTTGCTCCCATAACCGATGTTGG Tmem119 Forward: CCTACTCTGTGTCACTCCCG, Reverse: CACGTACTGCCGGAAGAAATC Trem2 Forward: CTGGAACCGTCACCATCACTC, Reverse: CGAAACTCGATGACTCCTCGG Primary antibodies Antibody target Catalog no. Company Host Dilution Homer1 160006 Synaptic Systems Chicken 1/200 Synaptotagmin 1/2 105002 Synaptic Systems Rabbit 1/200 Bassoon 141003 Synaptic Systems Rabbit 1/200 6E10 803001 BioLegend Mouse 1/1,000 4G8 800708 BioLegend Mouse 1/1,000 GAPDH ab181602 Abcam Rabbit 1/20,000 Synaptophysin ab8049 Abcam Mouse 1/1,000 PDS‐95 MAB1596 Merck Mouse 1/1,000 PSD‐95 124014 Synaptic Systems Guinea pig 1/1,000 Cleaved caspase‐3 9661S Cell Signalling Rabbit 1/1,000 Caspase‐3 9662 Cell Signalling Rabbit 1/1,000 Iba1 019‐19741 Wako Chemicals Rabbit 1/500 P2Y12 AS‐55043A Anaspec Rabbit 1/500 CD68 MCA‐1957 Serotec Rat 1/500 Secondary antibodies Fluorophore tag Catalog no. Company Host Dilution Anti‐Chicken 488 A11039 ThermoFisher Goat 1/500 Anti‐Rabbit 594 A11037 ThermoFisher Goat 1/500 Anti‐Rabbit 546 A11035 ThermoFisher Goat 1/500 Anti‐Rabbit 647 A27040 ThermoFisher Goat 1/1,000 Anti‐Rat 647 A21247 ThermoFisher Goat 1/500 Anti‐ Mouse HRP ab205719 Abcam Goat 1/5,000 Anti‐ Rabbit HRP ab205718 Abcam Goat 1/10,000 Anti‐Mouse 800 A32789 ThermoFisher Goat 1/1,000 Anti‐Rabbit 680 A32734 ThermoFisher Goat 1/1,000 Methods and Protocols Animals All experiments have been reviewed by UCL's animal care committees and conducted in accordance with the regulations set out in the Animals in Scientific Procedures Act (ASPA) 1986. Sprague Dawley rats obtained from Charles River UK and Homer1‐eGFP (Ebihara et al , 2003 ) obtained from Japan (kind gift from S. Okabe) were used for primary neuronal cultures at embryonic day (E18). C57BL6/J (WT) mice obtained from Charles River UK and Trem2 R47H KI mice (imported from JAX, C57BL/6J‐ Trem2 em1Adiuj/J Strain #027918) were used for primary microglial culture preparation at P0‐P4.
Show full methods section
Reagents and Tools table qPCR primers Gene
Primer sequence 5′‐3′ Actb Forward: CATTGCTGACAGGATGCAGAAGG, Reverse: TGCTGGAAGGTGGACAGTGAGG Cx3cr1 Forward: GAGTATGACGATTCTGCTGAGG, Reverse: CAGACCGAACGTGAAGACGAG Gapdh Forward: CATCACTGCCACCCAGAAGACTG, Reverse: ATGCCAGTGAGCTTCCCGTTCAG Gfap Forward: CACCTACAGGAAATTGCTGGAGG, Reverse: CCACGATGTTCCTCTTGAGGTG Itgam Forward: ATGGACGCTGATGGCAATACC, Reverse: TCCCCATTCACGTCTCCCA Mag Forward: GGCCGAGGAGCAAGAATGG, Reverse: CATGCACTCTGCGATACGCT Map2 Forward: ATGACAGGCAAGTCGGTGAAG, Reverse: CATCTCGGCCCTTTGGACTG Rpl32 Forward: ATCAGGCACCAGTCAGACCGAT, Reverse: GTTGCTCCCATAACCGATGTTGG Tmem119 Forward: CCTACTCTGTGTCACTCCCG, Reverse: CACGTACTGCCGGAAGAAATC Trem2 Forward: CTGGAACCGTCACCATCACTC, Reverse: CGAAACTCGATGACTCCTCGG Primary antibodies Antibody target Catalog no. Company Host Dilution Homer1 160006 Synaptic Systems Chicken 1/200 Synaptotagmin 1/2 105002 Synaptic Systems Rabbit 1/200 Bassoon 141003 Synaptic Systems Rabbit 1/200 6E10 803001 BioLegend Mouse 1/1,000 4G8 800708 BioLegend Mouse 1/1,000 GAPDH ab181602 Abcam Rabbit 1/20,000 Synaptophysin ab8049 Abcam Mouse 1/1,000 PDS‐95 MAB1596 Merck Mouse 1/1,000 PSD‐95 124014 Synaptic Systems Guinea pig 1/1,000 Cleaved caspase‐3 9661S Cell Signalling Rabbit 1/1,000 Caspase‐3 9662 Cell Signalling Rabbit 1/1,000 Iba1 019‐19741 Wako Chemicals Rabbit 1/500 P2Y12 AS‐55043A Anaspec Rabbit 1/500 CD68 MCA‐1957 Serotec Rat 1/500 Secondary antibodies Fluorophore tag Catalog no. Company Host Dilution Anti‐Chicken 488 A11039 ThermoFisher Goat 1/500 Anti‐Rabbit 594 A11037 ThermoFisher Goat 1/500 Anti‐Rabbit 546 A11035 ThermoFisher Goat 1/500 Anti‐Rabbit 647 A27040 ThermoFisher Goat 1/1,000 Anti‐Rat 647 A21247 ThermoFisher Goat 1/500 Anti‐ Mouse HRP ab205719 Abcam Goat 1/5,000 Anti‐ Rabbit HRP ab205718 Abcam Goat 1/10,000 Anti‐Mouse 800 A32789 ThermoFisher Goat 1/1,000 Anti‐Rabbit 680 A32734 ThermoFisher Goat 1/1,000 Methods and Protocols Animals All experiments have been reviewed by UCL's animal care committees and conducted in accordance with the regulations set out in the Animals in Scientific Procedures Act (ASPA) 1986. Sprague Dawley rats obtained from Charles River UK and Homer1‐eGFP (Ebihara et al , 2003 ) obtained from Japan (kind gift from S. Okabe) were used for primary neuronal cultures at embryonic day (E18). C57BL6/J (WT) mice obtained from Charles River UK and Trem2 R47H KI mice (imported from JAX, C57BL/6J‐ Trem2 em1Adiuj/J Strain #027918) were used for primary microglial culture preparation at P0‐P4.
App NL‐F KI mice
(Saito et al , 2014 ; kindly provided by Takaomi Saido, Riken and distributed by Frances Edwards, UCL) were crossed to Trem2 R47H KI mice for in vivo labeling of lipids, synapse loss, and microglial engulfment studies. APP transgenic J20 mice (kindly provided by Lennart Mucke and distributed by Patricia Salinas, UCL) were used at age 3 months for in vivo labeling of lipids. For all experiments, appropriate sex‐ and age‐matched controls were used. For App NL‐F KI and Trem2 R47H KI genotype, homozygous mice were used; for Homer1‐eGFP, heterozygous mice were used.
Primary neuronal culture
Primary hippocampal neurons were prepared as previously described (Lee et al , 2016 ) from E18 Sprague Dawley rats and Homer1‐eGFP mice of either sex ( n = 10–15 pups per preparation). Briefly, hippocampi were dissected, dissociated with papain, and triturated with a polished half‐bore pasteur pipette. Next, cells were resuspended in Hank's Balanced Salt Solution (HBSS; HyClone, Logan, UT) supplemented with 0.6% glucose, 1 mM pyruvate, 2 mM GlutaMAX (Gibco), and 10% FBS (HyClone) and plated on Poly‐D‐lysine (PDL)‐coated glass coverslips in a 60‐mm Petri dish or 35 mm glass‐bottom culture dish (81158, ibidi). Four hours after plating, the medium was replaced with neurobasal medium (Invitrogen) supplemented with 2% (v/v) B‐27 (Invitrogen), 0.5 mM GlutaMAX. Half of the medium was replaced by a new neurobasal media with B‐27 and L‐glutamine at DIV 4, 7 and 14. Four mM 1‐β‐D‐cytosine‐arabinofuranoside (Ara‐C; Sigma) was added as needed. Cells were maintained in an incubator at 37°C and 5% CO 2 and used at DIV 17–21 for experimental procedures.
Primary neuron GCaMP7 transfection
Neurons were transfected using a modified calcium‐phosphate method as previously described (Lee et al , 2016 ) using a pAAV‐syn‐jGCaMP7c‐WPRE plasmid (Addgene). Briefly, 6 μg of DNA and 9.3 μl of 2 M CaCl 2 were mixed in distilled water to a total volume of 75 μl and the same volume of 2× BBS [50 mM BES, 280 mM NaCl, and 1.5 mM Na 2 HPO 4 (pH 7.1)] was added. The cell culture medium was completely replaced by transfection medium (MEM; 1 mM sodium pyruvate, 0.6% glucose, 10 mM HEPES, 1 mM Kynurenic acid, and 10 mM MgCl 2 , pH 7.71), and the DNA mixture was added to the cells and incubated in a 5% CO 2 incubator for 60 min. Cells were washed with a washing medium (pH 7.30) and then returned to the original culture medium. Neurons were transfected at DIV 8–9 and analyzed at DIV 16–21. pAAV‐syn‐jGCaMP7c‐WPRE plasmid was purchased from Addgene.
Primary microglial culture preparation
Primary mouse WT and Trem2 R47H KI microglial cultures were prepared at P0‐P4 mice from either sex ( n = 8–10 pups per preparation). Mouse brains were dissected in cold HBSS on ice, and the cortices and hippocampi were isolated. Tissue was homogenized with 2 ml stripette (15 strokes). Next, the homogenate was put through a pre‐wet 70 μM strainer and centrifuged at 400 g for 5 min at 4°C. The supernatant was removed, and the cell pellet was resuspended in ice‐cold 35% isotonic percoll. The interface was carefully created with HBSS. The samples were centrifuged for 40 min at 4°C at 2,800 g with no break and with slow acceleration and deceleration. The myelin layer and supernatant was aspirated, and the cell pellet was washed in HBSS. The cells were centrifuged for 5 min at 4°C and 400 g . The supernatant was removed, and cells were resuspended in 1 ml microglial media (DMEM F12 Gibco, 5% fetal bovine serum Gibco, 1% pen‐strep Gibco, 50 ng/ml CSF1 416‐ML‐010/CF RnD Systems, 50 ng/ml TGFb1 7666‐MB‐005/CF RnD Systems, and 100 ng/ml CX3CL1 472‐FF‐025/CF RnD Systems) for cell counting. Cells were plated in borate buffer 0.1 M pH 8.5 PDL (Gibco)‐coated 12‐well plates (CC7682‐7512, Starlab) in 1 ml of microglial media at a density of 650,000 per well. Cells were maintained in an incubator at 37°C and 5% CO 2 . Ninety percent of media was changed the day after, and subsequently half of the media was changed every 2 days. Primary microglial cells are supplemented with TGFβ, which has been shown to imprint key microglial signature genes such as Tmem119 (Butovsky et al , 2014 ). Additionally, mCSF is added to the media to stimulate microglial survival and fractalkine as the ligand for the key microglial homeostatic receptor, CX3CR1. The combination of TGFβ, mCSF, and fractalkine is used to mimic a more homeostatic in vivo ‐like profile of microglia as shown by high levels of Tmem119 mRNA in Cx3cr1 + Trem2 + Itgam + primary microglial cells (Fig EV1C ). RNA isolation, reverse transcription, and RT–qPCR Primary microglial cells were lysed and scraped off using TRIzol reagent (15596026, Invitrogen) after which chloroform was added to separate the homogenate layers. RNA was precipitated from the aqueous layer using 2‐propranolol and then washed with ethanol. The RNA pellet was resuspended in nucleus‐free‐water after which RNA purity and concentration was assessed by Nanodrop. mRNA was converted to cDNA using the qScript cDNA SuperMix reverse transcription kit as described by the manufacturer (95048, Quantabio). For RT–qPCR, 12 ng of cDNA was loaded in triplicates per gene in a total volume of 20 μl using the SYBR green PCR master mix as described by the manufacturer (4309155, ThermoFisher). The reaction was run using a LightCycler 96 Instrument (Roche) with white 96‐well plates (04729692001, Roche). Triplicate Ct values were averaged, and data are shown as respective to the geomean of three housekeeping genes ( Actb , Gapdh , Rpl32 ) using the Ct delta method (2 −∆∆Ct ). Primers purchased from IDT were used at a concentration of 200 nM, see Reagents and Tools table for sequences. Neuron–microglia co‐culture Primary microglia at DIV 7 were detached with ice‐cold PBS and centrifuged for 5 min at 4°C and 400 g . The supernatant was removed, and cells were resuspended in 1 ml neuron culture media supplemented with CSF1, TGFβ1, and CX3CL1. Cells were plated on the DIV 14 neurons at the ratio of 2:1. Cells were co‐incubated in an incubator at 37°C and 5% CO 2 for 7 days before analysis.
Neuronal calcium imaging
To measure neuronal spontaneous calcium activity, GCaMP7‐expressing primary neurons cultured with or without microglia were assessed using a spinning disk confocal microscope (ECLIPSE Ti‐E, Nikon) with a Plan Apo 60×/NA 1.40 oil objective and a Neo sCMOS camera (Andor Technology) at 37°C. Time‐lapse images were acquired every 100 ms for 1 min. First, regions of interest (ROIs) were drawn around individual dendritic spines, and then, relative fluorescence change (Δ F / F 0 ) versus time traces were generated for each ROI. Ca 2+ transients were identified as changes in Δ F / F 0 that were larger than 10% of the baseline intensity 0 .
Live‐cell labeling
For live‐cell labeling of externalized phosphatidylserine (ePtdSer), 1 mM PSVue® 550 (P‐1005, Molecular Targeting Technologies; prepared following the manufacturer's instructions) was diluted in Tyrode's solution (136 mM NaCl, 2.5 mM KCl, 2 mM CaCl 2 , 1.3 mM MgCl 2 , 10 mM HEPES and 10 mM Glucose, pH 7.4) at 1:1,000 and incubated for 10 min before imaging. For live‐cell microglial labeling, fluorescent conjugated plant lectin Griffonia (Bandeiraea) simplicifolia lectin I, Isolectin GS‐IB 4 ‐647 (IB4; I32450 , ThermoFisher) was diluted in Tyrode's solution at 1/1000 and incubated for 10 min before imaging. IB4 binds selectively to microglial RET receptor tyrosine kinase and is commonly used as a microglial marker in the brain.
High‐resolution cell imaging and analysis
Airyscan live‐cell images were acquired with a laser scanning LSM880 Airyscan microscope, using a Plan APO 20X/NA 0.8 objective (Zeiss). Emission filter bandwidths and sequential scanning acquisition were set up, to avoid any possible spectral overlap between fluorophores with 37°C and 5% CO 2 maintained. 3D time‐lapse images were acquired in z‐stack step size 800 nm × 15 steps every 2 min for 1 h and subsequently processed using Imaris software (Bitplane). PSVue + Homer1‐GFP inside the microglia were identified by masking PSVue colocalized Homer1 with IB4 surface. For Homer1‐eGFP and PSVue colocalization analysis, z‐stack images were acquired on a LSM880 Airyscan microscope using 63×/NA 1.40 objective with 0.3 μm z‐steps. The percentage of Homer1 and PSVue colocalization was calculated for every z‐step using Fiji (NIH software). For quantification of preferential contact and engulfment of Homer1‐eGFP + PSVue + dendritic spines by microglia, ROIs with mobile Homer1‐eGFP puncta within 5 μm from microglial were selected and the ratio of colocalization with PSVue was analyzed. For quantification of PSVue‐level postfixation of neuron‐only and co‐cultured neurons with microglia in GCaMP7 experiments, z‐stack images were acquired on a LSM980 Airyscan microscope using 63×/NA 1.40 objective with 0.17 μm z‐steps. The puncta number per 100 μm 2 and mean intensity of PSVue were measured per ROI using Fiji (NIH software). For quantification of PtdSer externalization dependent on depolarization and calcium transients, PSVue‐labeled primary neurons were treated with 30 mM KCl or 50 nM oAβ in normal or low‐calcium Tyrode's solution (136 mM NaCl, 2.5 mM KCl, 0.2 mM CaCl 2 , 3.1 mM MgCl 2 , 10 mM HEPES and 10 mM Glucose, pH 7.4). Z‐stack images were acquired before and after the treatment. The puncta number per 100 μm 2 and mean intensity of PSVue were measured per ROI using Fiji.
Intracerebroventricular PSVue injection
For in vivo labeling of ePtdSer, 1 mM PSVue® 643 (P‐1006, Molecular Targeting Technologies) was used following the manufacturer's recommendations. Four‐month‐old WT and J20 Tg animals and 6‐month‐old App NL‐F KI and App NL‐F KI; Trem2 R47H KI mice littermates were used. Mice were anesthetized with 4% inhaled Isoflurane (Forane, Abbott Laboratories) and placed in a stereotaxic apparatus (504926, World Precision Instruments Ltd). Anesthesia was maintained at 1.5% in 250 ml/min oxygen flow. Under aseptic conditions, a midline incision was made to reveal the skull. Two holes were drilled in the skull using a 0.8 mm diameter burr (503599, OmniDrill35 Micro Drill, World Precision Instruments Ltd) to allow for bilateral injections into the lateral ventricles. Next, 1.5 μl of sterile PSVue was injected using a 10 μl syringe (NanoFil, World Precision Instruments Ltd) with a fine borosilicate glass capillary (Hamilton) in the following coordinates: 0.5 mm anterior/posterior, ± 1.0 mm lateral, and −2.3 mm dorsal/ventral from bregma (Paxinos and Franklin's The Mouse Brain in Stereotaxic Coordinates, Fourth Edition). Infusion was performed with a Microinjection Syringe Pump (World Precision Instruments Ltd) at a rate of 0.3 μl/min. The needle was kept in this position for an additional 5 min after injection and then retracted slowly to avoid backflow. The incision on the scalp was closed with Vetbond tissue adhesive (3 M). Subcutaneous carprofen (Carprieve, 5 mg/g body weight) and buprenorphine (Vetergesic, 0.1 mg/g body weight) diluted in 0.9% saline were administered peri‐operatively. Twenty‐four hours after injection, the animals were perfused with 4% PFA for histological analysis.
Crude synaptosome preparation
Synaptosomes were prepared from fresh mouse and frozen human postmortem brain tissue provided by the Queen Square Brain Bank for Neurological Disorders and the Newcastle Brain Tissue Resource (see Dataset EV1 for patient information). WT mice aged 2–4 months were used (3–5 animals per preparation). In brief, mice were intracardiac perfused with 10 ml cold PBS. The hippocampi and cortices were dissected on ice. For postmortem human tissue, synaptosomes were prepared from the frontal cortex. Synaptosomes were biochemically isolated as previously described (Sodero et al , 2011 ). Tissue was weighed and homogenized in five volumes of sucrose homogenization buffer (5 mM HEPES pH 7.4, 320 mM sucrose, 1 mM EDTA) using a Dounce homogenizer with 15–20 strokes. The homogenate was centrifuged at 3,000 g for 10 min at 4°C, and the supernatant was saved as total homogenate fraction (THF). The THF was centrifuged again at 14,000 g for 12 min at 4°C, and supernatant was saved as cytosolic fraction. The pellet was carefully resuspended in 550 μl of Krebs‐Ringer buffer (KRB: 10 mM HEPES, pH 7.4, 140 mM NaCl, 5 mM KCl, 5 mM glucose, 1 mM EDTA) and 450 μl of Percoll solution (for a final concentration of 45%). The solution was mixed by gently inverting the tube, and an interface was slowly created with KRB. After centrifugation at 14,000 g for 2 min at 4°C, the synaptosomal fraction was recovered at the surface of the flotation gradient and carefully resuspended in 1 ml of KRB to wash. The synaptosomal preparation was centrifuged at 14,000 g for 1 min at 4°C, after which the pellet was resuspended in KRB. When done on fresh tissue, this protocol yields synaptosomes that are electrically functional for several hours post‐isolation as they can be depolarized and stimulated with KCl and NMDA, respectively. After isolation, a standard BCA protein assay was performed to quantify the amount of protein for subsequent assays. All human samples used in this study were tested for the presence of Aβ on isolated synaptosomes by western blotting as described below to confirm AD pathology status. Results are clearly stated in Dataset EV1 . NDC and AD cases used for our experiments are clearly negative or positive, respectively, for Aβ immunoblotting.
Synthetic humanized Aβ oligomer 40‐S26C dimer treatment
Primary cultures or fresh synaptosomes were treated with 50 nM Aβ oligomer 40‐S26C dimer (018–71, Phoenix) versus PBS control for 1 h in an incubator at 37°C and 5% CO 2 . Experimental procedures were either performed on live cells during the 1‐h window or on fixed cells post‐treatment. Fresh mouse synaptosomes were immediately divided into Eppendorfs at 2–2.5 mg of protein and resuspended in total 1 ml KRB in 50 nM of oAβ 40‐S26C dimer or just buffer and PBS as control and left overnight at 4°C on nutator. Synaptosomes were then centrifuged at 14,000 g for 1 min at 4°C, supernatant was discarded, and synaptosomes were washed in 1 ml PBS, after which they were centrifuged at 14,000 g for 1 min at 4°C to obtain oAβ‐synaptosomes and control synaptosomes. Immunocytochemistry (ICC) Cells and synaptosomes were fixed for 10 min at room temperature (RT) in 4% (w/v) PFA, 4% (w/v) sucrose in PBS, pH 7.4 and subsequently permeabilized with 0.25% Triton X‐100 in PBS for 3 min at RT. The cells were then blocked for 1 h at RT in 10% (w/v) Bovine serum albumin (BSA). Cells and synaptosomes were incubated at 4°C overnight in primary antibodies (1/1000) after which the cells were washed in PBS and incubated with secondary antibodies (1/1000) for 1 h at RT (see Reagents and Tools table for antibody information). The immunostaining of synaptosomes was performed in Eppendorfs with a centrifugation step at 14,000 g for 1 min at every wash step. At the end of the protocol, synaptosomes were resuspended in ProLong Gold Antifade mounting media ( P36930 , Invitrogen) and put through a 1 ml insulin syringe to further homogenize synaptosomes. This solution was then mounted on glass slides (SuperFrost GOLD Adhesion Slides 11976299, Fisher Scientific). For fresh synaptosome labeling of ePtdSer, synaptosomes were left on nutator at RT in PSVue 643 for 1 h after which excess PSVue was centrifuged at 14,000 g for 1 min and washed. Synaptosomes were then fixed for ICC. Synaptosomes conjugation to pHrodo amine‐reactive labels Synaptosomes were conjugated to low‐background pH‐sensitive dyes, which fluoresce brightly upon acidification (pH 4–6) such as in late endosomes and lysosomes using an adapted protocol from (Lehrman et al , 2018 ). pHrodo dyes are photostable allowing for multicolor and long‐term imaging. In brief, pHrodo™ Red, succinimidyl ester ( P36600 ) and pHrodo™ Deep Red Antibody Labeling Kit ( P35355 ) were dissolved as described in the manual. Human postmortem synaptosomes were conjugated to pHrodo red, whereas mouse synaptosomes were conjugated to both pHrodo red and deep red for preferential engulfment studies. One mg of synaptosomes was left at RT on nutator for 2 h in sodium bicarbonate 0.1 M with respective pHrodo at a concentration of 1 mg/ml. After conjugation, synaptosomes were centrifuged at 14,000 g for 1 min, then washed with 1 ml PBS and centrifuged again at 14,000 g for 1 min. Synaptosomes were then resuspended as described by the manufacturer. Next, a standard BCA protein assay was performed on pHrodo‐conjugated synaptosomes to quantify protein concentrations for subsequent engulfment assays. Synaptosomes were then aliquoted, respectively, and stored at −80°C. Prior to engulfment analysis, the degree of pHrodo labeling (DOL) was assessed as described by the manufacturer. In brief, synaptosomes were mixed 1:3 in PBS pH 2 to activate the fluorophores. The relative efficiency of the labeling reaction was determined by measuring the absorbance of the protein at 280 nm and the absorbance of the dye at its excitation maximum using a UV–Vis Spectrophotometer. This was done as a control to ensure that the DOL was similar between pHrodo and treatment paradigms.
Synaptosome electron microscopy
Synaptosome pellet was pooled from the hippocampi and cortices of three wild‐type mice and prepared as described above. The pellet was fixed in 2% glutaraldehyde/1.5% formaldehyde in 0.1 M sodium cacodylate for 30 min. Postfixation, the fix was removed and replaced with 1% osmium/1.5% potassium ferricyanide for 1 h at 4°C. Postosmium treatment the sample was spun down in a microfuge, the osmium solution was removed and the sample washed three times in cacodylate buffer, mixing and centrifuging each time prior to removing the wash buffer. The samples were resuspended in 0.1% tannic acid and then dehydrated in 70, 90, and 100% ethanol. To maintain pellet integrity, a 1:1 mix of propylene oxide and epon resin was added. After 1 h, the tubes were spun for 3 min in the centrifuge and the po:epon mix removed before 100% resin was added. Samples were left overnight in resin to ensure proper infiltration, after which the old resin was removed and replaced with freshly prepared resin. Samples were left for 4 h and transferred to the oven to polymerize overnight. In vitro microglia‐synaptosome engulfment assay For preferential in vitro engulfment assays using mouse synaptosomes, primary mouse microglia were treated with oAβ‐synaptosomes and control synaptosomes. One μg of both control and oAβ‐synaptosomes was added to the same well in microglial media. For engulfment assays using human postmortem synaptosomes, primary mouse microglia were either treated with 1 μg of Alzheimer's disease (AD) or non‐demented control (NDC) synaptosomes in separate wells. Plates were then placed in a cell discoverer 7 (CD7) with the incubator at 37°C and 5% CO 2 . Fluorescent (594 nm and 647 nm) and bright‐field (oblique and phase) images were acquired at a ×20 objective (×0.5) at intervals of 2–5 min. Laser settings were set to the same settings for both red and deep red pHrodo. A 3‐slice z‐stack was taken at 1.5‐μm interval to ensure that imaging was within focus throughout the imaging session; however, one plane was used for analysis. Two ROIs per well were taken with an average of 40 cells per ROI. An imaging session lasted 0–15 h, whereby plateau was reached within the first 6 h, with t = 0 being the addition of synaptosomes. The plateau phase persisted, and a decrease in the pHrodo signal was only observed after 48–72 h. Background subtraction was performed on ImageJ for red and deep red pHrodo at 1 pixel. For analysis, a plug‐in on ImageJ was used, z‐profile axis, which measures intensity of a given channel with respect to time. Fluorescence intensity at t = 0 was subtracted from subsequent time frames. Experimental replicates were analyzed separately. Data were either shown as fluorescence intensity with time, engulfment (area under curve (AUC) at 50% of the peak pHrodo fluorescence intensity), or engulfment ratio. AUC at 50% peak pHrodo intensity for all experiments was approximately at 3 h. For AUC at 50%, pHrodo intensity was normalized to average control. For engulfment ratio, the sum of control and oAβ‐synaptosome fluorescence intensity was added per well and then individually divided by this total sum, to obtain a fraction per well. For dextran engulfment, pHrodo™ Red Dextran, 10,000 MW, for Endocytosis ( P10361 , ThermoFisher) was used following the manufacturer's instructions and imaged on the CD7.
Annexin‐V treatment
Synaptosomes and neuron–microglia co‐cultures were treated with Annexin‐V, a protein that specifically binds to ePtdSer with high affinity, which has been used to mask PtdSer on apoptotic cells to block macrophage phagocytosis (Krahling et al , 1999 ). Synaptosomes were pretreated with either buffer, 1 μg/ml or 10 μg/ml of purified recombinant Annexin V (556416, BD BioSciences, 0.5 mg/ml stock concentration) in 100 μl 1× Annexin‐V binding buffer (556454, BD Biosciences), 0.1 M HEPES (pH 7.4) 1.4 M NaCl, 25 mM CaCl 2 (Annexin‐V binding to ePtdSer is calcium‐dependent) for 1 h at RT. These concentrations have been previously used in literature and suggested by the manufacturer (5–15 μg). Synaptosomes were centrifuged at 14,000 g for 1 min to remove excess Annexin‐V and resuspended in 1× Annexin‐V binding buffer. Control and oAβ‐synaptosomes were pretreated simultaneously in the same Eppendorf, whereas NDC and AD human synaptosomes were pretreated separately. Neuron–microglia co‐cultures were treated with 0.1 μg/ml of Annexin‐V simultaneously with Aβ treatment.
Bafilomycin A1 treatment
Postmicroglia‐synaptosome engulfment assays, 50 nM bafilomycin A1 (B1793, Sigma‐Aldrich), which increases lysosomal pH to 6, was added to microglial wells. Imaging and analysis were performed as described above. Background subtraction was performed at all time points using the intensity at t = 0 (when synaptosomes were added). Data shown as t = 0 when bafilomycin treatment was added. Western blotting A BCA protein assay was used to determine the amount of protein in fractions used for western blot analysis. Twenty–forty micrograms of protein was loaded either on 4–12% Bis‐Tris gels or 10% Tris‐Glycine gels (Thermo Fisher Scientific). Gels were run with appropriate sample buffer and running buffer. Gels were transferred to nitrocellulose membranes using an iBlot 2 Dry Blotting System (Thermo Fisher Scientific) as described by the manufacturer. Prior to blocking, Aβ blots were left in PBS and microwaved at 80% strength for 1 min 30s on each side, allowing for 3 min 30 s to settle after each side to expose the epitope. Blots were blocked in casein PBS (1:1, Biorad) for 30 min at RT on shaker and then probed overnight at 4°C on shaker with primary antibodies (1:1,000) in casein PBS‐T (0.01%). Blots were washed, then probed with secondary antibodies in casein PBS‐T (0.01%) for 1 h at RT on shaker, and then visualized either fluorescently on a ChemiDoC (BioRad) system or with HRP‐substrate on an Amersham Imager 680 (Bioke) system. Immunohistochemistry (IHC) IHC was performed on brain slices from mice transcardially perfused with 4% PFA and postfixed for 24 h. Thirty micrometers free‐floating tissue sections were washed in PBS on a perturbator followed by pretreatment in 1% Triton X‐100 in PBS for 20 min, rinsed in PBS for 5 min, and treated with 0.3% Triton X‐100. Blocking solution and primary and secondary antibody mixtures were centrifuged at 17,000 g for 5 min just before use. Sections were then blocked in 20% NGS, 1% BSA, and 0.3% Triton in PBS for synapse IHC or in 10% NGS, 10% FBS, 1% BSA, and 0.3% Triton in PBS for microglial engulfment IHC for 2 h followed by primary antibody incubation overnight at 4°C. Sections were washed in PBS for 10 min, 0.3% Triton X‐100 in PBS for 30 min, followed by secondary antibody incubation for 4 h at room temperature. See Reagents and Tools table for antibody information. Sections were then washed in PBS for 10 min, incubated in 1:10,000 DAPI in PBS for 10 min, and washed in 0.3% Triton for 15 min. Finally, sections were mounted onto slides with ProLong Glass mounting medium and procured for at least 48 h before imaging. IHC of PSVue‐labeled tissue was as described above, with the following substitutions: TBS instead of PBS; Alexa Fluor 546 goat anti‐rabbit instead of Alexa Fluor 594 goat anti‐rabbit. In situ hybridization (RNAScope) RNAScope was performed following the manufacturer's instructions using the RNAscope Fluorescent Multiplex Assay (ACDBio, 320293). The following probes were purchased from the manufacturer: Tmem119 (472901‐C3), C1qa (441221‐C2), and Clec7a (532061‐C1). In brief, mice were perfused with 4% PFA and the brains were postfixed in 4% for 24 h. Twelve‐μm‐thick sections were mounted on Superfrost Plus GOLD Slides (Thermo Fisher Scientific, K5800AMNZ72). The slides were incubated in H 2 O 2 for 4 min at RT and washed in RNAse‐free water. Slides were then placed in boiling target antigen retrieval for 4 min, dehydrated in 100% ethanol for 5 min, and treated with Protease Plus for 15 min at RT before probe hybridization for 2 h at 40°C. For IHC staining post‐RNAScope, the slides were blocked in 2% serum 0.01% Triton X for 30 min and then incubated with the primary antibodies (1/100) overnight at 4°C. The following day, the slides were washed and incubated with the secondary antibodies for 2 h at RT. The blocking buffer was used to dilute the antibodies. Slides were then incubated with DAPI and mounted. In vivo microglial engulfment imaging and analysis Images were acquired on a Zeiss LSM 800 confocal microscope using 63× magnification. Frame size of 2,048 × 2,048 was used for all images. Eleven micrometer Z‐stack was acquired with a voxel size of 0.05 × 0.05 × 0.220 μm 3 . Three regions of interest were acquired in the hippocampal CA1 stratum radiatum per section, and three sections were analyzed per brain. Images were first processed with ImageJ using background subtraction. Imaris 3D surface rendering was used to first create a surface on the P2Y12 channel. Subsequently, CD68 channel was masked to the P2Y12 surface to obtain only CD68 within the analyzed cell. A surface was created on the CD68 masked channel, and a volume filter of > 0.01 μm 3 was applied. Homer1 channel was then masked to the CD68 surface to obtain Homer1 inside CD68 + vesicles, and a surface was created on this masked Homer1 channel. Homer1 surfaces of volume smaller than 0.001 μm 3 were filtered out and not included in the analysis. Volume of thus obtained Homer1‐immunoreactive puncta was then normalized per cell volume to account for variance due to difference in cell size. Imaris 3D surface function algorithm settings were the following for all channels: “Shortest distance calculation,” “Absolute intensity,” and grain size of 0.1 μm were used. The threshold values were adjusted to optimize visualization of individual channels and varied between channels, but were kept constant within a channel for all images analyzed. Data shown as engulfment index: (volume of Homer1 in CD68/microglial cell volume) * 100.
Super‐resolution imaging and analysis
Super‐resolution synapse images were acquired on a Zeiss LSM 880 microscope with Airyscan detector using a 63×, 1.4NA oil immersion Plan‐Apochromat objective (theoretical maximum resolution: 140 nm lateral, 350 nm axial). A zoom factor of 1.8× and frame size of 2,048 × 2,048 was used for all images, resulting in an XY pixel size of 37 nm. Z‐step size was 144 nm, with eight steps per Z‐stack, resulting in a stack thickness of 1.15 μm. Scan speed was 5, line averaging 2, gain 800, and digital gain 1. A laser power of ~0.15 and ~0.45% was used for the 488 and 594 nm lasers, respectively. The Airyscan detector was aligned before imaging each new slide. Three regions of interest were acquired in the center of the hippocampal CA1 stratum radiatum for each brain section. Super‐resolution synapse images were processed in Zen Black using 3D Airyscan Processing at strength 6.0. Synapse quantification method was adapted from Hong et al , 2017 . Images exhibiting drift or anomalous staining were excluded from analysis. Imaris software was used for pre‐ and postsynaptic puncta detection. Channel brightness was adjusted to maximize the visualization of immunoreactive puncta. The spot detection function was used to generate spots, with region growing, shortest distance calculation, and background subtraction enabled. Spots size was selected to maximize the detection of immunoreactive puncta (XY diameter 0.15 μm, Z diameter 0.45 μm, for both Homer1 and Synaptotagmin 1/2 puncta). Spots were classified using the “Intensity Center” filter. The threshold value was selected to maximize the detection of immunoreactive puncta. The threshold value varied between channels and immunostainings but was kept consistent between pairs of images that were compared. Local contrast was used to define the spot growth boundary, using a value that appropriately reflected the immunoreactive signal of the source channel. A volume filter was then applied to remove spots smaller than 0.005 μm 3 . Pre‐ and postsynaptic spots were colocalized using a MATLAB colocalization script (Colocalize Spots XTension), using a colocalization distance of 0.25 μm between spot centers. Synapse density is shown as App NL‐F KI mice normalized to WT mice, and App NL‐F KI; Trem2 R47H KI normalized to Trem2 R47H KI mice. PSVue‐labeled synapse images were acquired on a Leica Stellaris STED microscope using a 100×, 1.4NA oil immersion Plan‐Apochromat objective. A zoom factor of 2× and frame size of 2,048 × 2,048 was used for all images, resulting in an XY pixel size of 29 nm. Z‐step size was 200 nm, with 11 steps per Z‐stack, resulting in a stack thickness of 2.2 μm. Images were acquired in Photon Counting mode with a scan speed of 600 Hz and line accumulation 8. A laser power of 5, 5, and 10% was used for the 499, 557, and 653 nm lasers, respectively. Three regions of interest were acquired in the center of the hippocampal dentate gyrus hilus for each brain section. Confocal images of PSVue‐labeled synapses were deconvolved using Leica's LIGHTNING deconvolution. Imaris was used for pre‐ and postsynaptic puncta detection as described above. The surface function was then used to generate volumes representing the PSVue signal. Pre‐ and postsynaptic spots within 0.25 μm of a PSVue surface were determined using a MATLAB colocalization script (Spots Close To Surface XTension).
Statistics
Data curation of image analysis was performed by investigators blinded to the genotype or treatment of animals/cultures. Statistical tests were performed using GraphPad Prism 9.0 (GraphPad Software) as appropriate. Data points are shown as ROIs and average or median per experimental replicate (either per animal or culture preparation) where applicable. Statistical tests have been performed per animal for mouse studies and per experimental replicate for cell culture studies, with the exception of GCaMP studies which are done per individual spine in accordance with the field's standards.
Data shown as mean ±
SEM or SD. P ‐values shown as not significant (ns) P > 0.05; * P < 0.05; ** P < 0.01; *** P < 0.001; **** P < 0.0001. Statistical tests and data representation are stated in the figure legends.
Methods and Protocols Animals
All experiments have been reviewed by UCL's animal care committees and conducted in accordance with the regulations set out in the Animals in Scientific Procedures Act (ASPA) 1986. Sprague Dawley rats obtained from Charles River UK and Homer1‐eGFP (Ebihara et al , 2003 ) obtained from Japan (kind gift from S. Okabe) were used for primary neuronal cultures at embryonic day (E18). C57BL6/J (WT) mice obtained from Charles River UK and Trem2 R47H KI mice (imported from JAX, C57BL/6J‐ Trem2 em1Adiuj/J Strain #027918) were used for primary microglial culture preparation at P0‐P4.
App NL‐F KI mice
(Saito et al , 2014 ; kindly provided by Takaomi Saido, Riken and distributed by Frances Edwards, UCL) were crossed to Trem2 R47H KI mice for in vivo labeling of lipids, synapse loss, and microglial engulfment studies. APP transgenic J20 mice (kindly provided by Lennart Mucke and distributed by Patricia Salinas, UCL) were used at age 3 months for in vivo labeling of lipids. For all experiments, appropriate sex‐ and age‐matched controls were used. For App NL‐F KI and Trem2 R47H KI genotype, homozygous mice were used; for Homer1‐eGFP, heterozygous mice were used.
Primary neuronal culture
Primary hippocampal neurons were prepared as previously described (Lee et al , 2016 ) from E18 Sprague Dawley rats and Homer1‐eGFP mice of either sex ( n = 10–15 pups per preparation). Briefly, hippocampi were dissected, dissociated with papain, and triturated with a polished half‐bore pasteur pipette. Next, cells were resuspended in Hank's Balanced Salt Solution (HBSS; HyClone, Logan, UT) supplemented with 0.6% glucose, 1 mM pyruvate, 2 mM GlutaMAX (Gibco), and 10% FBS (HyClone) and plated on Poly‐D‐lysine (PDL)‐coated glass coverslips in a 60‐mm Petri dish or 35 mm glass‐bottom culture dish (81158, ibidi). Four hours after plating, the medium was replaced with neurobasal medium (Invitrogen) supplemented with 2% (v/v) B‐27 (Invitrogen), 0.5 mM GlutaMAX. Half of the medium was replaced by a new neurobasal media with B‐27 and L‐glutamine at DIV 4, 7 and 14. Four mM 1‐β‐D‐cytosine‐arabinofuranoside (Ara‐C; Sigma) was added as needed. Cells were maintained in an incubator at 37°C and 5% CO 2 and used at DIV 17–21 for experimental procedures.
Primary neuron GCaMP7 transfection
Neurons were transfected using a modified calcium‐phosphate method as previously described (Lee et al , 2016 ) using a pAAV‐syn‐jGCaMP7c‐WPRE plasmid (Addgene). Briefly, 6 μg of DNA and 9.3 μl of 2 M CaCl 2 were mixed in distilled water to a total volume of 75 μl and the same volume of 2× BBS [50 mM BES, 280 mM NaCl, and 1.5 mM Na 2 HPO 4 (pH 7.1)] was added. The cell culture medium was completely replaced by transfection medium (MEM; 1 mM sodium pyruvate, 0.6% glucose, 10 mM HEPES, 1 mM Kynurenic acid, and 10 mM MgCl 2 , pH 7.71), and the DNA mixture was added to the cells and incubated in a 5% CO 2 incubator for 60 min. Cells were washed with a washing medium (pH 7.30) and then returned to the original culture medium. Neurons were transfected at DIV 8–9 and analyzed at DIV 16–21. pAAV‐syn‐jGCaMP7c‐WPRE plasmid was purchased from Addgene.
Primary microglial culture preparation
Primary mouse WT and Trem2 R47H KI microglial cultures were prepared at P0‐P4 mice from either sex ( n = 8–10 pups per preparation). Mouse brains were dissected in cold HBSS on ice, and the cortices and hippocampi were isolated. Tissue was homogenized with 2 ml stripette (15 strokes). Next, the homogenate was put through a pre‐wet 70 μM strainer and centrifuged at 400 g for 5 min at 4°C. The supernatant was removed, and the cell pellet was resuspended in ice‐cold 35% isotonic percoll. The interface was carefully created with HBSS. The samples were centrifuged for 40 min at 4°C at 2,800 g with no break and with slow acceleration and deceleration. The myelin layer and supernatant was aspirated, and the cell pellet was washed in HBSS. The cells were centrifuged for 5 min at 4°C and 400 g . The supernatant was removed, and cells were resuspended in 1 ml microglial media (DMEM F12 Gibco, 5% fetal bovine serum Gibco, 1% pen‐strep Gibco, 50 ng/ml CSF1 416‐ML‐010/CF RnD Systems, 50 ng/ml TGFb1 7666‐MB‐005/CF RnD Systems, and 100 ng/ml CX3CL1 472‐FF‐025/CF RnD Systems) for cell counting. Cells were plated in borate buffer 0.1 M pH 8.5 PDL (Gibco)‐coated 12‐well plates (CC7682‐7512, Starlab) in 1 ml of microglial media at a density of 650,000 per well. Cells were maintained in an incubator at 37°C and 5% CO 2 . Ninety percent of media was changed the day after, and subsequently half of the media was changed every 2 days. Primary microglial cells are supplemented with TGFβ, which has been shown to imprint key microglial signature genes such as Tmem119 (Butovsky et al , 2014 ). Additionally, mCSF is added to the media to stimulate microglial survival and fractalkine as the ligand for the key microglial homeostatic receptor, CX3CR1. The combination of TGFβ, mCSF, and fractalkine is used to mimic a more homeostatic in vivo ‐like profile of microglia as shown by high levels of Tmem119 mRNA in Cx3cr1 + Trem2 + Itgam + primary microglial cells (Fig EV1C ). RNA isolation, reverse transcription, and RT–qPCR Primary microglial cells were lysed and scraped off using TRIzol reagent (15596026, Invitrogen) after which chloroform was added to separate the homogenate layers. RNA was precipitated from the aqueous layer using 2‐propranolol and then washed with ethanol. The RNA pellet was resuspended in nucleus‐free‐water after which RNA purity and concentration was assessed by Nanodrop. mRNA was converted to cDNA using the qScript cDNA SuperMix reverse transcription kit as described by the manufacturer (95048, Quantabio). For RT–qPCR, 12 ng of cDNA was loaded in triplicates per gene in a total volume of 20 μl using the SYBR green PCR master mix as described by the manufacturer (4309155, ThermoFisher). The reaction was run using a LightCycler 96 Instrument (Roche) with white 96‐well plates (04729692001, Roche). Triplicate Ct values were averaged, and data are shown as respective to the geomean of three housekeeping genes ( Actb , Gapdh , Rpl32 ) using the Ct delta method (2 −∆∆Ct ). Primers purchased from IDT were used at a concentration of 200 nM, see Reagents and Tools table for sequences. Neuron–microglia co‐culture Primary microglia at DIV 7 were detached with ice‐cold PBS and centrifuged for 5 min at 4°C and 400 g . The supernatant was removed, and cells were resuspended in 1 ml neuron culture media supplemented with CSF1, TGFβ1, and CX3CL1. Cells were plated on the DIV 14 neurons at the ratio of 2:1. Cells were co‐incubated in an incubator at 37°C and 5% CO 2 for 7 days before analysis.
Neuronal calcium imaging
To measure neuronal spontaneous calcium activity, GCaMP7‐expressing primary neurons cultured with or without microglia were assessed using a spinning disk confocal microscope (ECLIPSE Ti‐E, Nikon) with a Plan Apo 60×/NA 1.40 oil objective and a Neo sCMOS camera (Andor Technology) at 37°C. Time‐lapse images were acquired every 100 ms for 1 min. First, regions of interest (ROIs) were drawn around individual dendritic spines, and then, relative fluorescence change (Δ F / F 0 ) versus time traces were generated for each ROI. Ca 2+ transients were identified as changes in Δ F / F 0 that were larger than 10% of the baseline intensity 0 .
Live‐cell labeling
For live‐cell labeling of externalized phosphatidylserine (ePtdSer), 1 mM PSVue® 550 (P‐1005, Molecular Targeting Technologies; prepared following the manufacturer's instructions) was diluted in Tyrode's solution (136 mM NaCl, 2.5 mM KCl, 2 mM CaCl 2 , 1.3 mM MgCl 2 , 10 mM HEPES and 10 mM Glucose, pH 7.4) at 1:1,000 and incubated for 10 min before imaging. For live‐cell microglial labeling, fluorescent conjugated plant lectin Griffonia (Bandeiraea) simplicifolia lectin I, Isolectin GS‐IB 4 ‐647 (IB4; I32450 , ThermoFisher) was diluted in Tyrode's solution at 1/1000 and incubated for 10 min before imaging. IB4 binds selectively to microglial RET receptor tyrosine kinase and is commonly used as a microglial marker in the brain.
High‐resolution cell imaging and analysis
Airyscan live‐cell images were acquired with a laser scanning LSM880 Airyscan microscope, using a Plan APO 20X/NA 0.8 objective (Zeiss). Emission filter bandwidths and sequential scanning acquisition were set up, to avoid any possible spectral overlap between fluorophores with 37°C and 5% CO 2 maintained. 3D time‐lapse images were acquired in z‐stack step size 800 nm × 15 steps every 2 min for 1 h and subsequently processed using Imaris software (Bitplane). PSVue + Homer1‐GFP inside the microglia were identified by masking PSVue colocalized Homer1 with IB4 surface. For Homer1‐eGFP and PSVue colocalization analysis, z‐stack images were acquired on a LSM880 Airyscan microscope using 63×/NA 1.40 objective with 0.3 μm z‐steps. The percentage of Homer1 and PSVue colocalization was calculated for every z‐step using Fiji (NIH software). For quantification of preferential contact and engulfment of Homer1‐eGFP + PSVue + dendritic spines by microglia, ROIs with mobile Homer1‐eGFP puncta within 5 μm from microglial were selected and the ratio of colocalization with PSVue was analyzed. For quantification of PSVue‐level postfixation of neuron‐only and co‐cultured neurons with microglia in GCaMP7 experiments, z‐stack images were acquired on a LSM980 Airyscan microscope using 63×/NA 1.40 objective with 0.17 μm z‐steps. The puncta number per 100 μm 2 and mean intensity of PSVue were measured per ROI using Fiji (NIH software). For quantification of PtdSer externalization dependent on depolarization and calcium transients, PSVue‐labeled primary neurons were treated with 30 mM KCl or 50 nM oAβ in normal or low‐calcium Tyrode's solution (136 mM NaCl, 2.5 mM KCl, 0.2 mM CaCl 2 , 3.1 mM MgCl 2 , 10 mM HEPES and 10 mM Glucose, pH 7.4). Z‐stack images were acquired before and after the treatment. The puncta number per 100 μm 2 and mean intensity of PSVue were measured per ROI using Fiji.
Intracerebroventricular PSVue injection
For in vivo labeling of ePtdSer, 1 mM PSVue® 643 (P‐1006, Molecular Targeting Technologies) was used following the manufacturer's recommendations. Four‐month‐old WT and J20 Tg animals and 6‐month‐old App NL‐F KI and App NL‐F KI; Trem2 R47H KI mice littermates were used. Mice were anesthetized with 4% inhaled Isoflurane (Forane, Abbott Laboratories) and placed in a stereotaxic apparatus (504926, World Precision Instruments Ltd). Anesthesia was maintained at 1.5% in 250 ml/min oxygen flow. Under aseptic conditions, a midline incision was made to reveal the skull. Two holes were drilled in the skull using a 0.8 mm diameter burr (503599, OmniDrill35 Micro Drill, World Precision Instruments Ltd) to allow for bilateral injections into the lateral ventricles. Next, 1.5 μl of sterile PSVue was injected using a 10 μl syringe (NanoFil, World Precision Instruments Ltd) with a fine borosilicate glass capillary (Hamilton) in the following coordinates: 0.5 mm anterior/posterior, ± 1.0 mm lateral, and −2.3 mm dorsal/ventral from bregma (Paxinos and Franklin's The Mouse Brain in Stereotaxic Coordinates, Fourth Edition). Infusion was performed with a Microinjection Syringe Pump (World Precision Instruments Ltd) at a rate of 0.3 μl/min. The needle was kept in this position for an additional 5 min after injection and then retracted slowly to avoid backflow. The incision on the scalp was closed with Vetbond tissue adhesive (3 M). Subcutaneous carprofen (Carprieve, 5 mg/g body weight) and buprenorphine (Vetergesic, 0.1 mg/g body weight) diluted in 0.9% saline were administered peri‐operatively. Twenty‐four hours after injection, the animals were perfused with 4% PFA for histological analysis.
Crude synaptosome preparation
Synaptosomes were prepared from fresh mouse and frozen human postmortem brain tissue provided by the Queen Square Brain Bank for Neurological Disorders and the Newcastle Brain Tissue Resource (see Dataset EV1 for patient information). WT mice aged 2–4 months were used (3–5 animals per preparation). In brief, mice were intracardiac perfused with 10 ml cold PBS. The hippocampi and cortices were dissected on ice. For postmortem human tissue, synaptosomes were prepared from the frontal cortex. Synaptosomes were biochemically isolated as previously described (Sodero et al , 2011 ). Tissue was weighed and homogenized in five volumes of sucrose homogenization buffer (5 mM HEPES pH 7.4, 320 mM sucrose, 1 mM EDTA) using a Dounce homogenizer with 15–20 strokes. The homogenate was centrifuged at 3,000 g for 10 min at 4°C, and the supernatant was saved as total homogenate fraction (THF). The THF was centrifuged again at 14,000 g for 12 min at 4°C, and supernatant was saved as cytosolic fraction. The pellet was carefully resuspended in 550 μl of Krebs‐Ringer buffer (KRB: 10 mM HEPES, pH 7.4, 140 mM NaCl, 5 mM KCl, 5 mM glucose, 1 mM EDTA) and 450 μl of Percoll solution (for a final concentration of 45%). The solution was mixed by gently inverting the tube, and an interface was slowly created with KRB. After centrifugation at 14,000 g for 2 min at 4°C, the synaptosomal fraction was recovered at the surface of the flotation gradient and carefully resuspended in 1 ml of KRB to wash. The synaptosomal preparation was centrifuged at 14,000 g for 1 min at 4°C, after which the pellet was resuspended in KRB. When done on fresh tissue, this protocol yields synaptosomes that are electrically functional for several hours post‐isolation as they can be depolarized and stimulated with KCl and NMDA, respectively. After isolation, a standard BCA protein assay was performed to quantify the amount of protein for subsequent assays. All human samples used in this study were tested for the presence of Aβ on isolated synaptosomes by western blotting as described below to confirm AD pathology status. Results are clearly stated in Dataset EV1 . NDC and AD cases used for our experiments are clearly negative or positive, respectively, for Aβ immunoblotting.
Synthetic humanized Aβ oligomer 40‐S26C dimer treatment
Primary cultures or fresh synaptosomes were treated with 50 nM Aβ oligomer 40‐S26C dimer (018–71, Phoenix) versus PBS control for 1 h in an incubator at 37°C and 5% CO 2 . Experimental procedures were either performed on live cells during the 1‐h window or on fixed cells post‐treatment. Fresh mouse synaptosomes were immediately divided into Eppendorfs at 2–2.5 mg of protein and resuspended in total 1 ml KRB in 50 nM of oAβ 40‐S26C dimer or just buffer and PBS as control and left overnight at 4°C on nutator. Synaptosomes were then centrifuged at 14,000 g for 1 min at 4°C, supernatant was discarded, and synaptosomes were washed in 1 ml PBS, after which they were centrifuged at 14,000 g for 1 min at 4°C to obtain oAβ‐synaptosomes and control synaptosomes. Immunocytochemistry (ICC) Cells and synaptosomes were fixed for 10 min at room temperature (RT) in 4% (w/v) PFA, 4% (w/v) sucrose in PBS, pH 7.4 and subsequently permeabilized with 0.25% Triton X‐100 in PBS for 3 min at RT. The cells were then blocked for 1 h at RT in 10% (w/v) Bovine serum albumin (BSA). Cells and synaptosomes were incubated at 4°C overnight in primary antibodies (1/1000) after which the cells were washed in PBS and incubated with secondary antibodies (1/1000) for 1 h at RT (see Reagents and Tools table for antibody information). The immunostaining of synaptosomes was performed in Eppendorfs with a centrifugation step at 14,000 g for 1 min at every wash step. At the end of the protocol, synaptosomes were resuspended in ProLong Gold Antifade mounting media ( P36930 , Invitrogen) and put through a 1 ml insulin syringe to further homogenize synaptosomes. This solution was then mounted on glass slides (SuperFrost GOLD Adhesion Slides 11976299, Fisher Scientific). For fresh synaptosome labeling of ePtdSer, synaptosomes were left on nutator at RT in PSVue 643 for 1 h after which excess PSVue was centrifuged at 14,000 g for 1 min and washed. Synaptosomes were then fixed for ICC. Synaptosomes conjugation to pHrodo amine‐reactive labels Synaptosomes were conjugated to low‐background pH‐sensitive dyes, which fluoresce brightly upon acidification (pH 4–6) such as in late endosomes and lysosomes using an adapted protocol from (Lehrman et al , 2018 ). pHrodo dyes are photostable allowing for multicolor and long‐term imaging. In brief, pHrodo™ Red, succinimidyl ester ( P36600 ) and pHrodo™ Deep Red Antibody Labeling Kit ( P35355 ) were dissolved as described in the manual. Human postmortem synaptosomes were conjugated to pHrodo red, whereas mouse synaptosomes were conjugated to both pHrodo red and deep red for preferential engulfment studies. One mg of synaptosomes was left at RT on nutator for 2 h in sodium bicarbonate 0.1 M with respective pHrodo at a concentration of 1 mg/ml. After conjugation, synaptosomes were centrifuged at 14,000 g for 1 min, then washed with 1 ml PBS and centrifuged again at 14,000 g for 1 min. Synaptosomes were then resuspended as described by the manufacturer. Next, a standard BCA protein assay was performed on pHrodo‐conjugated synaptosomes to quantify protein concentrations for subsequent engulfment assays. Synaptosomes were then aliquoted, respectively, and stored at −80°C. Prior to engulfment analysis, the degree of pHrodo labeling (DOL) was assessed as described by the manufacturer. In brief, synaptosomes were mixed 1:3 in PBS pH 2 to activate the fluorophores. The relative efficiency of the labeling reaction was determined by measuring the absorbance of the protein at 280 nm and the absorbance of the dye at its excitation maximum using a UV–Vis Spectrophotometer. This was done as a control to ensure that the DOL was similar between pHrodo and treatment paradigms.
Synaptosome electron microscopy
Synaptosome pellet was pooled from the hippocampi and cortices of three wild‐type mice and prepared as described above. The pellet was fixed in 2% glutaraldehyde/1.5% formaldehyde in 0.1 M sodium cacodylate for 30 min. Postfixation, the fix was removed and replaced with 1% osmium/1.5% potassium ferricyanide for 1 h at 4°C. Postosmium treatment the sample was spun down in a microfuge, the osmium solution was removed and the sample washed three times in cacodylate buffer, mixing and centrifuging each time prior to removing the wash buffer. The samples were resuspended in 0.1% tannic acid and then dehydrated in 70, 90, and 100% ethanol. To maintain pellet integrity, a 1:1 mix of propylene oxide and epon resin was added. After 1 h, the tubes were spun for 3 min in the centrifuge and the po:epon mix removed before 100% resin was added. Samples were left overnight in resin to ensure proper infiltration, after which the old resin was removed and replaced with freshly prepared resin. Samples were left for 4 h and transferred to the oven to polymerize overnight. In vitro microglia‐synaptosome engulfment assay For preferential in vitro engulfment assays using mouse synaptosomes, primary mouse microglia were treated with oAβ‐synaptosomes and control synaptosomes. One μg of both control and oAβ‐synaptosomes was added to the same well in microglial media. For engulfment assays using human postmortem synaptosomes, primary mouse microglia were either treated with 1 μg of Alzheimer's disease (AD) or non‐demented control (NDC) synaptosomes in separate wells. Plates were then placed in a cell discoverer 7 (CD7) with the incubator at 37°C and 5% CO 2 . Fluorescent (594 nm and 647 nm) and bright‐field (oblique and phase) images were acquired at a ×20 objective (×0.5) at intervals of 2–5 min. Laser settings were set to the same settings for both red and deep red pHrodo. A 3‐slice z‐stack was taken at 1.5‐μm interval to ensure that imaging was within focus throughout the imaging session; however, one plane was used for analysis. Two ROIs per well were taken with an average of 40 cells per ROI. An imaging session lasted 0–15 h, whereby plateau was reached within the first 6 h, with t = 0 being the addition of synaptosomes. The plateau phase persisted, and a decrease in the pHrodo signal was only observed after 48–72 h. Background subtraction was performed on ImageJ for red and deep red pHrodo at 1 pixel. For analysis, a plug‐in on ImageJ was used, z‐profile axis, which measures intensity of a given channel with respect to time. Fluorescence intensity at t = 0 was subtracted from subsequent time frames. Experimental replicates were analyzed separately. Data were either shown as fluorescence intensity with time, engulfment (area under curve (AUC) at 50% of the peak pHrodo fluorescence intensity), or engulfment ratio. AUC at 50% peak pHrodo intensity for all experiments was approximately at 3 h. For AUC at 50%, pHrodo intensity was normalized to average control. For engulfment ratio, the sum of control and oAβ‐synaptosome fluorescence intensity was added per well and then individually divided by this total sum, to obtain a fraction per well. For dextran engulfment, pHrodo™ Red Dextran, 10,000 MW, for Endocytosis ( P10361 , ThermoFisher) was used following the manufacturer's instructions and imaged on the CD7.
Annexin‐V treatment
Synaptosomes and neuron–microglia co‐cultures were treated with Annexin‐V, a protein that specifically binds to ePtdSer with high affinity, which has been used to mask PtdSer on apoptotic cells to block macrophage phagocytosis (Krahling et al , 1999 ). Synaptosomes were pretreated with either buffer, 1 μg/ml or 10 μg/ml of purified recombinant Annexin V (556416, BD BioSciences, 0.5 mg/ml stock concentration) in 100 μl 1× Annexin‐V binding buffer (556454, BD Biosciences), 0.1 M HEPES (pH 7.4) 1.4 M NaCl, 25 mM CaCl 2 (Annexin‐V binding to ePtdSer is calcium‐dependent) for 1 h at RT. These concentrations have been previously used in literature and suggested by the manufacturer (5–15 μg). Synaptosomes were centrifuged at 14,000 g for 1 min to remove excess Annexin‐V and resuspended in 1× Annexin‐V binding buffer. Control and oAβ‐synaptosomes were pretreated simultaneously in the same Eppendorf, whereas NDC and AD human synaptosomes were pretreated separately. Neuron–microglia co‐cultures were treated with 0.1 μg/ml of Annexin‐V simultaneously with Aβ treatment.
Bafilomycin A1 treatment
Postmicroglia‐synaptosome engulfment assays, 50 nM bafilomycin A1 (B1793, Sigma‐Aldrich), which increases lysosomal pH to 6, was added to microglial wells. Imaging and analysis were performed as described above. Background subtraction was performed at all time points using the intensity at t = 0 (when synaptosomes were added). Data shown as t = 0 when bafilomycin treatment was added. Western blotting A BCA protein assay was used to determine the amount of protein in fractions used for western blot analysis. Twenty–forty micrograms of protein was loaded either on 4–12% Bis‐Tris gels or 10% Tris‐Glycine gels (Thermo Fisher Scientific). Gels were run with appropriate sample buffer and running buffer. Gels were transferred to nitrocellulose membranes using an iBlot 2 Dry Blotting System (Thermo Fisher Scientific) as described by the manufacturer. Prior to blocking, Aβ blots were left in PBS and microwaved at 80% strength for 1 min 30s on each side, allowing for 3 min 30 s to settle after each side to expose the epitope. Blots were blocked in casein PBS (1:1, Biorad) for 30 min at RT on shaker and then probed overnight at 4°C on shaker with primary antibodies (1:1,000) in casein PBS‐T (0.01%). Blots were washed, then probed with secondary antibodies in casein PBS‐T (0.01%) for 1 h at RT on shaker, and then visualized either fluorescently on a ChemiDoC (BioRad) system or with HRP‐substrate on an Amersham Imager 680 (Bioke) system. Immunohistochemistry (IHC) IHC was performed on brain slices from mice transcardially perfused with 4% PFA and postfixed for 24 h. Thirty micrometers free‐floating tissue sections were washed in PBS on a perturbator followed by pretreatment in 1% Triton X‐100 in PBS for 20 min, rinsed in PBS for 5 min, and treated with 0.3% Triton X‐100. Blocking solution and primary and secondary antibody mixtures were centrifuged at 17,000 g for 5 min just before use. Sections were then blocked in 20% NGS, 1% BSA, and 0.3% Triton in PBS for synapse IHC or in 10% NGS, 10% FBS, 1% BSA, and 0.3% Triton in PBS for microglial engulfment IHC for 2 h followed by primary antibody incubation overnight at 4°C. Sections were washed in PBS for 10 min, 0.3% Triton X‐100 in PBS for 30 min, followed by secondary antibody incubation for 4 h at room temperature. See Reagents and Tools table for antibody information. Sections were then washed in PBS for 10 min, incubated in 1:10,000 DAPI in PBS for 10 min, and washed in 0.3% Triton for 15 min. Finally, sections were mounted onto slides with ProLong Glass mounting medium and procured for at least 48 h before imaging. IHC of PSVue‐labeled tissue was as described above, with the following substitutions: TBS instead of PBS; Alexa Fluor 546 goat anti‐rabbit instead of Alexa Fluor 594 goat anti‐rabbit. In situ hybridization (RNAScope) RNAScope was performed following the manufacturer's instructions using the RNAscope Fluorescent Multiplex Assay (ACDBio, 320293). The following probes were purchased from the manufacturer: Tmem119 (472901‐C3), C1qa (441221‐C2), and Clec7a (532061‐C1). In brief, mice were perfused with 4% PFA and the brains were postfixed in 4% for 24 h. Twelve‐μm‐thick sections were mounted on Superfrost Plus GOLD Slides (Thermo Fisher Scientific, K5800AMNZ72). The slides were incubated in H 2 O 2 for 4 min at RT and washed in RNAse‐free water. Slides were then placed in boiling target antigen retrieval for 4 min, dehydrated in 100% ethanol for 5 min, and treated with Protease Plus for 15 min at RT before probe hybridization for 2 h at 40°C. For IHC staining post‐RNAScope, the slides were blocked in 2% serum 0.01% Triton X for 30 min and then incubated with the primary antibodies (1/100) overnight at 4°C. The following day, the slides were washed and incubated with the secondary antibodies for 2 h at RT. The blocking buffer was used to dilute the antibodies. Slides were then incubated with DAPI and mounted. In vivo microglial engulfment imaging and analysis Images were acquired on a Zeiss LSM 800 confocal microscope using 63× magnification. Frame size of 2,048 × 2,048 was used for all images. Eleven micrometer Z‐stack was acquired with a voxel size of 0.05 × 0.05 × 0.220 μm 3 . Three regions of interest were acquired in the hippocampal CA1 stratum radiatum per section, and three sections were analyzed per brain. Images were first processed with ImageJ using background subtraction. Imaris 3D surface rendering was used to first create a surface on the P2Y12 channel. Subsequently, CD68 channel was masked to the P2Y12 surface to obtain only CD68 within the analyzed cell. A surface was created on the CD68 masked channel, and a volume filter of > 0.01 μm 3 was applied. Homer1 channel was then masked to the CD68 surface to obtain Homer1 inside CD68 + vesicles, and a surface was created on this masked Homer1 channel. Homer1 surfaces of volume smaller than 0.001 μm 3 were filtered out and not included in the analysis. Volume of thus obtained Homer1‐immunoreactive puncta was then normalized per cell volume to account for variance due to difference in cell size. Imaris 3D surface function algorithm settings were the following for all channels: “Shortest distance calculation,” “Absolute intensity,” and grain size of 0.1 μm were used. The threshold values were adjusted to optimize visualization of individual channels and varied between channels, but were kept constant within a channel for all images analyzed. Data shown as engulfment index: (volume of Homer1 in CD68/microglial cell volume) * 100.
Super‐resolution imaging and analysis
Super‐resolution synapse images were acquired on a Zeiss LSM 880 microscope with Airyscan detector using a 63×, 1.4NA oil immersion Plan‐Apochromat objective (theoretical maximum resolution: 140 nm lateral, 350 nm axial). A zoom factor of 1.8× and frame size of 2,048 × 2,048 was used for all images, resulting in an XY pixel size of 37 nm. Z‐step size was 144 nm, with eight steps per Z‐stack, resulting in a stack thickness of 1.15 μm. Scan speed was 5, line averaging 2, gain 800, and digital gain 1. A laser power of ~0.15 and ~0.45% was used for the 488 and 594 nm lasers, respectively. The Airyscan detector was aligned before imaging each new slide. Three regions of interest were acquired in the center of the hippocampal CA1 stratum radiatum for each brain section. Super‐resolution synapse images were processed in Zen Black using 3D Airyscan Processing at strength 6.0. Synapse quantification method was adapted from Hong et al , 2017 . Images exhibiting drift or anomalous staining were excluded from analysis. Imaris software was used for pre‐ and postsynaptic puncta detection. Channel brightness was adjusted to maximize the visualization of immunoreactive puncta. The spot detection function was used to generate spots, with region growing, shortest distance calculation, and background subtraction enabled. Spots size was selected to maximize the detection of immunoreactive puncta (XY diameter 0.15 μm, Z diameter 0.45 μm, for both Homer1 and Synaptotagmin 1/2 puncta). Spots were classified using the “Intensity Center” filter. The threshold value was selected to maximize the detection of immunoreactive puncta. The threshold value varied between channels and immunostainings but was kept consistent between pairs of images that were compared. Local contrast was used to define the spot growth boundary, using a value that appropriately reflected the immunoreactive signal of the source channel. A volume filter was then applied to remove spots smaller than 0.005 μm 3 . Pre‐ and postsynaptic spots were colocalized using a MATLAB colocalization script (Colocalize Spots XTension), using a colocalization distance of 0.25 μm between spot centers. Synapse density is shown as App NL‐F KI mice normalized to WT mice, and App NL‐F KI; Trem2 R47H KI normalized to Trem2 R47H KI mice. PSVue‐labeled synapse images were acquired on a Leica Stellaris STED microscope using a 100×, 1.4NA oil immersion Plan‐Apochromat objective. A zoom factor of 2× and frame size of 2,048 × 2,048 was used for all images, resulting in an XY pixel size of 29 nm. Z‐step size was 200 nm, with 11 steps per Z‐stack, resulting in a stack thickness of 2.2 μm. Images were acquired in Photon Counting mode with a scan speed of 600 Hz and line accumulation 8. A laser power of 5, 5, and 10% was used for the 499, 557, and 653 nm lasers, respectively. Three regions of interest were acquired in the center of the hippocampal dentate gyrus hilus for each brain section. Confocal images of PSVue‐labeled synapses were deconvolved using Leica's LIGHTNING deconvolution. Imaris was used for pre‐ and postsynaptic puncta detection as described above. The surface function was then used to generate volumes representing the PSVue signal. Pre‐ and postsynaptic spots within 0.25 μm of a PSVue surface were determined using a MATLAB colocalization script (Spots Close To Surface XTension).
Statistics
Data curation of image analysis was performed by investigators blinded to the genotype or treatment of animals/cultures. Statistical tests were performed using GraphPad Prism 9.0 (GraphPad Software) as appropriate. Data points are shown as ROIs and average or median per experimental replicate (either per animal or culture preparation) where applicable. Statistical tests have been performed per animal for mouse studies and per experimental replicate for cell culture studies, with the exception of GCaMP studies which are done per individual spine in accordance with the field's standards.
Data shown as mean ±
SEM or SD. P ‐values shown as not significant (ns) P > 0.05; * P < 0.05; ** P < 0.01; *** P < 0.001; **** P < 0.0001. Statistical tests and data representation are stated in the figure legends.
Supporting information Appendix S1 Click here for additional data file. Expanded View Figures PDF Click here for additional data file. Movie EV1 Click here for additional data file. Movie EV2 Click here for additional data file. Movie EV3 Click here for additional data file. Movie EV4 Click here for additional data file. Movie EV5 Click here for additional data file. Movie EV6 Click here for additional data file. Dataset EV1 Click here for additional data file. PDF+ Click here for additional data file. Source Data for Figure 1 Click here for additional data file. Source Data for Figure 2 Click here for additional data file. Source Data for Figure 3 Click here for additional data file. Source Data for Figure 4 Click here for additional data file.
📊 Figures
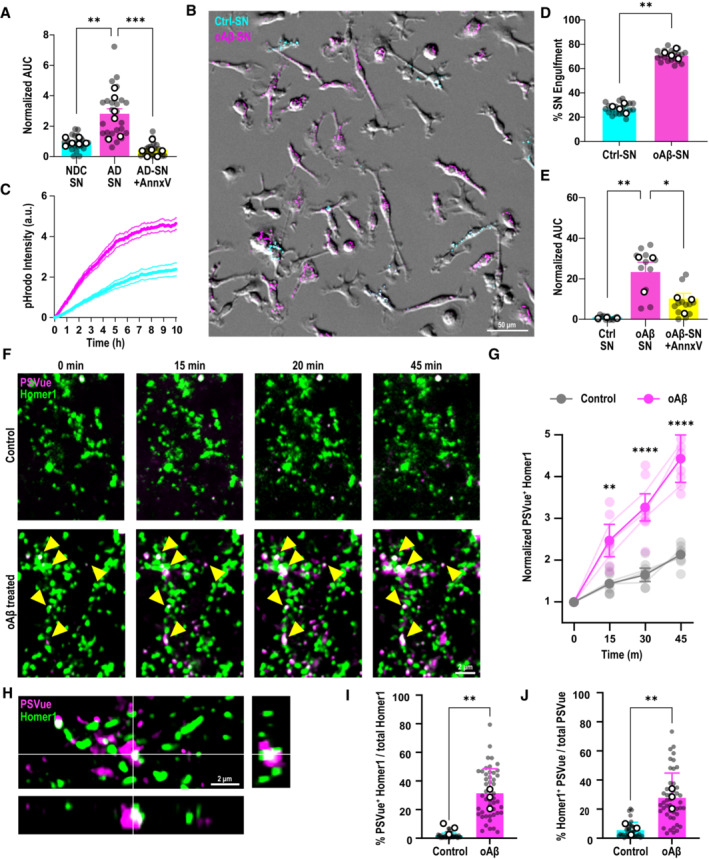
Figure 1
Microglia target AD synapses for engulfment via ePtdSer
A Area under curve (AUC) for pHrodo fluorescence signals in primary microglia at t =u20093u2009h, normalized to respective control, postu2010application of synaptosomes (SN) from either AD patients or...
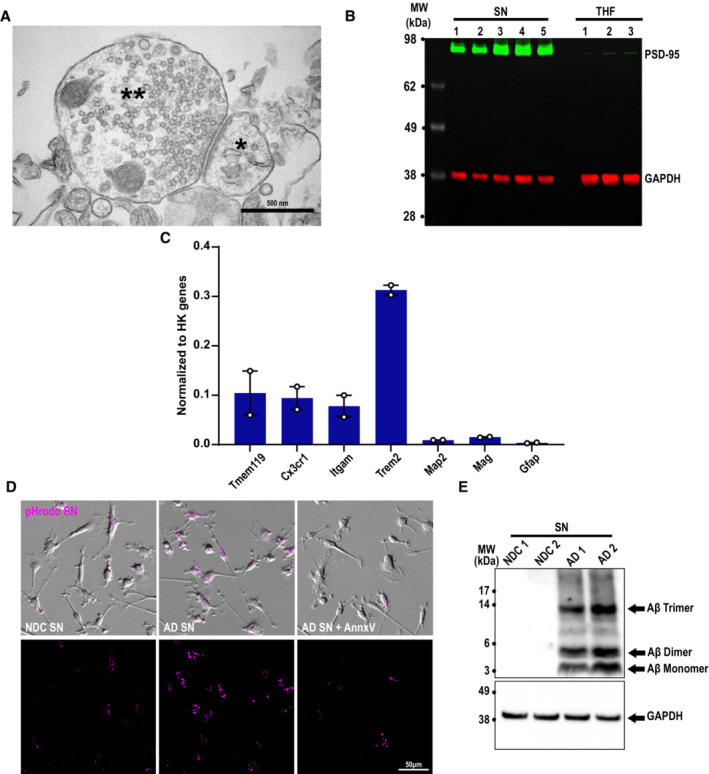
Figure EV1
Annexinu2010V pretreatment of AD synaptosomes decreases microglial engulfment
A Crude synaptosomes were prepared using a protocol that yields electrically functional synaptosomes for several hours postu2010isolation, which can be depolarized and stimulated with KCl and NMDA, re...
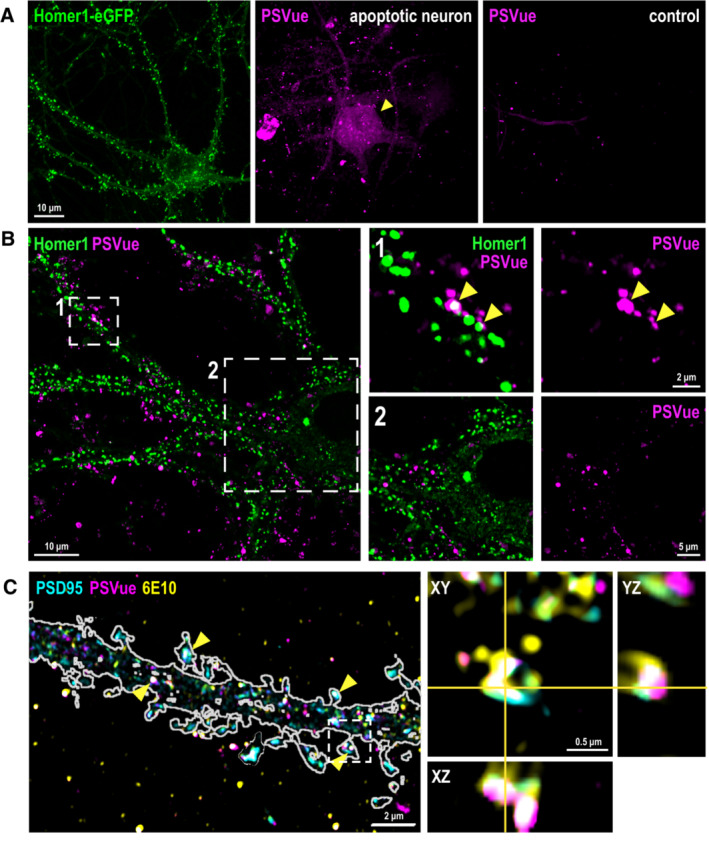
Figure EV2
Au03b2 oligomers induce focal PtdSer externalization in dendritic spines
A Representative image of Homer1u2010eGFP neuron used in our studies here (green, left panel). In contrast to an apoptotic neuron (magenta, middle panel), where PSVue signals are observed in whole par...
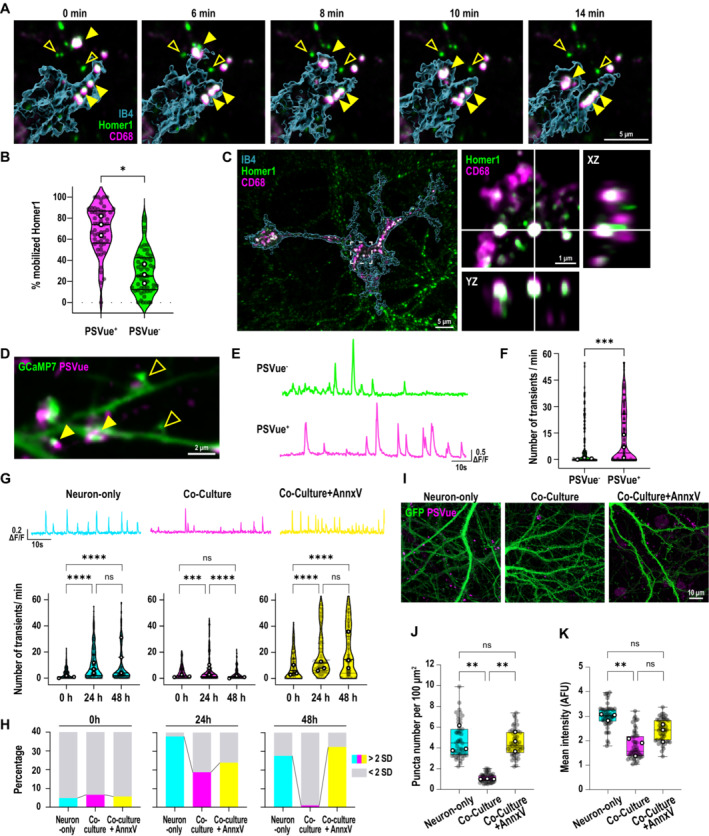
Figure 2
Microglia selectively engulf hyperactive ePtdSer + spines and ameliorate Au03b2 oligomeru2010induced neuronal hyperactivity
A Timeu2010lapse images of microglia (cyan, labeled with IB4u2010647, 3D rendered) internalizing (yellow arrowheads) PSVue + Homer1u2010eGFP dendritic spines. Note PSVue u2212 Homer1u2010eGFP dendriti...
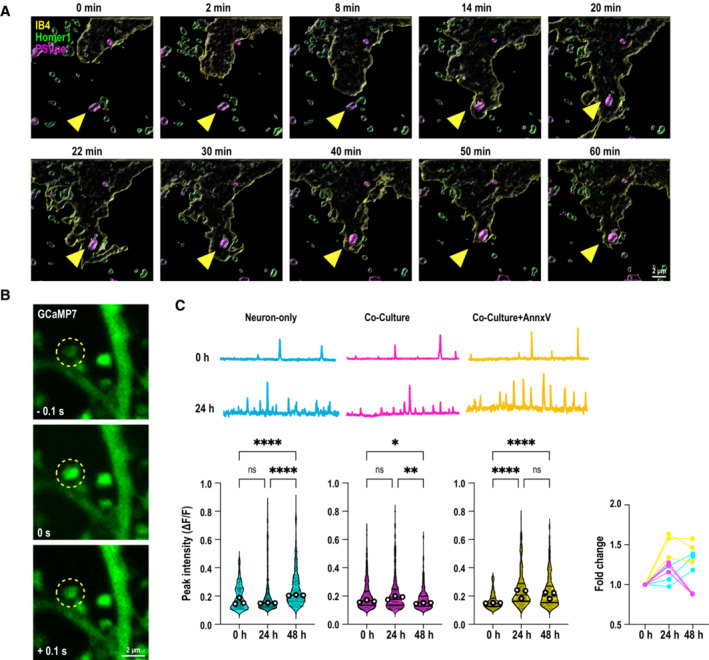
Figure EV3
Primary microglia contact and remove ePtdSer + dendritic spines to resolve neuronal hyperactivity upon acute Au03b2 oligomer challenge
A Timeu2010lapse sequence images of 10 consecutive optical sections (u0394zu2009=u20090.4u2009u03bcm) showing primary Homer1u2010eGFP neurons (green), PSVue (magenta) and microglia (yellow, labeled wi...
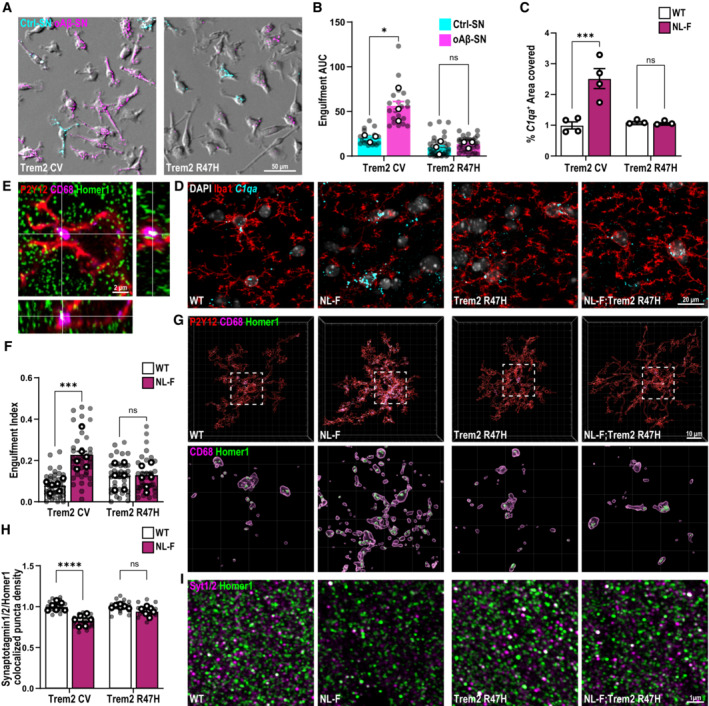
Figure 3
Microglia require TREM2 to engulf synapses in in vitro and in vivo Au03b2 models
A Trem2 CV and Trem2 R47H KI primary microglia treated simultaneously with oAu03b2u2010bound synaptosomes (SN) conjugated with pHrodo red (magenta) and control SN, conjugated with pHrodo deep red (cya...
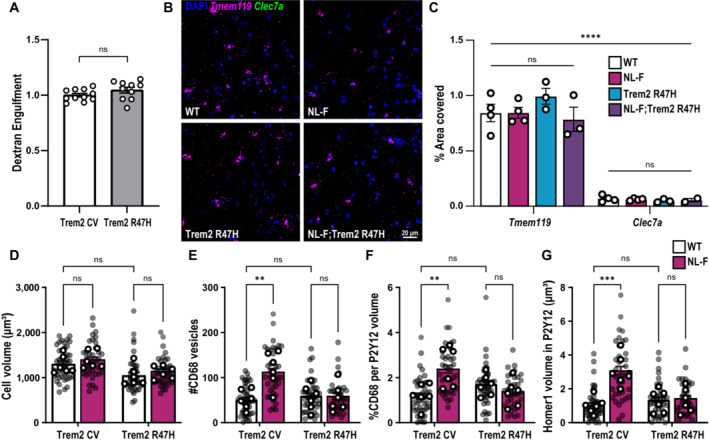
Figure EV4
Microglia require functional TREM2 to engulf synapses in vivo
A Primary microglia (P0u2010P4) prepared from either Trem2 CV or Trem2 R47H KI mice treated with dextran conjugated to pHrodo red to compare engulfment of inert particles, showing no difference betwee...
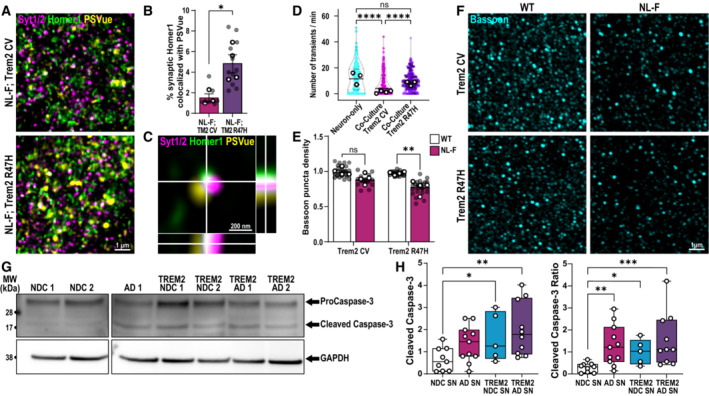
Figure 4
TREM2 lossu2010ofu2010function leads to increased levels of apoptoticu2010like synapses in mouse and human brains
A Hippocampal dentate gyrus hilus of 6 mo NLu2010F KI and NLu2010F KI; Trem2 R47H KI mice ICV injected with PSVue 643 (yellow) and immunostained for Synaptotagmin 1/2 (magenta) and Homer1 (green). Sca...
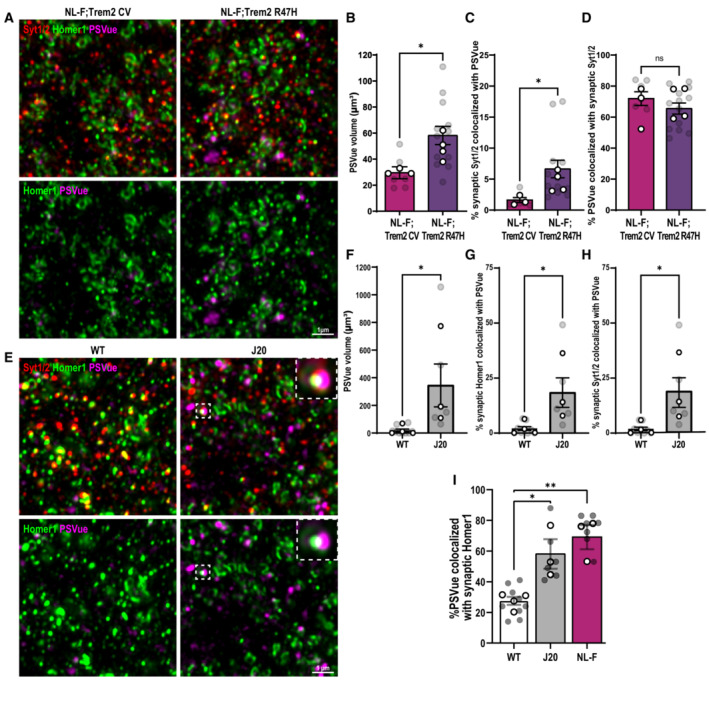
Figure EV5
Trem2 lossu2010ofu2010function exacerbates synaptic ePtdSer in the NLu2010Fu2009model of amyloidosis
A Superu2010resolution images from the hippocampal CA1 stratum radiatum of 6u2010monthu2010old NLu2010F KI and NLu2010F KI; Trem2 R47H KI mice immunostained for presynaptic Synaptotagmin 1/2 (Syt1/2, ...
Figure images are served from the NIH/NLM PubMed Central Open Access Subset or Europe PMC; copyright remains with the publishers and authors.
💬 Discussion
0 commentsNo comments yet. Be the first to start a discussion!
Leave a Comment