Abstract
BACKGROUND/OBJECTIVES: Individuals carrying loss-of-function gene mutations for the adipocyte hormone leptin are morbidly obese, but respond favorably to replacement therapy. Recombinant leptin is however largely ineffective for the vast majority of obese individuals due to leptin resistance. One theory underlying leptin resistance is impaired leptin transport across the blood-brain-barrier (BBB). Here, we aim to gain new insights into the mechanisms of leptin BBB transport, and its role in leptin resistance. METHODS: We developed a novel tool for visualizing leptin transport using infrared fluorescently labeled leptin, combined with tissue clearing and light-sheet fluorescence microscopy. We corroborated these data using western blotting. RESULTS: Using 3D whole brain imaging, we display comparable leptin accumulation in circumventricular organs of lean and obese mice, predominantly in the choroid plexus (CP). Protein quantification revealed comparable leptin levels in microdissected mediobasal hypothalami (MBH) of lean and obese mice (p = 0.99). We further found increased leptin receptor expression in the CP (p = 0.025, p = 0.0002) and a trend toward elevated leptin protein levels in the MBH (p = 0.17, p = 0.078) of obese mice undergoing weight loss interventions by calorie restriction or exendin-4 treatment. CONCLUSIONS: Overall, our findings suggest a crucial role for the CP in controlling the transport of leptin into the cerebrospinal fluid and from there to target areas such as the MBH, potentially mediated via the leptin receptor. Similar leptin levels in circumventricular organs and the MBH of lean and obese mice further suggest intact leptin BBB transport in leptin resistant mice.
🔬 Techniques
🔭 Microscopes
💻 Software
✨ Fluorophores
🧪 Sample Preparation
🔬 Cell Lines
🏭 Microscope Brands
🧪 Reagent Suppliers
💻 Software Details
🏛️ Research Organizations (ROR)
Affiliated research institutions:
📋 Methods
We developed a novel tool for visualizing leptin transport using infrared fluorescently labeled leptin, combined with tissue clearing and light-sheet fluorescence microscopy. We corroborated these data using western blotting.
Materials and methods Animals
All experiments were performed in adult male C57BL/6 J mice purchased from Janvier Labs (Saint-Berthevin, Cedex, France). Mice were maintained on a 12 h-light–dark cycle with free access to water and standard chow diet (Altromin, #1314) or 58% high fat diet (HFD) (Research Diets, D12331 ). Diet induced obese (DIO) mice were subjected to HFD for at least 20 weeks. Body composition was determined using nuclear magnetic resonance (NMR) technology (EchoMRI, Houston, TX, USA). For the diet intervention study, DIO mice were subdivided into 4 experimental groups. The group termed HFD was kept on HFD during the study. The remaining 3 groups of DIO mice were switched to chow on day 0 of the study and divided as follows: Diet switch (H > C) animals received ad libitum access to chow diet. Calorie restricted (CR) mice were restricted to the average food intake of the exendin-4 (EX4) group and EX4 treated animals were subjected to daily injections of exendin-4 (0.08 mg/kg) (Tocris biosciences, Bristol, UK) in the morning for up to 10 days. Age-matched mice fed chow were used as a control group. At the end of the diet-intervention study, all mice were first subjected to a single intraperitoneal (i.p.) injection of either vehicle or leptin, 45 min before being sacrificed by cervical dislocation for organ withdrawal. Brains were extracted swiftly and the ME and MBH dissected as described below. Recombinant murine leptin was reconstituted in 20 mM Tris-HCI, pH 8.0 at a concentration of 5 mg/ml. This was then further diluted in saline (0.9 % NaCl) to a final concentration of 1 mg/ml and injected at a dose of 5 mg/kg body weight. Mice were distributed into treatment groups based on their starting body weight. We thereby aimed to assure an equal distribution of starting body weights at the beginning of the study, which allows for better dissection of longitudinal treatments effects on body weight. In vivo experiments were performed without blinding of the investigators. All studies were based on power analyses to assure adequate sample sizes, and approved by the State of Bavaria, Germany. Leptin coupling Leptin was coupled to either infrared IRDye® CW-800 (LICOR #929-71012) or far-red IRDye® 650 (LICOR #929-70020) fluorescent dyes. Coupling was carried out according to the IRDye® CW-800 kit handbook. Lyophilized recombinant mouse leptin (R&D systems Cat.# 498-OB-05M) was reconstituted in PBS with a pH of 8.5 to a final concentration of 1 mg/ml. The dye was reconstituted in RNAse-free water and the appropriate volume was added to 1 ml of 1 mg/ml leptin, then incubated at 20 °C for 2 h. Coupled leptin was separated from unbound dye by size exclusion column filtration (Pierce Zebra™ desalting spin columns, Life Technologies #89891). Dye solution not used for coupling was diluted to the same absorption value as that of the coupled leptin sample and used as a control. Largely avoiding freeze-thaw cycles, coupled leptin was stored in dark tubes and kept at 4 °C for short-term storage and −20 °C for long-term storage.
Show full methods section
We developed a novel tool for visualizing leptin transport using infrared fluorescently labeled leptin, combined with tissue clearing and light-sheet fluorescence microscopy. We corroborated these data using western blotting.
Materials and methods Animals
All experiments were performed in adult male C57BL/6 J mice purchased from Janvier Labs (Saint-Berthevin, Cedex, France). Mice were maintained on a 12 h-light–dark cycle with free access to water and standard chow diet (Altromin, #1314) or 58% high fat diet (HFD) (Research Diets, D12331 ). Diet induced obese (DIO) mice were subjected to HFD for at least 20 weeks. Body composition was determined using nuclear magnetic resonance (NMR) technology (EchoMRI, Houston, TX, USA). For the diet intervention study, DIO mice were subdivided into 4 experimental groups. The group termed HFD was kept on HFD during the study. The remaining 3 groups of DIO mice were switched to chow on day 0 of the study and divided as follows: Diet switch (H > C) animals received ad libitum access to chow diet. Calorie restricted (CR) mice were restricted to the average food intake of the exendin-4 (EX4) group and EX4 treated animals were subjected to daily injections of exendin-4 (0.08 mg/kg) (Tocris biosciences, Bristol, UK) in the morning for up to 10 days. Age-matched mice fed chow were used as a control group. At the end of the diet-intervention study, all mice were first subjected to a single intraperitoneal (i.p.) injection of either vehicle or leptin, 45 min before being sacrificed by cervical dislocation for organ withdrawal. Brains were extracted swiftly and the ME and MBH dissected as described below. Recombinant murine leptin was reconstituted in 20 mM Tris-HCI, pH 8.0 at a concentration of 5 mg/ml. This was then further diluted in saline (0.9 % NaCl) to a final concentration of 1 mg/ml and injected at a dose of 5 mg/kg body weight. Mice were distributed into treatment groups based on their starting body weight. We thereby aimed to assure an equal distribution of starting body weights at the beginning of the study, which allows for better dissection of longitudinal treatments effects on body weight. In vivo experiments were performed without blinding of the investigators. All studies were based on power analyses to assure adequate sample sizes, and approved by the State of Bavaria, Germany. Leptin coupling Leptin was coupled to either infrared IRDye® CW-800 (LICOR #929-71012) or far-red IRDye® 650 (LICOR #929-70020) fluorescent dyes. Coupling was carried out according to the IRDye® CW-800 kit handbook. Lyophilized recombinant mouse leptin (R&D systems Cat.# 498-OB-05M) was reconstituted in PBS with a pH of 8.5 to a final concentration of 1 mg/ml. The dye was reconstituted in RNAse-free water and the appropriate volume was added to 1 ml of 1 mg/ml leptin, then incubated at 20 °C for 2 h. Coupled leptin was separated from unbound dye by size exclusion column filtration (Pierce Zebra™ desalting spin columns, Life Technologies #89891). Dye solution not used for coupling was diluted to the same absorption value as that of the coupled leptin sample and used as a control. Largely avoiding freeze-thaw cycles, coupled leptin was stored in dark tubes and kept at 4 °C for short-term storage and −20 °C for long-term storage.
Ion exchange purification
To separate coupled from uncoupled leptin, we performed Ion Exchange Chromatography (IEX) using a Resource Q anion-exchange column with 1 ml volume (RESOURCE TM Q, GE Healthcare) at pH 8. The leptin-CW800 sample underwent a buffer exchange, by sequential concentration/dilution steps into 20 mM TRIS-HCl pH 8 (Buffer A). After loading the sample onto the column, the column was washed with 10 column volumes of Buffer A. Separation was then achieved by applying a salt gradient based on increasing ionic strength to 0.5 M NaCl (50% Buffer B; 20 mM TRIS-HCl buffer pH 8, 1 M NaCl) at a flow rate of 4 ml/min and eluent volume of 20 columns. Finally, the column was washed with 5 column volumes of 100% Buffer B. For each fraction the purity and molecular weight was assessed by a Pierce BCA protein assay kit (Thermo Fisher Scientific Inc., Rockford, IL, USA) and SDS-PAGE, as described below.
Median eminence and mediobasal hypothalamus dissection
Under a dissecting microscope the ME can be seen as a thin structure following the sagittal plane, lying on top of the hypothalamus. It was possible to see the fenestrated blood vessels running along the ME. Using very fine forceps (Dumont, 5SPSF – Inox – B), and applying light pressure parallel to either side of the ME, the ME was pinched away from the hypothalamus. Removing the ME causes a break in the third ventricle wall, and a small amount of fluid was seen leaving the ventricle. This may serve as confirmation that the ME was removed. To remove the MBH the brain was cut with a scalpel coronally, directly through the center of the hypothalamus. The two brain halves are then laid flat, to expose the hypothalamus face upwards. If the ME dissection was done correctly, the MBH will have a flat surface. If too much tissue was removed, it will have a concave surface. Using fine forceps, two 45° cuts were made vertically on either side of the MBH. A third cut was then made horizontally below the MBH, allowing the MBH to be lifted from the brain. Tissues were snap frozen in liquid nitrogen and stored at −80 °C. Protein extraction and western blotting As ME and MBH samples only provide a very small amount of tissue, samples from 2 mice were pooled to provide sufficient protein levels for detection. Tissue lysis buffer consisted of RIPA buffer (Thermo Fisher Scientific Inc., Rockford, IL, USA) with the addition of 1× phosphatase- and protease-inhibitors (Thermo Fisher Scientific Inc., Rockford, IL, USA) and 1 mM phenyl-methane-sulfonyl fluorid (PMSF). Using 200 µl of lysis buffer for MBH samples and 50 µl of lysis buffer for ME samples resulted in the most efficient protein extraction. Samples were lysed via sonication then rotated on a wheel for 30 min to ensure full suspension of the tissues in lysis buffer. Samples were then centrifuged at 12,000× g for 7 min and the supernatants collected. Protein concentrations were measured using the Pierce BCA protein assay kit (Thermo Fisher Scientific Inc., Rockford, IL, USA), samples were then diluted to equal concentrations in 4x NuPage buffer + DTT (Thermo Fisher Scientific Inc., Rockford, IL, USA). After boiling at 95 °C for 5 min, equal amounts of protein were loaded onto 4–20% gradient Criterion™ TGX™ Precast Gels (Biorad, Hercules, CA, USA). Samples were transferred to a nitrocellulose membrane using the Trans-Blot® Turbo™ Transfer System (Biorad, Hercules, CA, USA). Membranes were blocked in Tris-buffered-saline with 0.05% Tween 20 (TBS-T) containing 5% BSA (VWR, Vienna, Austria) for 1 h. For leptin detection, membranes were blocked in 5% skim milk powder (Sigma-Aldrich, St. Louis, Missouri, USA) in TBS-T. Primary antibodies were anti-pSTAT3 T705 (rabbit polyclonal, 1:1000, Cat #9145), anti-STAT3 (mouse monoclonal, 1:1000, Cat #9139), anti-β-actin (rabbit polyclonal, 1:10000, Cat #4970) (all antibodies purchased from Cell Signaling Technology (Cell Signaling, Danvers, MA, USA)) or anti-murine-leptin (rabbit polyclonal, 1:1000, Cat #500-P68. Peprotech, Rocky Hill, NJ, USA). Antibodies were diluted in blocking buffer (5% skim milk powder for leptin antibodies, 5% BSA for all others) and incubated on the membranes overnight at 4 °C. Detection was achieved using ECL Clarity (Biorad, Hercules, California, USA) and exposure to high-sensitivity films (Amersham Hyperfilm ECL (GE Healthcare Bio-Sciences, Pittsburgh, PA, USA)). Densitometric analysis was performed using ImageJ 1.51 (NIH, Bethesda, Maryland, USA).
Cell culture
HEK293 cells were cultured in a 6-well plate with low glucose DMEM, with 10% FBS and 1% Pen/Strep.
Transfection of pCAG-2A-H2B
Venus_mOBRb-HA was carried out using the FuGene® HD transfection reagent (Promega, Madison, WI, USA) as per the kit’s instructions with 1.5 µg of mLepRb plasmid DNA and 4.5 µl of transfection reagent. 48 h post transfection, cells were placed in starvation medium (DMEM, with 0.1% FBS) for 4 h prior to leptin stimulation. Recombinant murine leptin was added to the cells at a final concentration of 10 nM. Cells were stimulated for 30 min with vehicle, leptin, CW-800 dye or leptin-CW800, washed twice with ice cold PBS and then snap frozen at −80 °C. Cellular proteins were isolated by adding 100 µl RIPA buffer with inhibitors and PMSF, and further treated as described above.
RNA extraction and qPCR
RNA was extracted from tissue using the NucleoSpin RNA isolation kit (Macherey-Nagel, Düren, Germany). Equal amounts of RNA were reverse transcribed to cDNA using the QuantiTect Reverse Transcription kit (Qiagen, Hilden, Germany). Gene expression was analyzed using TaqMan probes for LRP2 (Mm01328171_m1), murine leptin receptor (Mm00440181_m1), and Hprt (Mm01545399_m1) as the housekeeping gene with the respective TaqMan mastermix (Thermo Fischer Scientific, Inc., Rockford, IL USA). qPCRs were carried out using a ViiA™ 7 Real Time PCR System (Applied Biosystems). Gene expression was evaluated using the Δ-Δ Ct method.
Tissue clearing and light-sheet fluorescence microscopy
The dissected brain was fixed in PaxGene (PreAnalytiX, Hombrechtikon, Switzerland) according to the manufacturer’s recommendations and thereafter underwent a chemical procedure of optical clearing as described before [ 23 ]. Afterwards cleared whole mouse brains were imaged on a light-sheet fluorescence microscope (UltraMicroscope II, LaVision BioTec, Bielefeld, Germany). In order to visualize the lectin-647 (Thermo Fisher Scientific Inc., Rockford, IL, USA, Cat# L32451 ) a bandpass filter set with an excitation range of 640/30 and emission range of 690/50 was used in combination with an additional filter set (excitation: 740/35; emission: 795/50) for detection of leptin-CW800 signals. 3D-reconstruction and rendering was performed using Imaris vers.7.3 (Bitplane, Concord, MA, USA). Volume analysis was performed using Arivis Vision4D (Arivis, Munich, Germany).
Immunohistochemistry
Brains were extracted after cervical dislocation and incubated in 4% paraformaldehyde at 4 °C overnight. Brains were then transferred to 20% sucrose in 0.1 M tris-buffered-saline (TBS) for 24–48 h. Brains were frozen at −20 °C, mounted with OCT and cut coronally on a cryostat into 30 µm sections. Free-floating sections were subjected to pre-treatment with ice-cold 100% methanol for 10 min at −20 °C, then to blocking for 1 h at RT in a buffer containing 0.25% gelatin and 0.5% Triton X 100 in 1x TBS. Primary anti-pSTAT3 T705 antibody was incubated with brain sections overnight at 4 °C. After 3 × 5 min washing steps with TBS, the secondary donkey anti-rabbit-568 antibody (1:500 in blocking buffer, Thermofischer Scientific, Cat # A10042) was incubated with brain slices for 1 h at RT. After washing, the sections were counterstained with DAPI (1:10000) and mounted on slides. Images were captured with a Leica TCS SP5 microscope. Stack and overlay pictures were created using ImageJ image analysis software (v. 1.51, NIH, Bethesda, Maryland, USA). Brain regions were defined with the use of the DAPI counterstaining and the Allen brain Atlas ( http://mouse.brain-map.org/static/atlas ).
Statistical analyses
Statistical analyses were performed using GraphPad Prism (GraphPad Software, Inc. La Jolla, CA, USA). Two-tailed Student’s t-tests or One-Way ANOVA with Bonferroni’s post tests were used to compare differences between phenotypes. P-values lower than 0.05 were considered significant. Significances were indicated as follow: ** p < 0.01, *** p < 0.001, **** p < 0.0001 or, groups with significantly different values were indicated as different characters and groups not significantly different from each other were indicated with the same characters. All results are presented as means +/− SEM. Gaussian distribution was analyzed with the D’Agostino-Pearson omnibus test.
Electronic supplementary material Supplementary Figure 1 and Supplementary Video Legends Supplemental Video S1 Supplemental Video S2 Supplemental Video S3 Supplemental Video S4 Supplemental Video S5
Electronic supplementary material The online version of this article (10.1038/s41366-018-0221-z) contains supplementary material, which is available to authorized users.
📊 Figures
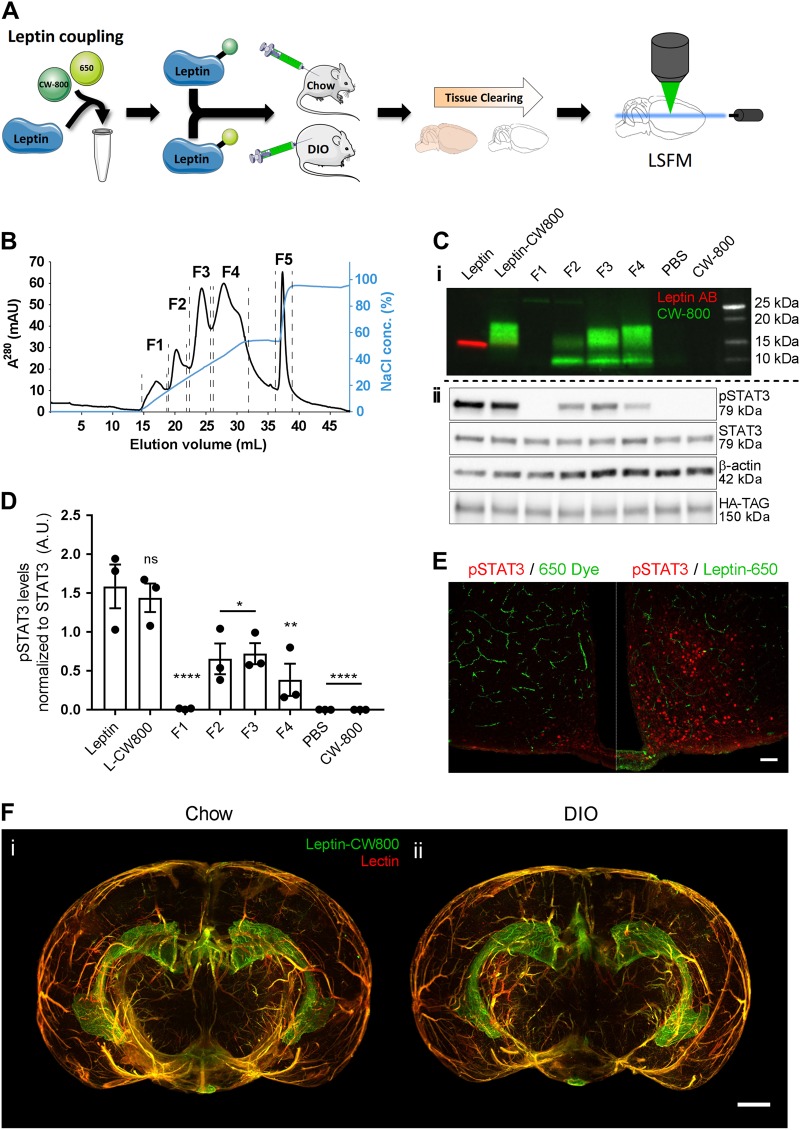
Fig. 1
Labeled leptin combined with tissue clearing and light-sheet fluorescence microscopy allows for 3D visualization of leptin distribution in the intact mouse brain. a Leptin was coupled to either an inf...
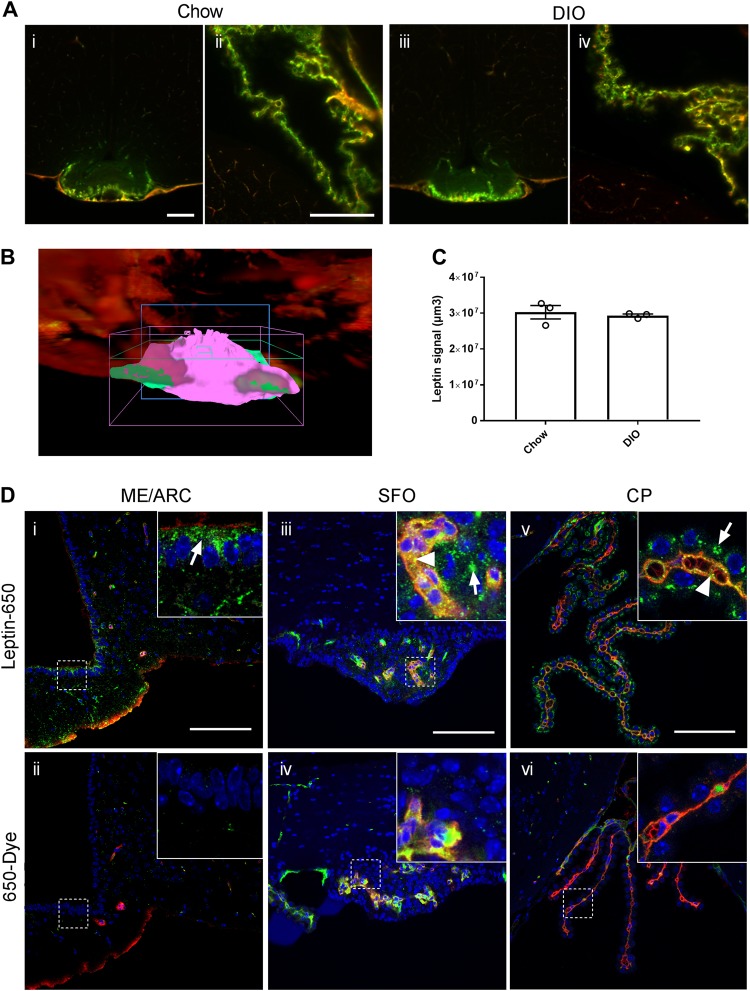
Fig. 2
Accumulation of labeled leptin in circumventricular organs and the choroid plexus of mice. a Leptin-CW800 (i.p., 5u2009mgu2009kg u22121 ) and lectin-647 (i.v., 250u2009u00b5g) were injected into eithe...

Fig. 3
Leptin signaling in dissected median eminence (ME) and mediobasal hypothalamus (MBH) mouse brain tissue. a The ME and MBH were dissected from murine brains as depicted in a . b A correct dissection wa...
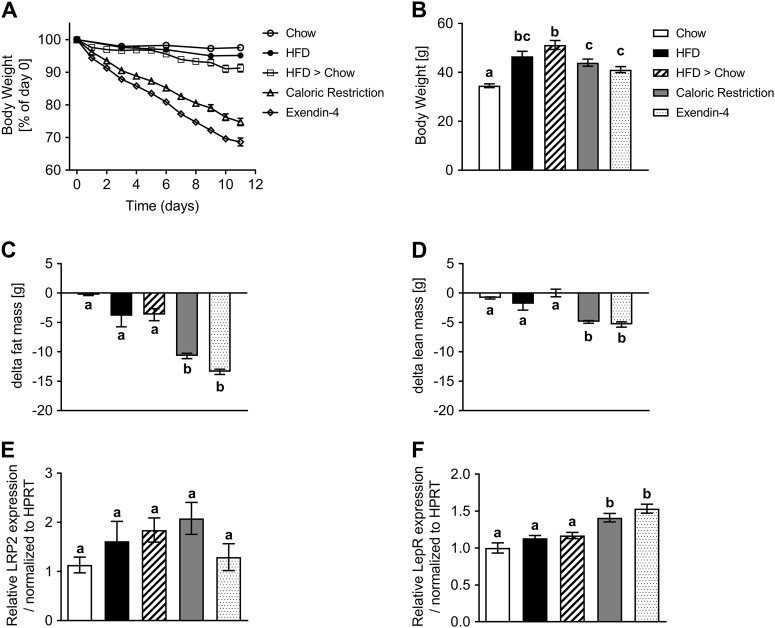
Fig. 4
Weight loss by CR or EX4 treatment drives upregulation of leptin receptor mRNA in the choroid plexus. a Effects of obesity and weight loss on the transport of leptin into the MBH were recorded in age-...
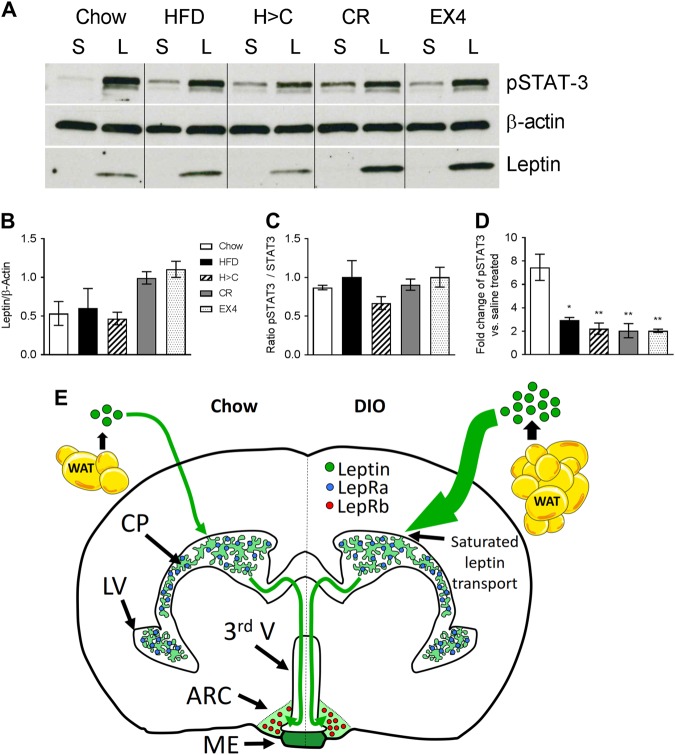
Fig. 5
Profound weight loss is associated with increased leptin transport into the MBH. a u2013 d Leptin levels in the MBH 45u2009min after vehicle (saline, S) or leptin (L) injections (i.p., 5u2009mgu2009kg...
Figure images are served from the NIH/NLM PubMed Central Open Access Subset or Europe PMC; copyright remains with the publishers and authors.
💬 Discussion
0 commentsNo comments yet. Be the first to start a discussion!
Leave a Comment