Abstract
To supply proteins to their vast volume, neurons localize mRNAs and ribosomes in dendrites and axons. While local protein synthesis is required for synaptic plasticity, the abundance and distribution of ribosomes and nascent proteins near synapses remain elusive. Here, we quantified the occurrence of local translation and visualized the range of synapses supplied by nascent proteins during basal and plastic conditions. We detected dendritic ribosomes and nascent proteins at single-molecule resolution using DNA-PAINT and metabolic labeling. Both ribosomes and nascent proteins positively correlated with synapse density. Ribosomes were detected at ~85% of synapses with ~2 translational sites per synapse; ~50% of the nascent protein was detected near synapses. The amount of locally synthesized protein detected at a synapse correlated with its spontaneous Ca2+ activity. A multifold increase in synaptic nascent protein was evident following both local and global plasticity at respective scales, albeit with substantial heterogeneity between neighboring synapses.
🔬 Techniques
🔭 Microscopes
💻 Software
✨ Fluorophores
🧪 Sample Preparation
🔬 Cell Lines
🏭 Microscope Brands
🧪 Reagent Suppliers
🔴 Lasers
📷 Detectors
🎨 Filters
💻 Software Details
💾 Data Repositories
🏛️ Research Organizations (ROR)
Affiliated research institutions:
📋 Methods
Cell culture
Dissociated rat hippocampal neuron cultures were prepared and maintained as previously described ( 28 ). Briefly, rat hippocampi were dissected from postnatal day 0 to 1 pups of either sex (Sprague-Dawley strain; Charles River Laboratories), dissociated with papain (Sigma-Aldrich), and then plated at a density of 30 × 10 3 cells/cm 2 on poly- d -lysine–coated glass-bottom petri dishes (MatTek). Neurons were maintained (until day of experiment) in a humidified atmosphere at 37°C and 5% CO 2 in growth medium (Neurobasal-A supplemented with B27 and GlutaMAX-I; Life Technologies) for 13 to 21 days in vitro (DIV) to ensure synapse maturation. For polysome profiling, because of the larger quantity of cells needed, dissociated rat cortical neuron cultures were prepared and maintained similar to above. All experiments complied with National Animal Care Guidelines and the guidelines issued by the Max Planck Society and were approved by local authorities. Ribosome profiling Harringtonine (LKT Laboratories) was prepared at a final concentration of 2 μM (2 mM stock, 100% ethanol) and incubated with cells for 30 min at 37°C. Puromycin (Thermo Fisher Scientific) was prepared at a final concentration of 500 μM and incubated with cells for 10 min at 37°C. After treatments, cells were immediately placed on ice, washed with ice-cold phosphate-buffered saline (PBS) containing cycloheximide (100 μg/ml), lysed, and scraped in polysome lysis buffer [20 mM tris (pH 7.4), 150 mM NaCl, 5 mM MgCl 2 , TURBO DNase (24 U/ml), cycloheximide (100 μg/ml), 1% Triton X-100, 1 mM dithiothreitol (DTT), RNasin Plus RNase Inhibitor (200 U/ml), and 8% glycerol]. After scraping, the lysates were pipetted up and down until homogenization was clear with a 0.4 × 20 mm syringe needle (HSW FINE-JECT) on ice. The lysates were then centrifuged at 10,000 g for 10 min at 4°C. The supernatant was used for ribosome fractionation. For sucrose gradients, all solutions were prepared in gradient buffer [20 mM tris (pH 7.5), 8% glycerol, 150 mM NaCl, 5 mM MgCl2, cycloheximide (100 μg/ml), and 1 mM DTT]. Gradients were prepared by sequentially adding different sucrose concentrations (in order from first added to last: 8 ml of 55%, 0.5 ml of 50%, 0.5 ml of 40%, 0.5 ml of 30%, 0.5 ml of 20%, and 0.5 ml of 10%) into the same thin-wall polypropylene tube (Beckman, catalog no. 331372). After the addition of each sucrose solution, tubes were placed at −80°C to freeze the content before the next layer. The gradients were stored at −80°C and left to equilibrate at 4°C overnight. Then, 0.5 to 1.5 optical density (measured with NanoDrop at 260 nm) of the lysates were loaded on top of the gradients and spun at 36,000 rpm at 4°C for 2 hours with a SW 41 Ti rotor (Beckman). Fractions from each sample were collected every 7 s using a density gradient fractionation system (Teledyne ISCO; intensity used, 1), chased by 60% sucrose and 10% glycerol in water at 850 μl/min, and continuous monitoring at 254 nm using a UA-6 detector. Fractions of 125 μl corresponding to the 40 S , 80 S , or the polysome peaks were collected and pooled as the enriched 40 S , 80 S , and polysome fractions, respectively. For plating ribosome fractions, diluted fractions were incubated in (1:100 dilution in the above lysis buffer without TURBO DNase, glycerol, and protease inhibitor cocktails) poly- d -lysine–coated MatTek dishes for 2 hours before the liquid was removed, and 4% paraformaldehyde in PBS containing cycloheximide (100 μg/ml) was added to fix the samples. After fixation, the dishes were washed three times using PBS buffer (pH 7.4). Metabolic labeling with AHA and synaptic scaling Neurons (18 to 21 DIV) on MatTek dishes were incubated in the growth medium described above (for upscaling, 2 μM TTX was used for 1 or 24 hours) at 37°C and 5% CO 2 . Neurons were incubated in methionine-free Neurobasal-A (custom-made by Life Technologies) supplemented with 4 mM AHA for 15 min ( 10 ). For upscaling, this step started 15 min before each treatment ended, and 2 μM TTX was added. In methionine control experiments, AHA was replaced by 4 mM methionine (Sigma-Aldrich). Subsequently, cells were washed twice with Neurobasal-A, fixed in paraformaldehyde-sucrose (4% paraformaldehyde; Alfa Aesar) and 4% sucrose in PBS supplemented with Mg 2+ and Ca 2+ at room temperature for 20 min, washed again, permeabilized with 0.5% Triton X-100 in 1 × PBS (pH 7.4) for 15 min, and blocked with blocking buffer (4% goat serum in 1× PBS) for 1 hour. To optimize conditions for the subsequent click reaction, neurons were equilibrated by washes with 1× PBS (pH 7.8). The BONCAT part of the assay was performed as described previously ( 28 ) with the following modification: We used a previously reported single-stranded DNA oligo sequence (P1 docking oligo) ( 12 ) modified to carry a more reactive alkyne, dibenzocyclooctyne (DBCO; GeneLink), as a tag in the copper-free azide-alkyne cycloaddition click reaction ( 19 ). For the Cu-free click reaction, 0.4 μM P1-DBCO tag was prepared in 1× PBS (pH 7.8) before application to the cells and the click chemistry was performed overnight at room temperature. After the click reaction, cells were washed two times with PBS (pH 7.8) and 0.5% Triton in PBS and three times with PBS (pH 7.4) before immunofluorescence labeling with various markers (see below). We estimated the undersampling rate of our metabolic labeling on the basis of the measured synaptic nascent protein localizations (see below the “Data analyses” section).
Show full methods section
Cell culture
Dissociated rat hippocampal neuron cultures were prepared and maintained as previously described ( 28 ). Briefly, rat hippocampi were dissected from postnatal day 0 to 1 pups of either sex (Sprague-Dawley strain; Charles River Laboratories), dissociated with papain (Sigma-Aldrich), and then plated at a density of 30 × 10 3 cells/cm 2 on poly- d -lysine–coated glass-bottom petri dishes (MatTek). Neurons were maintained (until day of experiment) in a humidified atmosphere at 37°C and 5% CO 2 in growth medium (Neurobasal-A supplemented with B27 and GlutaMAX-I; Life Technologies) for 13 to 21 days in vitro (DIV) to ensure synapse maturation. For polysome profiling, because of the larger quantity of cells needed, dissociated rat cortical neuron cultures were prepared and maintained similar to above. All experiments complied with National Animal Care Guidelines and the guidelines issued by the Max Planck Society and were approved by local authorities. Ribosome profiling Harringtonine (LKT Laboratories) was prepared at a final concentration of 2 μM (2 mM stock, 100% ethanol) and incubated with cells for 30 min at 37°C. Puromycin (Thermo Fisher Scientific) was prepared at a final concentration of 500 μM and incubated with cells for 10 min at 37°C. After treatments, cells were immediately placed on ice, washed with ice-cold phosphate-buffered saline (PBS) containing cycloheximide (100 μg/ml), lysed, and scraped in polysome lysis buffer [20 mM tris (pH 7.4), 150 mM NaCl, 5 mM MgCl 2 , TURBO DNase (24 U/ml), cycloheximide (100 μg/ml), 1% Triton X-100, 1 mM dithiothreitol (DTT), RNasin Plus RNase Inhibitor (200 U/ml), and 8% glycerol]. After scraping, the lysates were pipetted up and down until homogenization was clear with a 0.4 × 20 mm syringe needle (HSW FINE-JECT) on ice. The lysates were then centrifuged at 10,000 g for 10 min at 4°C. The supernatant was used for ribosome fractionation. For sucrose gradients, all solutions were prepared in gradient buffer [20 mM tris (pH 7.5), 8% glycerol, 150 mM NaCl, 5 mM MgCl2, cycloheximide (100 μg/ml), and 1 mM DTT]. Gradients were prepared by sequentially adding different sucrose concentrations (in order from first added to last: 8 ml of 55%, 0.5 ml of 50%, 0.5 ml of 40%, 0.5 ml of 30%, 0.5 ml of 20%, and 0.5 ml of 10%) into the same thin-wall polypropylene tube (Beckman, catalog no. 331372). After the addition of each sucrose solution, tubes were placed at −80°C to freeze the content before the next layer. The gradients were stored at −80°C and left to equilibrate at 4°C overnight. Then, 0.5 to 1.5 optical density (measured with NanoDrop at 260 nm) of the lysates were loaded on top of the gradients and spun at 36,000 rpm at 4°C for 2 hours with a SW 41 Ti rotor (Beckman). Fractions from each sample were collected every 7 s using a density gradient fractionation system (Teledyne ISCO; intensity used, 1), chased by 60% sucrose and 10% glycerol in water at 850 μl/min, and continuous monitoring at 254 nm using a UA-6 detector. Fractions of 125 μl corresponding to the 40 S , 80 S , or the polysome peaks were collected and pooled as the enriched 40 S , 80 S , and polysome fractions, respectively. For plating ribosome fractions, diluted fractions were incubated in (1:100 dilution in the above lysis buffer without TURBO DNase, glycerol, and protease inhibitor cocktails) poly- d -lysine–coated MatTek dishes for 2 hours before the liquid was removed, and 4% paraformaldehyde in PBS containing cycloheximide (100 μg/ml) was added to fix the samples. After fixation, the dishes were washed three times using PBS buffer (pH 7.4). Metabolic labeling with AHA and synaptic scaling Neurons (18 to 21 DIV) on MatTek dishes were incubated in the growth medium described above (for upscaling, 2 μM TTX was used for 1 or 24 hours) at 37°C and 5% CO 2 . Neurons were incubated in methionine-free Neurobasal-A (custom-made by Life Technologies) supplemented with 4 mM AHA for 15 min ( 10 ). For upscaling, this step started 15 min before each treatment ended, and 2 μM TTX was added. In methionine control experiments, AHA was replaced by 4 mM methionine (Sigma-Aldrich). Subsequently, cells were washed twice with Neurobasal-A, fixed in paraformaldehyde-sucrose (4% paraformaldehyde; Alfa Aesar) and 4% sucrose in PBS supplemented with Mg 2+ and Ca 2+ at room temperature for 20 min, washed again, permeabilized with 0.5% Triton X-100 in 1 × PBS (pH 7.4) for 15 min, and blocked with blocking buffer (4% goat serum in 1× PBS) for 1 hour. To optimize conditions for the subsequent click reaction, neurons were equilibrated by washes with 1× PBS (pH 7.8). The BONCAT part of the assay was performed as described previously ( 28 ) with the following modification: We used a previously reported single-stranded DNA oligo sequence (P1 docking oligo) ( 12 ) modified to carry a more reactive alkyne, dibenzocyclooctyne (DBCO; GeneLink), as a tag in the copper-free azide-alkyne cycloaddition click reaction ( 19 ). For the Cu-free click reaction, 0.4 μM P1-DBCO tag was prepared in 1× PBS (pH 7.8) before application to the cells and the click chemistry was performed overnight at room temperature. After the click reaction, cells were washed two times with PBS (pH 7.8) and 0.5% Triton in PBS and three times with PBS (pH 7.4) before immunofluorescence labeling with various markers (see below). We estimated the undersampling rate of our metabolic labeling on the basis of the measured synaptic nascent protein localizations (see below the “Data analyses” section).
Immunofluorescence labeling
Neurons were washed three times in PBS before blocking in PBS containing 4% goat serum (Gibco) for 1 hour. Neurons were incubated overnight with guinea pig antibodies, anti-MAP2 (1:2000; 188004, Synaptic Systems), or chicken antibodies, anti-MAP2 (1:2000; ab5392, Abcam), and mouse antibodies, anti-PSD95 (1:1000; MA1-046, Thermo Fisher Scientific), or guinea pig antibodies, anti-Bassoon (1:1000; 141004, Synaptic Systems), in PBS containing 4% goat serum (Gibco) at 4°C to stain the dendrites for morphology and synapses, respectively. To stain ribosomal subunits, mouse antibodies, RPL36a (1:500 overnight, or 1:1000, 3 hours for subsampling; sc-100831, Santa Cruz Biotechnology), and rabbit antibodies, RPS11 (1:500 overnight, or 1:1000, 3 hours for subsampling; A303-936A, Bethyl Laboratories), were used. The samples were then washed three times in PBS (5 min each) before incubation for 1 hour with anti–guinea pig antibody conjugated with Alexa Fluor 488 (1:1000; Nanoprobes) or anti-chicken antibody conjugated with Alex Fluor 405 (1:1000; Nanoprobes) and anti-mouse antibody with Alexa Fluor 546 (1:1000; Nanoprobes) or anti–guinea pig antibody with Alexa Fluor 488 (1:1000; Nanoprobes). For secondary antibody staining of ribosome for DNA-PAINT, anti-mouse antibodies conjugated with P1 imager oligo and anti-rabbit antibodies conjugated with P5 imager oligo were used (1:1000; custom-made, as previously reported) ( 9 ). For ribosome-nascent protein colocalization, anti-mouse antibodies conjugated with P3 imager oligo and anti-rabbit antibodies conjugated with P5 imager oligo were used for ribosomal subunits. Neurons were washed three times in PBS (5 min each). All steps were performed at room temperature. Neurons were then stored in PBS at 4°C for up to 3 weeks until DNA-PAINT imaging. Transfection, Ca 2+ imaging, and local spine stimulation Experiments were conducted similar to previously described ( 25 ). Briefly, transfections were carried out 12 DIV with CombiMag (OZ Biosciences) and Lipofectamine 2000 (Invitrogen) following the manufacturer’s instructions. Live cell imaging was carried out using 13 DIV hippocampal neurons. All live cell imaging was performed at 32°C, in E4 imaging buffer [120 mM NaCl, 3 mM KCl, 10 mM Hepes (pH 7.4), 3 mM CaCl 2 , 1 mM MgCl 2 , and 10 mM glucose]. Glutamate uncaging experiments used a modified E4 buffer lacking MgCl 2 and containing 4 mM CaCl 2 . All live cell imaging used an inverted spinning disk confocal microscope (3i imaging systems; model CSU-X1) using the SlideBook 5.5 software. Images were acquired with a Plan-Apochromat ×63/1.4 oil differential interference contrast objective at laser powers 1.1 mW (488 nm) and 0.8 mW (561 nm) for basal Ca 2+ imaging and glutamate uncaging experiments with an Evolve 512 camera (Photometrics). We used 488-nm excitation and 525/30-nm emission filters for imaging GCaMP6s, and 561-nm excitation and 617/73-nm emission filters were used for imaging PSD95-mCherry. Images were analyzed using ImageJ (see the “Data analyses” section for details). OriginPro 2019 was used for data analysis, statistical testing, and plotting graphs. Transfected neurons were identified by GCaMP6s fluorescence (i.e., calcium transients). For basal Ca 2+ activity imaging, 500 frames were acquired at 1 Hz (five planes each spanning 5 μm in Z ) in E4 buffer containing 1 μM TTX followed by 15-min metabolic labeling with AHA (in E4 buffer; 4 mM) before fixation. Subsequent steps are as described in the “Metabolic labeling with AHA and synaptic scaling” section. For glutamate uncaging experiments, spines were identified using PSD95-mCherry fluorescence. Immediately before glutamate uncaging, neurons were treated with 1 μM TTX (citrate salt, 2 mM stock made in water), 50 μM forskolin (100 mM stock made in dimethyl sulfoxide; Tocris Bioscience), 4 mM AHA, and 2 mM 4-methoxy-7-nitroindolinyl–caged l -glutamate (100 mM stock made in E4 buffer; Tocris Bioscience) in modified E4 buffer lacking Mg 2+ (see above). Glutamate uncaging was carried out with a 720-nm multiphoton laser (Chameleon, Coherent) and a Pockels cell (Conoptics) for controlling the uncaging pulses. Spines at least 50 μm away from the cell body were chosen for uncaging experiments. To test a spine’s response to an uncaging pulse, an uncaging spot (∼2 μm 2 ) close to a spine head was selected, and two to three uncaging pulses at 10-ms pulse duration per pixel and 2.5-mW power were delivered to confirm spine-specific calcium transients. During uncaging, 60 uncaging pulses at 0.5 Hz with 10-ms pulse duration per pixel at 2.5-mW power were used. After uncaging, neurons were left in the same AHA-containing buffer for ~13 min, adding up to a total of 15 min of AHA incubation before washing with modified E4 buffer and fixation. Following fixation, neurons were processed as described in the “Metabolic labeling with AHA and synaptic scaling” section. Superresolution microscopy For DNA-PAINT imaging, the imaging buffer contains 500 nM P1, P3, or P5 conjugated with Atto655 (Eurofins Genomics) in 500 mM NaCl in PBS (pH 7.4) ( 20 ). For ribosome-nascent protein colocalization, 2 nM P1 was used for nascent protein PAINT to shorten the duration of multiplexed imaging. Immunolabeled cultured neurons containing 90-nm gold fiducial markers (A1190, Nanoparz) were imaged on an N-STORM system (Nikon, Japan): an Eclipse Ti-E inverted microscope, equipped with a Perfect Focus System and a motorized x - y stage. Total internal reflection fluorescence (TIRF) and highly inclined and laminated optical sheet (HILO) ( 20 ) configurations were adjusted using a motorized TIRF illuminator in combination with a ×100 oil-immersion objective [CFL Apo TIRF; 1.49 numerical aperture (NA)] with a final pixel size of 158 nm. For imaging, 647-nm excitation wavelength was used and housed in a MLC400B (Agilent) laser combiner. An optical fiber guided the laser beam to the microscope body and via a dichroic mirror (T660LPXR, Chroma) to the sample plane. Fluorescence emission was separated from excitation light via a band-pass filter (ET705/72m, Chroma) and detected by an iXon Ultra electron multiplying charge-coupled device (EMCCD) camera (DU-897U-CS0-23 #BV, Andor). The software NIS-Elements Ar/C and μManager were used to control the setup and the camera. Alternatively, immunolabeled cultured neurons prepared similarly were imaged on a Leica DMi8 S system with Infinity TIRF HP, Infinity Scanner, and an iXon Ultra 888 EMCCD camera (Andor). Oil-immersion objective (×100; HC PL APO CORR TIRF; 1.47 NA) was used in combination with a motorized TIRF illuminator. For imaging, 638-nm excitation wavelength was used (150 mW), and LAS X software package was used for image acquisition. Wide-field micrographs of the MAP2 and PSD95 (or Bassoon) reference markers (see the “Immunofluorescence labeling” section) were obtained for nonproximal dendrites (at least one branching point away from the soma) before DNA-PAINT as summed projections of 2-μm-thick Z -stacks to capture the entire dendritic volume. The chosen fields of view typically contained clearly separated dendrites that originated from the same neuron. HILO illumination was used for superresolution acquisition with a power of 30 to 40 mW, which was determined directly after the objective and under wide-field configuration. For the N-STORM system, the intensity density (45% intensity of 647-nm laser) was 0.9 kW/cm 2 . Time-lapse datasets with 50,000 frames and 16-bit depth were acquired for nascent protein localization at 5-Hz frame rate and 5-MHz camera readout bandwidth (preamplification, 3; electron multiplying gain, 4). For the DMi8 S system, time-lapse datasets with 50,000 frames and 16-bit depths were acquired for ribosomal subunit localization (25,000 frames for nascent protein PAINT in ribosome-nascent protein colocalization) at 5-Hz frame rate and 10-MHz camera readout bandwidth (gain list, 2; electron multiplying gain, 100).
Data analyses
DNA-PAINT acquisitions were reconstructed with Picasso:Localize, a module of the Picasso software ( 12 ), by applying a minimal net gradient of 2500 (for N-STORM) or 15,000 (for DMi8 S). With Picasso:Render, drift corrections were applied in two subsequent fashions: First, a drift correction based on the redundant cross-correlation, with a segmentation of 200, was applied. Second, fiducial markers (gold beads) were manually selected, localized, and used for drift correction. Drift-corrected data were filtered using Picasso:Filter. Raw localizations within the same location were further filtered temporally on the basis of their average frame numbers and SD of frame numbers to eliminate background signal due to the unspecific binding of the imager oligo to a random target. These background signals are often clustered temporally rather than distributed through the imaging course, resulting in lower or higher average frame numbers and lower frame number variance compared to real signal. Afterward, raw localizations within a maximal distance of 6× measured localization precision and showing a maximum number of transient dark frames of 20 were linked together, resulting in a single, linked localization event (referred to as “localization”). Localization precision (Nearest neighbor based analysis values) was determined to be 13.1 nm, as previously described using nearest neighbor–based analyses ( 41 ). Coincidence detection thresholds the interdistances between small- and large-subunit clusters at 100 nm based on the estimates of oligo docking site interdistance (maximum, ~50 nm), localization precision (see above paragraph), and corrected image drift (based on fiducial marker separation after drift correction). Without primary or secondary antibodies, only a low level of background signal was observed in the dendrites (fig. S1G). Prolonged labeling created too much signal, making it impossible to isolate and analyze individual clusters of ribosomal localizations (fig. S1E). Subsampling was thus optimized in situ (fig. S1F). Using purified monosomes plated on a coverslip (fig. S2, B and C), subsampling is estimated to detect 31% RPS11, 33% RPL36a, 10% of monosomes (i.e., individual 80 S ribosomes), and, by calculation, most polysomes (e.g., a calculated ~70% for a polysome with four 80 S ribosomes, an average ribosome cluster). Synaptic regions were determined using a custom-written algorithm and the diffraction-limited PSD95 or Bassoon immunolabeling signal. To identify the positions of excitatory synapses, local PSD95 (or Bassoon) puncta maxima and minima were identified and normalized to the same intensity range (0 for minima and 255 for maxima). Pixels of PSD95 puncta with over 12% intensity (30 in normalized intensity) of its associated, normalized local maximum (255 in normalized intensity) were selected to define the synaptic compartments. These local intensity thresholds resulted in puncta size estimates that were less affected by local intensity and background differences (e.g., the phenomena where brighter puncta appear larger by eye while less bright puncta appear smaller; fig. S3, right table) because of heterogeneity in staining or focusing. Puncta were eliminated if they are on the soma or more than 2 μm away from a dendritic shaft marked by MAP2 signal; Puncta with sizes smaller than 0.15 μm 2 were excluded from size-based analyses because of significant inaccuracy of size measurements at smaller spatial scales. Dendrites with a high level of background signal outside MAP2-labeled regions, dendrites containing overlapping signals with AHA labeling from glia, out-of-focus dendritic branches, and branches shorter than 5 μm were excluded from analyses. All in all, this created a synapse mask with a measured, average synapse density and synapse size distribution consistent with published values ( 17 ). This mask effectively enriched protein signals allocated into the synaptic area by excluding adjacent regions such as nearby proteins in the shaft (e.g., spine base). To evaluate adjacent regions such as the spine neck and base, a mask was generated to include an area of 1 μm in diameter centered on the PSD intensity maxima; analyses showed qualitatively consistent results. All localizations
📊 Figures

Fig. 1.
Quantitative, multiplexed, single-molecule localization of assembled ribosomes in neuronal dendrites and synapses.
( A ) A eukaryotic ribosome with RPL36a (magenta) and RPS11 (green; Protein Data Bank: 4V88). Bottom right: The coincidence detection of RPL36a and RPS11 by DNA-PAINT. ( B ) Representative images show...

Fig. 2.
Quantitative, multiplexed, single-molecule localization of locally synthesized nascent proteins and assembled ribosomes in neuronal dendrites and synapses.
( A ) Nascent proteins were metabolically labeled with AHA and subsequently conjugated with a single-strand DNA barcode for visualization. Right scheme shows that recurring, transient, fluorescent DNA...

Fig. 3.
During basal activity, levels of nascent synaptic protein correlated with synaptic Ca 2+ activity.
( A ) Wide-field micrograph of a neuronal dendrite after 24 hours of upscaling immunolabeled with dendritic and synaptic reference markers (MAP2 in green and PSD95 in magenta). Scale bar, 5 u03bcm. ( ...

Fig. 4.
A global increase in local protein supply was detected heterogeneously among synapses but homogeneously among dendritic segments of synapses during synaptic upscaling.
( A ) Scatter plots indicating the tagged protein (locally synthesized, nascent; same below) density (localization per micrometer) for 23 dendritic branches from six untreated cells (gray), 34 branche...
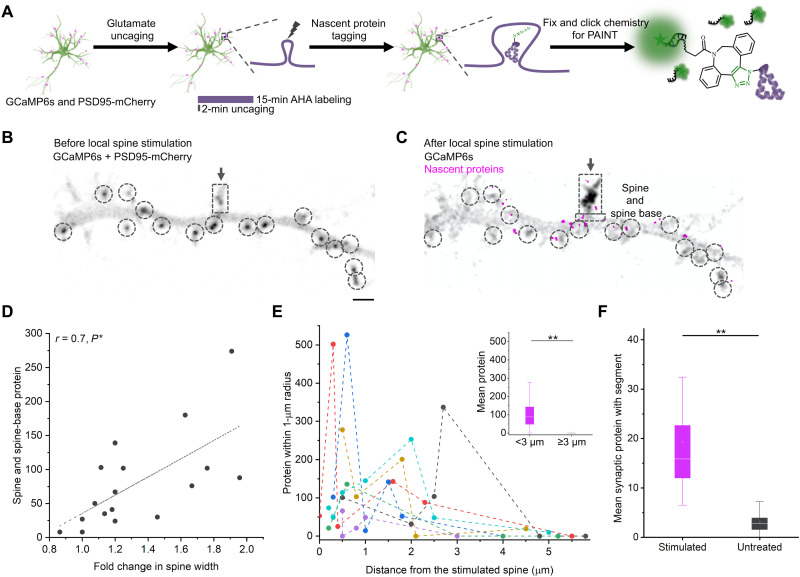
Fig. 5.
Single-spine stimulation induced a local increase in nascent protein among nearby synapses.
( A ) Cultured rat hippocampal neurons [12 days in vitro (DIV)] were transfected with GCaMP6s and PSD95-mCherry (see Materials and Methods) before single-spine stimulation (two-photon glutamate uncagi...
Figure images are served from the NIH/NLM PubMed Central Open Access Subset or Europe PMC; copyright remains with the publishers and authors.
💬 Discussion
0 commentsNo comments yet. Be the first to start a discussion!
Leave a Comment