Abstract
Cerebral blood flow (CBF) is controlled by arterial blood pressure, arterial CO 2 , arterial O 2 , and brain activity and is largely constant in the awake state. Although small changes in arterial CO 2 are particularly potent to change CBF (1 mmHg variation in arterial CO 2 changes CBF by 3%–4%), the coupling mechanism is incompletely understood. We tested the hypothesis that astrocytic prostaglandin E 2 (PgE 2 ) plays a key role for cerebrovascular CO 2 reactivity, and that preserved synthesis of glutathione is essential for the full development of this response. We combined two-photon imaging microscopy in brain slices with in vivo work in rats and C57BL/6J mice to examine the hemodynamic responses to CO 2 and somatosensory stimulation before and after inhibition of astrocytic glutathione and PgE 2 synthesis. We demonstrate that hypercapnia (increased CO 2 ) evokes an increase in astrocyte [Ca 2+ ] i and stimulates COX-1 activity. The enzyme downstream of COX-1 that synthesizes PgE 2 (microsomal prostaglandin E synthase-1) depends critically for its vasodilator activity on the level of glutathione in the brain. We show that, when glutathione levels are reduced, astrocyte calcium-evoked release of PgE 2 is decreased and vasodilation triggered by increased astrocyte [Ca 2+ ] i in vitro and by hypercapnia in vivo is inhibited. Astrocyte synthetic pathways, dependent on glutathione, are involved in cerebrovascular reactivity to CO 2 . Reductions in glutathione levels in aging, stroke, or schizophrenia could lead to dysfunctional regulation of CBF and subsequent neuronal damage. SIGNIFICANCE STATEMENT Neuronal activity leads to the generation of CO 2 , which has previously been shown to evoke cerebral blood flow (CBF) increases via the release of the vasodilator PgE 2 . We demonstrate that hypercapnia (increased CO 2 ) evokes increases in astrocyte calcium signaling, which in turn stimulates COX-1 activity and generates downstream PgE 2 production. We demonstrate that astrocyte calcium-evoked production of the vasodilator PgE 2 is critically dependent on brain levels of the antioxidant glutathione. These data suggest a novel role for astrocytes in the regulation of CO 2 -evoked CBF responses. Furthermore, these results suggest that depleted glutathione levels, which occur in aging and stroke, will give rise to dysfunctional CBF regulation and may result in subsequent neuronal damage.
🔬 Techniques
🔭 Microscopes
💻 Software
✨ Fluorophores
🧪 Sample Preparation
🔬 Cell Lines
🏭 Microscope Brands
🧪 Reagent Suppliers
🔴 Lasers
📷 Detectors
🔎 Objectives
💻 Software Details
💾 Data Repositories
🏛️ Research Organizations (ROR)
Affiliated research institutions:
📋 Methods
Slice preparation
Four hundred μm hippocampal-neocortical slices were prepared from male and female juvenile (postnatal age 16–21 d) Sprague Dawley rats. Treatment of animals was approved by the University of British Columbia Animal Care and Use Committee. As previously described ( Gordon et al., 2008 ), rats were anesthetized with halothane, decapitated, and the brains removed into ice-cold slicing solution containing the following (in m m ): 2.5 KCl, 26 NaHCO 3 , 0.5 CaCl 2 , 10 MgSO 4 , 1.25 NaH 2 PO 4 , 10 glucose, 230 sucrose, saturated with 95% O 2 /5% CO 2 . The 400 μm transverse hemi-sections were incubated at 32°C-34°C in aCSF containing the following (in m m ): 126 NaCl, 2.5 KCl, 26 NaHCO 3 , 2.0 CaCl 2 , 2.0 MgCl 2 , 1.25 NaH 2 PO 4 , 10 glucose, saturated with 95% O 2 /5% CO 2 for 60 min. For experiments, slices were at 22°C-24°C, aCSF was saturated with 20% O 2 /5% CO 2 , balanced N 2 , and perfused at ∼2 ml/min. Healthy slices can be maintained in 20% O 2 , which provides a pO 2 at the low end of the physiological range ( Gordon et al., 2008 ). Astrocytes were loaded with the caged IP 3 compound, NV-IP 3 /AM (5 μg/ml), and/or the Ca 2+ indicator rhod-2/AM (10 μ m , Invitrogen) as previously described ( Mulligan and MacVicar, 2004 ; Gordon et al., 2008 ). Slices were loaded with monochlorobimane (MCB, Fluka) in the dark at room temperature for 30 min as previously described ( Robillard et al., 2011 ).
Two-photon imaging and uncaging in acute brain slices
A two-photon laser-scanning microscope (Zeiss LSM510-Axioskop-2 fitted with a 40×-W/1.0 numerical aperture objective lens) coupled to a Chameleon ultra II Ti:sapphire laser (∼140 fs pulses 80 MHz, Coherent) provided excitation of rhod-2 and was used to uncage IP 3 . Images were acquired 50–100 μm below the slice surface. Rhod-2 fluorescence imaging and two-photon uncaging were performed using laser settings and emission filters as previously described ( Gordon et al., 2008 ). MCB was excited at 780 nm and detected with a PMT at 512–562 nm as previously described ( Robillard et al., 2011 ). Arterioles (defined as vessels with diameter >10 μm, surrounded by a visible layer of smooth muscle cells) were imaged by acquiring the transmitted laser light and using IR-DIC optics. Glutathione and PgE 2 measurements Protocols in suppliers' instructions were followed for the PgE 2 ELISA and glutathione assays. When measuring PgE 2 release from acute brain slices, TTX (1 μ m , Alamone Labs) was added to dampen neuronal activation. PgE 2 release from acute brain slices was measured using a Specific Parameter PgE 2 ELISA kit (R&D systems). Measurements of tissue glutathione levels were made using a specific total glutathione assay kit from either BioVision or Assay Designs.
Show full methods section
Slice preparation
Four hundred μm hippocampal-neocortical slices were prepared from male and female juvenile (postnatal age 16–21 d) Sprague Dawley rats. Treatment of animals was approved by the University of British Columbia Animal Care and Use Committee. As previously described ( Gordon et al., 2008 ), rats were anesthetized with halothane, decapitated, and the brains removed into ice-cold slicing solution containing the following (in m m ): 2.5 KCl, 26 NaHCO 3 , 0.5 CaCl 2 , 10 MgSO 4 , 1.25 NaH 2 PO 4 , 10 glucose, 230 sucrose, saturated with 95% O 2 /5% CO 2 . The 400 μm transverse hemi-sections were incubated at 32°C-34°C in aCSF containing the following (in m m ): 126 NaCl, 2.5 KCl, 26 NaHCO 3 , 2.0 CaCl 2 , 2.0 MgCl 2 , 1.25 NaH 2 PO 4 , 10 glucose, saturated with 95% O 2 /5% CO 2 for 60 min. For experiments, slices were at 22°C-24°C, aCSF was saturated with 20% O 2 /5% CO 2 , balanced N 2 , and perfused at ∼2 ml/min. Healthy slices can be maintained in 20% O 2 , which provides a pO 2 at the low end of the physiological range ( Gordon et al., 2008 ). Astrocytes were loaded with the caged IP 3 compound, NV-IP 3 /AM (5 μg/ml), and/or the Ca 2+ indicator rhod-2/AM (10 μ m , Invitrogen) as previously described ( Mulligan and MacVicar, 2004 ; Gordon et al., 2008 ). Slices were loaded with monochlorobimane (MCB, Fluka) in the dark at room temperature for 30 min as previously described ( Robillard et al., 2011 ).
Two-photon imaging and uncaging in acute brain slices
A two-photon laser-scanning microscope (Zeiss LSM510-Axioskop-2 fitted with a 40×-W/1.0 numerical aperture objective lens) coupled to a Chameleon ultra II Ti:sapphire laser (∼140 fs pulses 80 MHz, Coherent) provided excitation of rhod-2 and was used to uncage IP 3 . Images were acquired 50–100 μm below the slice surface. Rhod-2 fluorescence imaging and two-photon uncaging were performed using laser settings and emission filters as previously described ( Gordon et al., 2008 ). MCB was excited at 780 nm and detected with a PMT at 512–562 nm as previously described ( Robillard et al., 2011 ). Arterioles (defined as vessels with diameter >10 μm, surrounded by a visible layer of smooth muscle cells) were imaged by acquiring the transmitted laser light and using IR-DIC optics. Glutathione and PgE 2 measurements Protocols in suppliers' instructions were followed for the PgE 2 ELISA and glutathione assays. When measuring PgE 2 release from acute brain slices, TTX (1 μ m , Alamone Labs) was added to dampen neuronal activation. PgE 2 release from acute brain slices was measured using a Specific Parameter PgE 2 ELISA kit (R&D systems). Measurements of tissue glutathione levels were made using a specific total glutathione assay kit from either BioVision or Assay Designs.
Immunohistochemistry
Rats were anesthetized with halothane, given an intraperitoneal injection of urethane (0.5 ml of 30% urethane per 50 g body weight), and perfused with saline (0.9% NaCl in 0.1 m phosphate buffer) followed by 4% PFA (in 0.1 m PBS). The brain was extracted, postfixed (10% sucrose in 4% PFA) overnight, and cryoprotected (30% sucrose in PBS) overnight. Using a cryostat, 40 μm serial sections in the horizontal plane were collected throughout the brain. Free-floating sections were blocked with 10% normal goat serum (Jackson ImmunoResearch Laboratories) and 0.4% Triton X-100 in PBS for 1 h and incubated in PBS containing 0.1% Triton X-100 and primary antibodies against PgE 2 synthase (anti-mPgES-1) ( Olajide et al., 2014 ; Tuure et al., 2015 ) (Agrisera, catalog #AS03 031, 1:200) as well as an astrocyte phenotypic marker (anti-GFAP ( Lathia et al., 2008 ) (Sigma, catalog #G3893, clone #G-A-5, 1:500) overnight at 4°C. Tissue was rinsed and incubated in AlexaFluor-488 goat anti-mouse and AlexaFluor-546 goat anti-rabbit secondary antibodies (Invitrogen: diluted 1:500 in PBS, 2.5% normal goat serum and 0.4% Triton X-100) for 1.5 h at room temperature. The tissue was rinsed, mounted onto slides, and coverslipped using Fluorsave mounting medium (Calbiochem). Images were acquired with an Olympus Fluoview FV1000 confocal microscope. Drugs trans-ACPD (tACPD), clonidine, norepinephrine (NE; Sigma), and PgE 2 (Cayman Chemicals) were bath applied for 5–10 min. SC560 (Sigma) was preincubated for 30 min ( Blanco et al., 2008 ) followed by bath application and buthionine sulfoximine (BSO; Sigma) was preincubated for 2.5 h ( Sun et al., 2006 ) followed by bath application throughout the experiment. NV-IP 3 /AM was synthesized by G. Ellis-Davies. Animals: in vivo blood flow measurements in rats All procedures were approved by the University of Oxford Ethical Review Committee and complied with the requirements of the Animals (Scientific Procedures) Act, 1986, United Kingdom. Animals were housed in an animal housing facility in a 12 h alternating light:dark cycle with ad libitum access to food and water. Male Wistar rats were used (256–367 g).
Intracerebral injection
For surgical procedures, rats were anesthetized with 4% isoflurane and maintained at 1.5%–2% isoflurane in 30% O 2 and 70% N 2 . Each rat was placed in a stereotaxic frame and the skull exposed. A burr hole was drilled at 1 mm caudal and 4.2 mm lateral to bregma, and the dura mater was finely dissected away to expose the cortex. Twenty μl of 80 mg/ml BSO ( Pileblad and Magnusson, 1989 ) or 0.9% saline was infused by a microinfusion pump at a rate of 2 μl/min into the right whisker barrel cortex at a depth of 2.3 mm from the brain's surface. This dose of BSO has previously been shown to adequately reduce GSH within 24 h of administration ( Pileblad and Magnusson, 1989 ), and we showed that BSO administered in this way could decrease GSH levels in the ipsilateral cortex by 45%, 24 h after injection (see Fig. 5 C ), and in the ipsilateral striatum by 31% (GSH measured in saline-treated: 0.61 ± 0.03 mM, BSO-treated: 0.42 ± 0.08 mM, p = 0.045, n = 7 per group, mean ± SEM). After the infusion, bone wax was placed over the burr hole and the wound was closed with 3–0 sutures. Animals recovered for 24 h before assessment of GSH levels ( n = 7 per group) or evoked blood flow responses ( n = 6–10 per group). Whisker pad stimulation and hypercapnia: in vivo blood flow measurements At 24 h after BSO/saline treatment, animals had their left femoral artery cannulated for blood gas measurement and were tracheotomized and ventilated with 1.25% isoflurane in 30% O 2 and 70% N 2 . A laser Doppler probe (Perimed) to monitor relative CBF was placed over the right whisker barrel cortex (where the intracerebral injection was made) and bipolar stimulating electrodes were placed in the left whisker pad. For some experiments, a local field potential (LFP) electrode for neuronal activity was also placed on the exposed cortex to monitor neuronal activity. All animals had a steady-state blood gas ( Table 1 ) before beginning experiments. Table 1. Blood gases for BSO experiment (Nota Bene blood gases taken 24 h after drug but before hypercapnia and whisker stimulation experiments) a Treatment pH pCO 2 (mmHg) pO 2 (mmHg) Saline 7.47 (0.01) 34.5 (2.3) 161 (4) BSO b 7.46 (0.01) 35.8 (1.5) 154 (7) a Data are mean (SEM). b An inhibitor of γ-glutamylcysteine synthetase. An electrical stimulus (10 Hz, 16 s duration, 1.6 mA, 0.3 ms pulsewidth, 60 s interstimulation interval) to evoke a blood flow response in the right whisker barrel cortex was performed for 10 trials per animal. Following this, animals were exposed to 10% CO 2 for 30 s at 3 min intervals repeated 4 or 5 times to induce hypercapnic blood flow responses. Animals were killed and the cortex dissected for measurement of GSH levels. For SC560 experiments, naive rats were anesthetized with isoflurane. Anesthesia was induced with 4% isoflurane and maintained during surgery with 2% isoflurane. During stimulation, anesthesia was maintained with 1.25% isoflurane. Isoflurane was carried in 30% O 2 and 70% N 2 . Rats had their left femoral artery and vein cannulated, and were also tracheotomized and ventilated. A laser speckle camera (Moor Instruments) was used to monitor relative CBF over a thin skull window over the right whisker barrel cortex while an LFP electrode for neuronal activity was inserted through a burr hole. Bipolar stimulating electrodes were placed in the left whisker pad. Animals had a steady-state blood gas before and after drug administration ( Table 2 ). An electrical stimulus (10 Hz, 16 s duration, 1.6 mA, 0.3 ms pulsewidth, 60 s interstimulation interval) to evoke a blood flow response in the right whisker barrel cortex was performed for 10 trials per animal. Following this, animals were exposed to 10% CO 2 for 30 s at 3 min intervals repeated four times to induce a hypercapnic blood flow response. Animals were then administered 5 mg/kg SC560 or 10% DMSO (vehicle) intravenously. SC560 is a highly lipophilic COX-1 inhibitor and distributes widely into tissues ( Teng et al., 2003 ), and this dose was chosen for maximal target efficiency ( Zhang et al., 2003 ). After 20 min, the effect of COX-1 inhibition on the evoked CBF responses to whisker stimulation and hypercapnia was measured. Table 2. Blood gases for SC560 intravenous experiment (Nota Bene blood gases taken before and after drug administration) a Condition Treatment pH pCO 2 (mmHg) pO 2 (mmHg) Predrug DMSO 7.47 (0.01) 33.5 (1.5) 164 (5) SC560 7.45 (0.01) 36.8 (1.2) 140 (5) Postdrug DMSO 7.46 (0.01) 34.1 (0.6) 156 (6) SC560 7.45 (0.03) 37.1 (2.1) 140 (5) a Data are mean (SEM). Animals: in vivo calcium imaging For in vivo experiments, all procedures involving animals were approved by the Danish National Ethics Committee according to the guidelines set forth in the European Council's Convention for the Protection of Vertebrate Animals used for Experimental and Other Scientific Purposes. The 8- to 10-week-old male C57BL/6J mice were used. In vivo calcium imaging For experiments involving mice, anesthesia was induced with bolus injections of the α2-adrenergic receptor agonist xylazine (10 mg/kg i.p.) and the NMDA-receptor antagonist ketamine (60 mg/kg i.p.). Anesthesia was maintained during surgery with supplemental doses of ketamine (30 mg/kg/20 min i.p.). Upon completion of all surgical procedures, anesthesia was switched to continuous infusion with α-chloralose (50 mg/kg/h i.v.). Calcium activity during hypercapnia was measured in vivo in eight C57BL/6J mice. A craniotomy over the somatosensory cortex was covered with agarose and partly sealed with a glass coverslip. Oregon Green Bapta-1/AM (OGB; Invitrogen) was dissolved in DMSO and Pluronic F-127 (10%, BASF Global) and diluted in aCSF to yield a final dye concentration of 0.8 m m . It was mixed with the astrocyte marker sulforhodamine 101 (SR101; Sigma-Aldrich, 100 μ m ) ( Nimmerjahn et al., 2004 ) and was pressure injected (4–6 psi, 4 s) into the somatosensory cortex through a micropipette at a depth of 100–150 μm below the cortical surface. Ca 2+ imaging was performed using a commercial two-photon microscope (SP5 multiphoton/confocal Laser Scanning Microscope; Leica), and a Mai Tai HP Ti:sapphire laser (Millennia Pro, Spectra Physics) with a 20× 1.0 NA-water-immersion objective (Leica). The excitation wavelength was 820 nm. The emitted light was filtered to retain both red and green light using a TRITC/FITC filter. The hypercapnia challenge was presented as follows: Following 1 min baseline recording, 10% CO 2 in air was applied for 30 s and imaging continued for subsequent 4 min. Five trials were performed with 3 min between trials. For each animal, a second field of view was selected and the hypercapnia challenge repeated. Blood gases were taken after each experiment, and all mice had pCO 2 in the range 30–40 mmHg and pO 2 in the range 95–130 mmHg. Data collection, analysis, and statistics In vitro data. An image (512 × 512 pixels) was collected in 7.86–12.68 s, using 8-line averaging. Measurements of lumen diameter and Ca 2+ changes were performed offline with Zeiss LSM (version 3.2) software and ImageJ (National Institutes of Health). As previously described ( Gordon et al., 2008 ), fluorescence signals were defined as F / F 0 (%) = [( F 1 − B 1 )/( F 0 − B 0 )]100, where F 1 and F 0 are fluorescence at a given time and the mean fluorescence during the control period, respectively. B 1 and B 0 are the corresponding background fluorescence signals, taken from the neuropil. Pseudo-color images show absolute changes in fluorescence (ImageJ, 16-color linear Lut). Experimental values are mean ± SEM; n is the number of experiments conducted or, for calcium changes, number of astrocytes analyzed. Either a two-tailed Student's t test or a one-way ANOVA with a Newman–Keuls post hoc test for comparison between multiple groups was used, and p < 0.05 was considered statistically significant. As these were novel experiments, the effect size was unknown before the experiment. Therefore, sample size estimates were based on our previous experience. Experiments were alternately performed under control or treatment conditions with slices chosen at random for each experiment. Data were excluded from analysis if any of the following occurred during imaging: unstable baseline vessel diameters or astrocyte calcium levels, or movement leading to significant focus changes during the experiment. To perform statistical analysis, data were assumed to be normally distributed. In vivo data. All laser Doppler and LFP data were collected in Spike 2 software, whereas laser speckle data were collected using Moor FLPI software. Quantification of CBF changes and electrophysiology were performed in MATLAB (The MathWorks, version 7.12). To obtain the region of interest (ROI) for calculation of CBF changes using laser speckle imaging, a principal components analysis was used to identify the focal point of the change in response to stimulation. The same region of interest was used within each animal's data. Experimental values are the mean ± SEM, and n is the number of animals. To perform statistical analysis, data were assumed to be normally distributed. An F test was used to compare variances of groups being statistically compared. For CBF data, a one-tailed t test with Welch's correction (as groups had significantly different variances) was used to compare means between groups. A two-tailed t test was used to compare means of groups for both GSH analysis (see Fig. 5 C ) and electrophysiology data in response to whisker pad stimulation (Welch-corrected for SC560 experiment, see Fig. 6 C ). For electrophysiology data collected during hypercapnia challenge experiments, a two-way ANOVA with Bonferroni correction for multiple comparisons was used to compare means between groups. p < 0.05 was considered statistically significant. For experiments involving rats, due to effect sizes being unknown before experiment, sample size estimates were based on previously published sample sizes (e.g., Niwa et al., 2001 ). Assignment of animals was alternated between treatment and control groups, and neither experiments nor analysis were blinded. Three animals were excluded from all data analysis (1 for SC560 and 2 for BSO) due to technical problems with experimental equipment. For in vivo calcium imaging, frame size was 256 × 256 pixels (189–207 ms/frame) during recordings. The Ca 2+ changes were evaluated as the average change in fluorescence relative to baseline levels in ROIs. The ROIs were placed based on morphology over neuronal or astrocytic soma, or neuropil. Because of movement of astrocytes during hypercapnia, within or out of focus, ROIs were evaluated based on the level of SR101 loading in the red channel. If a significant change occurred, the ROI was disregarded in all following assessments. An increase in fluorescence within an ROI was classified as a calcium response if the mean fluorescence value within the period of hypercapnia was >2 SDs of baseline activity. The delay of the Ca 2+ response was found by subtracting the signal onset time from the time hypercapnia was introduced to the animal. To estimate response start and termination time, a fit was made to the data and the first- and second-order derivatives were calculated. The response onset time was found by taking the maximum peak of the second order derivative of the fitted data. The duration of the Ca 2+ response was then found by subtracting the response onset time from the response termination time. The response termination time was defined as the time point when the fitted data went below mean baseline Ca 2+ levels or the recording ended. Experimental values are expressed as mean ± SEM. A paired t test was used for the calcium imaging data, each animal served as its own control. p < 0.05 was accepted as statistically significant. For experiments involving mice, as there have been no previous studies reporting astroglial calcium changes during hypercapnia, it was impossible to estimate an expected value for change in fluorescence or its SD. Hence, no sample size calculation could be performed. However, we expected similar calcium changes to those we observe for low-frequency whisker stimulation, and so sample sizes were based on our previous experiments (6–8 mice). Calcium signals obtained during hypercapnia exceeded an SNR of 4:1, and hypercapnia-induced calcium responses were recorded in every animal tested. As all mice were subjected to hypercapnia, there was no randomization method used. Control measurements of calcium activity (i.e., activity without application of hypercapnia) were taken at random time points during the experiment. Analysis of calcium changes was not blinded, assessment of these changes was based on a MATLAB program, which analyzes the image sequences in an unbiased manner, rather than by visual inspection.
📊 Figures
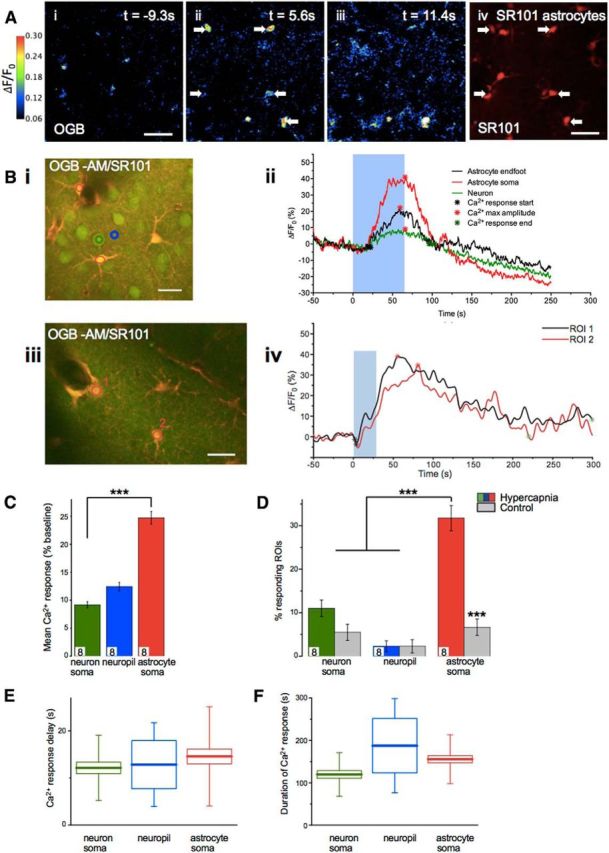
Figure 1.
Astrocyte [Ca 2+ ] i transients are evoked by CO 2 in vivo . A , Example still images of mouse cortical layer II/III from 2PLSM. OGB is used as a calcium indicator ( Aiu2013Aiii ) and sulforhodamine 1...
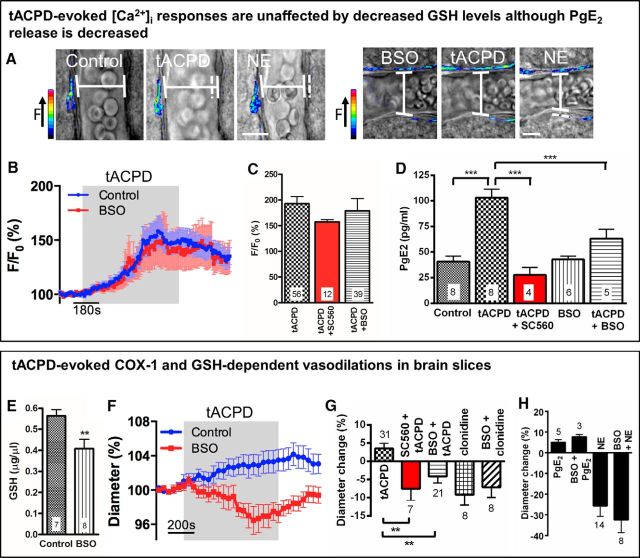
Figure 2.
Astrocyte [Ca 2+ ] i signals evoke COX-1- and GSH-dependent vasodilations in vitro . A , 2PLSM imaging: example Ca 2+ and arteriole diameter changes in response to tACPD with and without BSO. Images r...
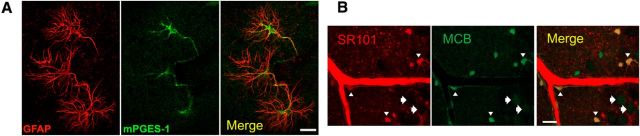
Figure 3.
Astrocytes express mPGES-1 and contain high levels of GSH. A , Immunohistochemistry showing astrocytic expression of GSH-dependent mPGES-1 in the CA3 of the hippocampus. Astrocyte marker, GFAP (red), ...
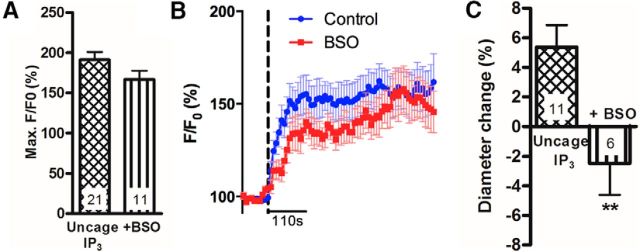
Figure 4.
Astrocyte [Ca 2+ ] i transient-evoked vasodilations are GSH dependent in vitro . A , Mean IP 3 -evoked increases in astrocyte [Ca 2+ ] i . Control, n = 21 from 6 rats; +BSO, n = 11 from 4 rats. B , Me...
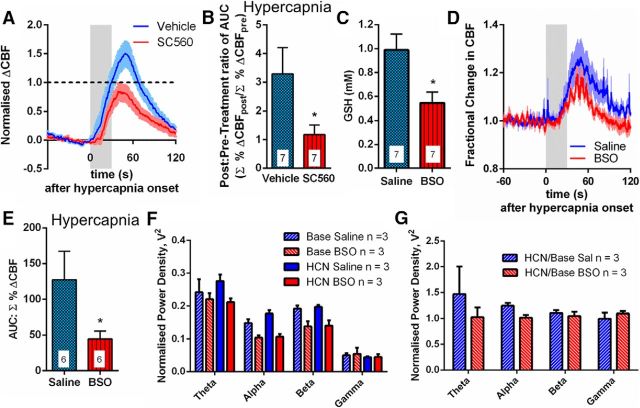
Figure 5.
CO 2 evoked CBF responses in vivo are GSH dependent. A , Mean traces of local CBF response to hypercapnia, measured by laser speckle contrast imaging, in vehicle (DMSO)- (blue) and SC560- (red) inject...
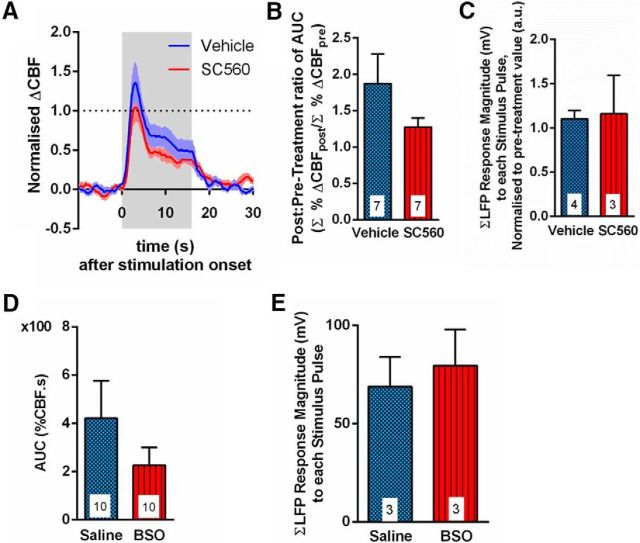
Figure 6.
CBF responses to whisker pad stimulation in vivo are independent of GSH. A , Mean time course of local CBF response to whisker pad stimulation, measured by laser speckle contrast imaging, in vehicle (...
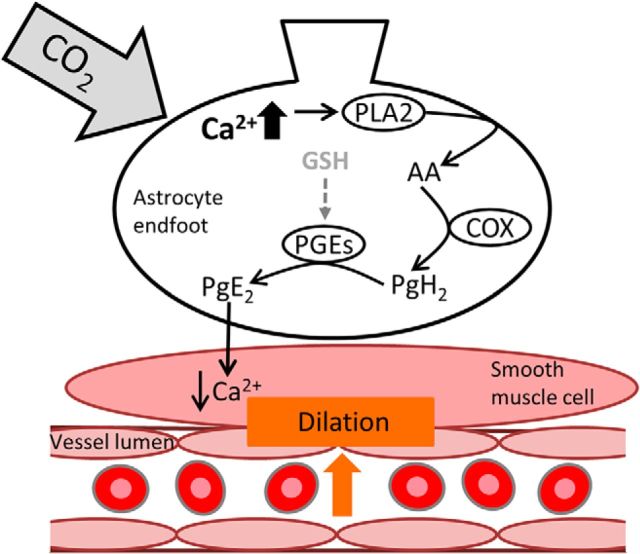
Figure 7.
Increases in astrocytic [Ca 2+ ] i may lead to GSH-dependent, PgE 2 -mediated vasodilation. Schematic diagram depicting how CO 2 -evoked increases in astrocytic [Ca 2+ ] i may lead to PgE 2 -mediated ...
Figure images are served from the NIH/NLM PubMed Central Open Access Subset or Europe PMC; copyright remains with the publishers and authors.
💬 Discussion
0 commentsNo comments yet. Be the first to start a discussion!
Leave a Comment