Abstract
During experimental cerebral malaria (ECM) mice develop a lethal neuropathological syndrome associated with microcirculatory dysfunction and intravascular leukocyte sequestration. The precise spatio-temporal context in which the intravascular immune response unfolds is incompletely understood. We developed a 2-photon intravital microscopy (2P-IVM)-based brain-imaging model to monitor the real-time behaviour of leukocytes directly within the brain vasculature during ECM. Ly6C(hi) monocytes, but not neutrophils, started to accumulate in the blood vessels of Plasmodium berghei ANKA (PbA)-infected MacGreen mice, in which myeloid cells express GFP, one to two days prior to the onset of the neurological signs (NS). A decrease in the rolling speed of monocytes, a measure of endothelial cell activation, was associated with progressive worsening of clinical symptoms. Adoptive transfer experiments with defined immune cell subsets in recombinase activating gene (RAG)-1-deficient mice showed that these changes were mediated by Plasmodium-specific CD8(+) T lymphocytes. A critical number of CD8(+) T effectors was required to induce disease and monocyte adherence to the vasculature. Depletion of monocytes at the onset of disease symptoms resulted in decreased lymphocyte accumulation, suggesting reciprocal effects of monocytes and T cells on their recruitment within the brain. Together, our studies define the real-time kinetics of leukocyte behaviour in the central nervous system during ECM, and reveal a significant role for Plasmodium-specific CD8(+) T lymphocytes in regulating vascular pathology in this disease.
🔬 Techniques
🔭 Microscopes
🧬 Organisms
✨ Fluorophores
🧪 Sample Preparation
🔬 Cell Lines
🏭 Microscope Brands
🧪 Reagent Suppliers
🔴 Lasers
💻 Software Details
💾 Data Repositories
🏛️ Research Organizations (ROR)
Affiliated research institutions:
📋 Methods
An improved methodology for visualizing leukocyte trafficking during ECM We have recently established an intravital imaging model that allows us to visualize the superficial intact pial vasculature in living mice in situ ( Fig. S3 ) [27] . In order to gain a better understanding of how leukocytes contribute to vascular inflammation during ECM, we adopted this approach for mice infected with PbA. The main obstacle with imaging ECM is that, often, mice may progress to severe disease within only a few hours thereby leaving a short time window for surgical preparation and intravital imaging. We therefore opted for an open skull preparation, whereby a cranial window is prepared by skull bone removal under the least possible traumatic conditions and the shortest possible time frame (∼70 min). We observed that mice that developed NS resisted anaesthetic action. To overcome this, we allocated increased anaesthesia time for infected mice (3 times longer than healthy mice). Further, mice with an NS score of 4 occurrences. Values for each feature were added to provide a single histopathological score.
Cranial window preparation
Mice were prepared for intravital imaging of the brain as previously described [27] . Briefly, animals were anaesthetised by i.p. injection of Ketamine (100 mg/kg of body weight) (Cenvet) and Xylazine (10 mg/kg of body weight) (Cenvet). Buprenorphine (Cenvet) was administered at 100 µg/kg of body weight i.p. for lasting pain relief. Animals were monitored for awareness signs such as whisker twitching, palpebral (blink) reflex, pedal withdrawal reflex and respiration rate, and surgical procedures were initiated only after the animal entered a deep state of anaesthesia ( Table S1 ). A primary dose of Ketamine/Xylazine mixture was given increased time for anaesthetic action (3 times longer than healthy mice) and a booster dose was administered only after this time. Importantly, anaesthetic strategy was individually tailored to each mouse—for example, mice with paraparesis (partial paralysis in the lower limbs) were expected to take 3 times as long as healthy mice to lose their pedal-withdrawal reflex. Loss or regain of reflexes was closely monitored throughout the procedure and booster doses of Ketamine and Xylazine were administered as required. Anaestethized mice were placed on a heat pad (Fine Science Tools) and core body temperature was monitored using a rectal probe (Fine Science Tools), as described [27] . The head of the mouse was restrained in a stereotaxic frame, and the skull was exposed by making a mid-line incision in the scalp. The periosteum was removed and a circular incision was made in the parietal bone using a pneumatic dental drill to yield a cranial flap. The flap was lifted gently without damaging the dura mater underneath. Minor bleeding was controlled using gelfoam bits and the cranial window was bathed in pre-warmed artificial cerebrospinal fluid (aCSF) (132 mM NaCl, 2.95 mM KCl, 1.71 mM CaCl 2 .2H 2 0, 1.4 mM MgSO 4 , 6.7 mM Urea, 24.6 mM NaHCO 3 , 3.71 mM glucose, pH 7.4) [27] . The chamber was sealed with a coverslip held in place with vacuum grease.
Show full methods section
An improved methodology for visualizing leukocyte trafficking during ECM We have recently established an intravital imaging model that allows us to visualize the superficial intact pial vasculature in living mice in situ ( Fig. S3 ) [27] . In order to gain a better understanding of how leukocytes contribute to vascular inflammation during ECM, we adopted this approach for mice infected with PbA. The main obstacle with imaging ECM is that, often, mice may progress to severe disease within only a few hours thereby leaving a short time window for surgical preparation and intravital imaging. We therefore opted for an open skull preparation, whereby a cranial window is prepared by skull bone removal under the least possible traumatic conditions and the shortest possible time frame (∼70 min). We observed that mice that developed NS resisted anaesthetic action. To overcome this, we allocated increased anaesthesia time for infected mice (3 times longer than healthy mice). Further, mice with an NS score of 4 occurrences. Values for each feature were added to provide a single histopathological score.
Cranial window preparation
Mice were prepared for intravital imaging of the brain as previously described [27] . Briefly, animals were anaesthetised by i.p. injection of Ketamine (100 mg/kg of body weight) (Cenvet) and Xylazine (10 mg/kg of body weight) (Cenvet). Buprenorphine (Cenvet) was administered at 100 µg/kg of body weight i.p. for lasting pain relief. Animals were monitored for awareness signs such as whisker twitching, palpebral (blink) reflex, pedal withdrawal reflex and respiration rate, and surgical procedures were initiated only after the animal entered a deep state of anaesthesia ( Table S1 ). A primary dose of Ketamine/Xylazine mixture was given increased time for anaesthetic action (3 times longer than healthy mice) and a booster dose was administered only after this time. Importantly, anaesthetic strategy was individually tailored to each mouse—for example, mice with paraparesis (partial paralysis in the lower limbs) were expected to take 3 times as long as healthy mice to lose their pedal-withdrawal reflex. Loss or regain of reflexes was closely monitored throughout the procedure and booster doses of Ketamine and Xylazine were administered as required. Anaestethized mice were placed on a heat pad (Fine Science Tools) and core body temperature was monitored using a rectal probe (Fine Science Tools), as described [27] . The head of the mouse was restrained in a stereotaxic frame, and the skull was exposed by making a mid-line incision in the scalp. The periosteum was removed and a circular incision was made in the parietal bone using a pneumatic dental drill to yield a cranial flap. The flap was lifted gently without damaging the dura mater underneath. Minor bleeding was controlled using gelfoam bits and the cranial window was bathed in pre-warmed artificial cerebrospinal fluid (aCSF) (132 mM NaCl, 2.95 mM KCl, 1.71 mM CaCl 2 .2H 2 0, 1.4 mM MgSO 4 , 6.7 mM Urea, 24.6 mM NaHCO 3 , 3.71 mM glucose, pH 7.4) [27] . The chamber was sealed with a coverslip held in place with vacuum grease.
2-photon intravital microscopy
All the intravital imaging experiments in this study were performed for up to 1.5 hours, as described previously [27] . Where extended recordings of more than 1.5 hours are required, we recommend the addition of a superfusion chamber containing aCSF as shown in Fig. S3 [27] . Imaging was performed using a LaVision Biotec Trimscope II single-beam 2-photon microscope (Bielefeld, Germany) attached to an Olympus BX-51 fixed-stage microscope equipped with 20× (NA0.8) water-immersion objective. The setup included external non-descanned dual-channel/fluorescence detectors and a diode-pumped, wide-band mode-locked Ti∶Sapphire femtosecond laser (MaiTai HP; Spectraphysics, 720–1050 nm, pulse length 140 fs; 90 MHz repetition rate). To label blood vessels, 800 µg of TRITC-conjugated dextran (Invitrogen) dissolved in saline or Evans blue conjugated to BSA was injected i.v. just prior to imaging. For data acquisition, firstly a suitable field of view was selected in the upper left region of the cranial window. The brain was exposed to polarized laser light at a wavelength of 900 nm, and x-y-t data of a 300 µm×300 µm plane at a resolution of 0.6 µm pixel −1 was captured at the rate of 1 frame per second. A minimum 120 to a maximum 600 frames were collected and sometimes combined with 3-dimensional z stacks to create x-y-z-t time-lapse images. The next field of view was recorded by moving horizontally across to the next 300 µm×300 µm plane within the cranial window. Only fields of view with at least 1 blood vessel were recorded. A minimum 29 to a maximum 123 blood vessels were assessed for each group of mice.
Data analysis
Post-acquisition image analysis was carried out using Volocity software. Firstly, each blood vessel was annotated with a unique identity code. For the analysis of leukocyte behaviour, each blood vessel was initially assessed for intact blood flow present for the entire duration of the recording. Intact blood flow was defined by the presence of high velocity, freely flowing leukocytes (at least one free flowing cell during the observation period). The area of each blood vessel was derived by measuring its length and diameter. The phenotype of the blood vessels and its tributaries were assessed for brightness, size, central reflex, wall thickness and direction of flow [77] . As relying solely on phenotypic features can lead to misclassification of arteries and veins, we used a functional parameter that is widely utilised to distinguish the two. Diverging vessels with outflow of blood were classified as arteries and converging vessels with inflow of blood were classified as veins. Data were collated only from large post capillary venules. Leukocytes were tracked as they entered the field of view and over the entire observation period. Rolling cells were defined as single, round-shaped cells moving in the direction of the blood flow at a lower speed than free flowing cells. Adherent cells were defined as single cells that remain stationary for 30 seconds or longer. To normalise for variability in blood vessel diameter, the average number of rolling cells per mm 2 of blood vessel over a period of 1 min and the number of adherent cells per mm 2 of blood vessel were calculated. The mean rolling velocity (V mean ) of leukocytes was defined as the distance travelled by rolling cells per second. The percentage of blood vessels within the cranial window with varying degrees of leukocyte infiltration, as defined in results below, was calculated.
Statistical analysis
Differences in survival of treatment groups were analysed using the Mantel-Cox log-rank test. Correlations were calculated and plotted using Prism (Graphpad Prism software). For comparison of two groups, the Student's t -test (normally distributed) or the Mann-Whitney U test (not normally distributed) were used. For multiple comparisons, one-way ANOVA was used. A difference between groups was considered significant if p1.5 hours. (TIF) Click here for additional data file. Figure S4 GFP + leukocytes sequestering to the vascular endothelium are monocytes. PbA-infected MacGreen mice with NS were sacrificed and brains were harvested. Whole mount brain sections were treated with anti-Ly6C or anti-Ly6G antibodies. Anti-CD31 antibodies were used for delineating the blood vessels. A series of single z-stack images were acquired by confocal microscopy. A representative single z-stack image shows the co-localisation of Ly6C but not Ly6G with GFP. Scale bars represent 10 µm. (TIF) Click here for additional data file. Figure S5 Locomotion pattern of monocytes during clinical progression of ECM. ( A ) Quantitative analysis of the mean track velocity of monocytes during ES on day 5–6 p.i. (n = 5 mice) and ( B ) NS on day 7 p.i. (n = 3 mice). The speed at which monocytes travel per second in the blood vessel (instantaneous velocity) was calculated for ( C ) ES on day 5–6 p.i. and ( D ) NS on day 7 p.i. Three representative monocyte tracks are shown for each group. ( E ) Comparison of the V mean of GFP + monocytes in moderately and severely inflamed venules. Calculations were derived from 125 and 20 cell tracks. ****P
📊 Figures
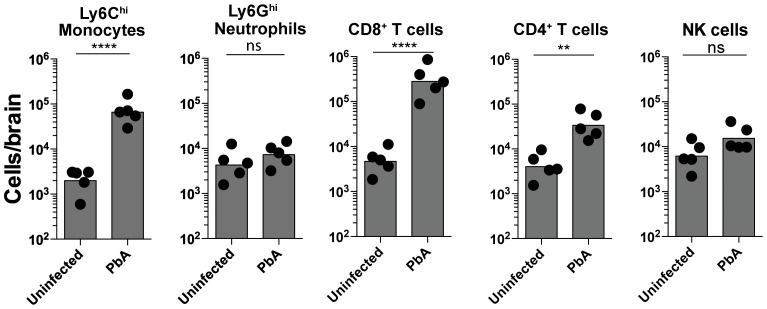
Figure 1
Monocytes and CD8 + T lymphocytes accumulate in the brain during ECM.
Uninfected and PbA-infected C57BL/6 mice with NS were sacrificed on day 7 p.i. and brains harvested. Quantitative analysis of BSL is shown. Symbols represent individual animals. Bars represent the geo...
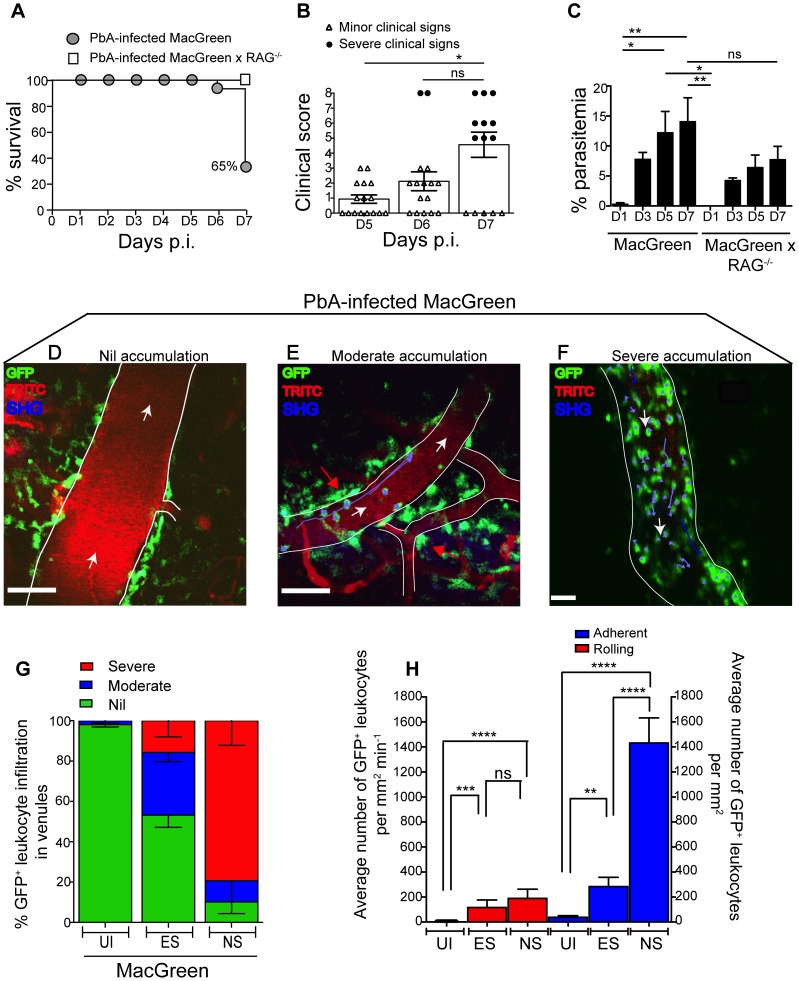
Figure 2
Visualizing the behaviour of GFP + leukocytes in the brain microvasculature.
PbA-infected MacGreen (nu200a=u200a16) and MacGreenu00d7RAG u2212/u2212 mice (nu200a=u200a4) were monitored for ( A ) % survival to pre-defined clinical endpoint, ( B ) clinical score of each mouse on...
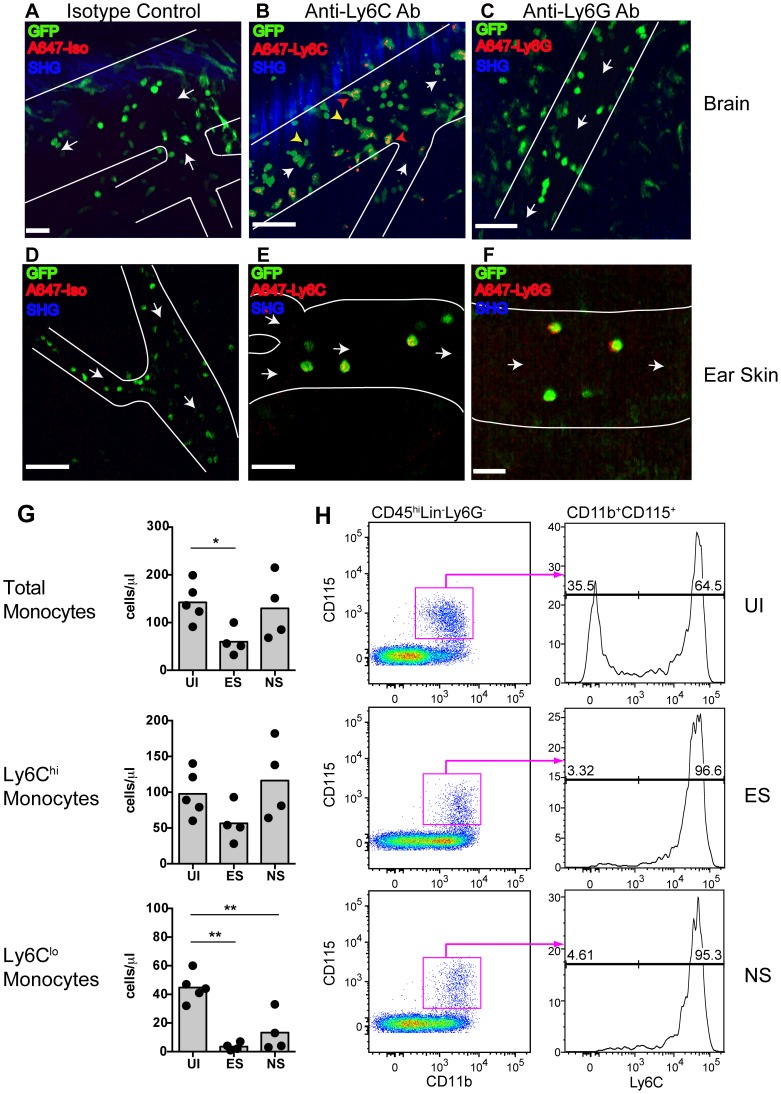
Figure 3
Endothelium-interacting GFP + leukocytes in the brain microvasculature are monocytes.
PbA-infected MacGreen mice with NS were injected i.v. with 5 u00b5g of either ( A ) an isotype control, ( B ) anti-Ly6C (nu200a=u200a2) or ( C ) anti-Ly6G antibody (nu200a=u200a2) 1 hour prior to mice...
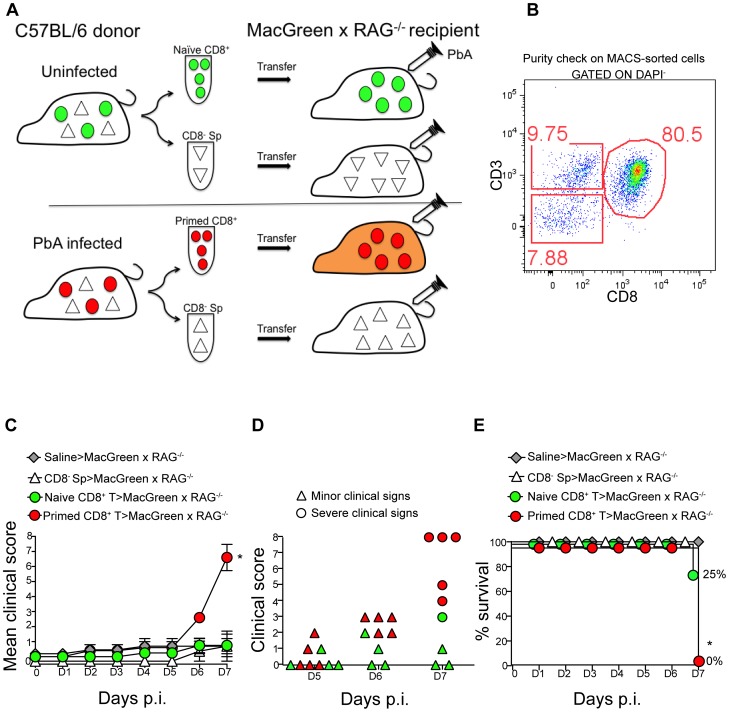
Figure 4
An adoptive transfer model to study the regulation of monocytes during ECM.
( A ) CD8 + T cells or CD8 u2212 splenocyte fraction (Sp) isolated by MACS from uninfected or PbA-infected C57BL/6 donor mice on day 7 p.i. were adoptively transferred into PbA-infected MacGreenu00d7R...
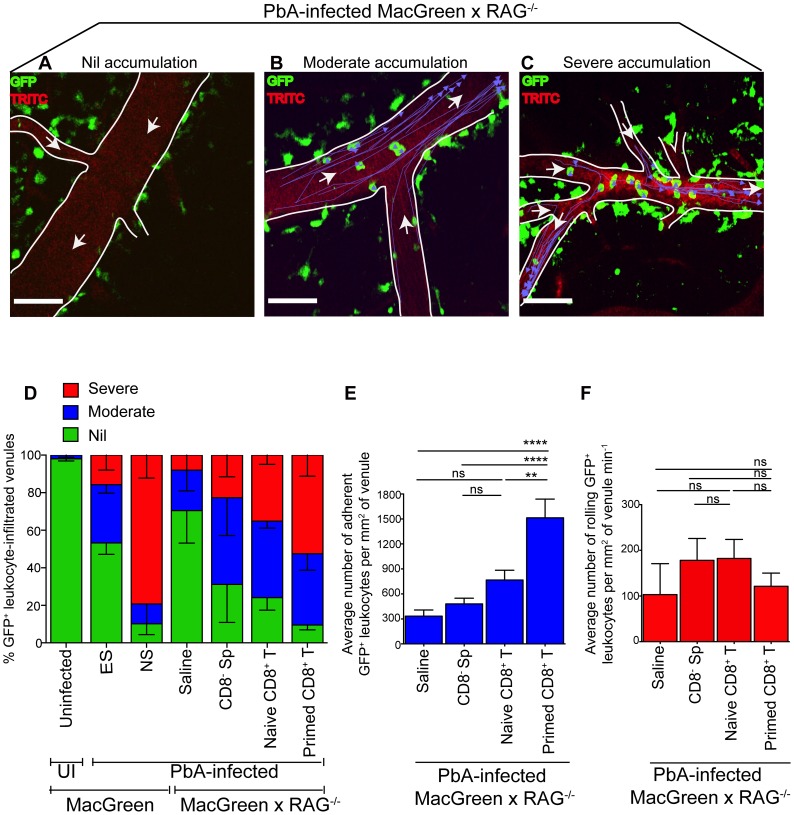
Figure 5
Plasmodium -primed CD8 + T cells induce monocyte accumulation in MacGreenu00d7RAG u2212/u2212 mice.
PbA-infected MacGreenu00d7RAG u2212/u2212 mice that had received saline, CD8 u2212 splenocytes, nau00efve or primed CD8 + T cells as in Fig. 4A underwent intravital imaging on day 7 p.i. (nu200a=u200a...
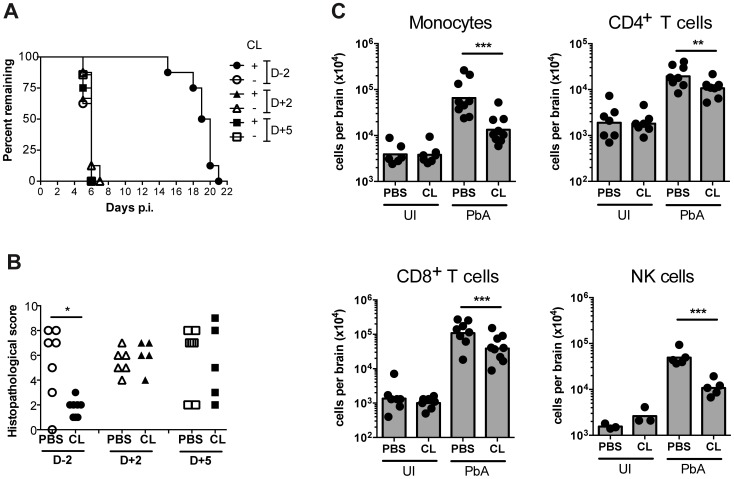
Figure 6
Effect of monocyte depletion on the development of ECM.
( A ) Mice were infected with PbA and administered with CL or sham-treated (PBS) i.v., at the indicated times. Survival time to a predetermined clinical endpoint is shown. ( B ) Histopathological scor...
Figure images are served from the NIH/NLM PubMed Central Open Access Subset or Europe PMC; copyright remains with the publishers and authors.
💬 Discussion
0 commentsNo comments yet. Be the first to start a discussion!
Leave a Comment