Abstract
The nuclear pore complex (NPC) is the sole mediator of nucleocytoplasmic transport. Despite great advances in understanding its conserved core architecture, the peripheral regions can exhibit considerable variation within and between species. One such structure is the cage-like nuclear basket. Despite its crucial roles in mRNA surveillance and chromatin organization, an architectural understanding has remained elusive. Using in-cell cryo-electron tomography and subtomogram analysis, we explored the NPC's structural variations and the nuclear basket across fungi (yeast; S. cerevisiae), mammals (mouse; M. musculus), and protozoa (T. gondii). Using integrative structural modeling, we computed a model of the basket in yeast and mammals that revealed how a hub of nucleoporins (Nups) in the nuclear ring binds to basket-forming Mlp/Tpr proteins: the coiled-coil domains of Mlp/Tpr form the struts of the basket, while their unstructured termini constitute the basket distal densities, which potentially serve as a docking site for mRNA preprocessing before nucleocytoplasmic transport.
🔬 Techniques
🧬 Organisms
✨ Fluorophores
🧪 Sample Preparation
🔬 Cell Lines
🏭 Microscope Brands
🧪 Reagent Suppliers
💻 Software Details
💻 Code & Software
💾 Data Repositories
🏛️ Research Organizations (ROR)
Affiliated research institutions:
📋 Methods
RESOURCE AVAILABILITY
Lead contact Further information and requests for resources and reagents should be directed to and will be fulfilled by the lead contact, Elizabeth Villa ( evilla@ucsd.edu ).
Materials availability
Strains used in this study will be distributed without restriction upon request.
Data and code availability
Cryo-ET maps have been deposited in the EMDB with the following accession codes: Yeast NPC (EMD-44377, EMD-44372, EMD-45255, EMD-45197, EMD-45198, EMD-45256, EMD-45199, EMD-45200, EMD-45201, EMD-45202, EMD-45203, EMD-45204, EMD-45205), Mammalian NPC (EMD-44379, EMD-45257, EMD-45216, EMD-45258, EMD-45219, EMD-45220, EMD-45222, EMD-45223, EMD-45227), Protozoan NPC (EMD-44381, EMD-45259, EMD-45228, EMD-45260, EMD-45229, EMD-45230, EMD-45231, EMD-45232, EMD-45233). Integrative models have been deposited in the PDB-Dev with the following codes: Collection of all models (PDBDEV: PDBDEV_G_1000004), Yeast NPC (PDBDEV: PDBDEV_00000386, PDBDEV: PDBDEV_00000387), and Mammalian NPC (PDBDEV: PDBDEV_00000384, PDBDEV: PDBDEV_00000385). Cross-linking data have been deposited at Zenodo with the 10892434 accession code ( https://zenodo.org/ ). Software scripts and data for integrative modeling are available at: https://github.com/integrativemodeling/NPC_Basket and archived at Zenodo with accession code 12561838. Any additional information required to reanalyze the data reported in this paper can be requested from the lead contact , Elizabeth Villa ( evilla@ucsd.edu ).
EXPERIMENTAL MODEL AND STUDY PARTICIPANT DETAILS
Many cell lines and yeast strains used in this study are standard cell lines and strains, which are readily available via multiple sources. These strains/cell lines plus more specialized ones used in the study will also be distributed without restriction upon request to the lead contact , Elizabeth Villa ( evilla@ucsd.edu ). METHOD DETAILS Cell culture, vitrification and sample preparation W303 yeast cells were cultured in yeast extract peptone dextrose (YPD) media supplemented with adenine hemisulfate. These cells in the log-growth phase were collected and deposited on glow-discharged Quantifoil grids (R 2/1, Cu 200-mesh grid, Electron Microscopy Sciences), as described previously. 5 The mouse fibroblasts cells (NIH3T3) were cultured at 37°C and 5% CO2 in Dulbecco’s Modified Eagle Medium (DMEM) with 10% fetal calf serum. Cells were seeded onto glow-discharged and Fibronectin-coated Quantifoil grids (R1/4, Au 200-mesh grid, Electron Microscopy Sciences). Following this seeding, the cells were cultured for 2 more hours on the grids to allow for their stable adherence onto the grid. In some cases, grids were micropatterned with 40 μm circles and treated with 100 nM jasplakinolide for a further two hours after seeding. The tachyzoites ( T. gondii in rapid growth phase) were thawed out from liquid nitrogen and cultivated in human foreskin fibroblasts (HFFs) using Dulbecco’s modified Eagle’s medium (DMEM), with medium changes every 12 to 24 hours. To collect tachyzoites, trypsin-treated, parasite-infected HFFs were mechanically disrupted using a 27-gauge syringe, and the mixture was filtered to separate tachyzoites from HFF debris. The tachyzoites were then centrifuged, resuspended in DMEM with 30% fetal bovine serum (FBS) and 10% DMSO, and deposited on EM grids for vitrification, as described previously. 107 Excess media was manually blotted from the back (opposite to the carbon film and seeded cells). Grids were plunge-frozen in a liquid ethane-propane mixture (50/50 volume, Airgas) using a custom-built vitrification device (Max Planck Institute for Biochemistry, Munich). Frozen grids were clipped into AutoGrids with a milling slot (Thermo Fisher Scientific) to allow milling at shallow grazing angles as described previously. 32 , 108 Cryo-FIB milling was performed in an Aquilos Dual-Beam (Thermo Fisher Scientific) as described previously. 32 , 108 Tilt series acquisition Tilt series were acquired on the Titan Krios G3 (Thermo Fisher Scientific) at 300 keV with either a K2 detector and Quantum 968 LS post-column energy filter or a K3 Summit detector with 1067HD BioContinuum post-column energy filter in counting and dose fractionation modes (Gatan). The tilt-series parameters were as follows: tilt range: ± 45–60°, pixel size of 3.45 Å (yeast), 1.32 Å (mouse fibroblasts), 3.328 Å ( T. gondii ), tilt increment: 3° (higher for some samples), effective defocus range: −2 to −11 μm, total fluence: ~100–180 e-/Å 2. All image acquisition was done using SerialEM software. 93 , 109 For some tilt-series, parallel cryo-electron tomography (PACE-tomo) scripts were used. 94 In total, 1449, 136, and 19 (total: 1604) tilt series were used for yeast, mouse, and T. gondii , respectively. This data set included 153 tilt-series of yeast from EMPIAR-10466. 8 Subtomogram analysis Frames of the tilt images were motion-corrected using whole-frame motion and organized into stacks in WARP. 95 , 110 The motion-corrected tilt series were then aligned in AreTomo. 102 The aligned tilt-series stacks were subsequently re-imported into WARP for CTF estimation, defocus handedness determination, and final reconstruction. 95 , 110 The CTF estimation and defocus handedness were manually inspected and further refined as needed. In tomograms, nuclear pores were manually picked in IMOD. 101 For each pore, in addition to the coordinate of the pore’s center, an additional point approximately 50–100 nm on the cytoplasmic side was marked. The pores were oriented using these two points with the Dynamo dipole picking mode. 104 The subtomograms of the pores, with these initial orientations, were generated in WARP at a pixel size of 10 Å. The total number of pores picked were ~5160 for yeast, ~220 for mouse, and ~50 for T. gondii , respectively. A small number of pore particles were used to generate a C8 symmetrized initial model in Relion. 96 This initial model served as a reference for refining all the pore particles with C8 symmetry. The refinements were performed with local searches around the initial orientation (initial Euler angles), using the sigma_ang/rot/tilt/psi parameters to restrict the angular searches and prevent the pore particles from flipping. The term sigma_ang/rot/tilt/psi in Relion specifies the width of the Gaussian prior on the starting Euler angles. 3D classification (without alignments, simply referred to as classification), using C8 symmetry, was performed using a mask focused on the inner ring of the NPC to select good particles and discard bad ones. The selected NPC particles were refined further with C8 symmetry. For yeast, classification was performed using a mask focused on the nuclear ring to classify out NPCs with single and double NR, which accounted for ~77% and the remaining ~23% of total NPCs, respectively. The symmetry expansion was carried out to isolate subunits of the NPCs. These subtomograms of the subunits were then reconstructed at a pixel size of 10 Å in WARP. The relion_reconstruct was used to generate an average of these subtomograms for use as reference in the refinement of these subunits using a mask focused on the IR subunit. Following refinement, classification was performed, using the mask focused on the IR subunit, to select good subunits and discard bad ones. The refinements of the good subunits of IR, CR, NR, and the basket (as applicable) were then performed using their respective shape masks. All the refinements and classification of subunits were done without the use of symmetry except for the map shown in Figures 2A and S3C . The total number of subunits used in the final refinements were ~28600 for yeast (out of which, ~6600 were from the NPC with double NR), ~800 for mouse, and ~265 for T. gondii , respectively. The maps shown in Figures 2A and S3C , were determined by the averaging of the whole NPC particle (containing multiple subunits) using the C8-symmetrization. For this averaging, a soft-mask covering the relevant portion of the NPC in the particle, was used for alignment and averaging. This mask did not include the surrounding densities shown in the maps in Figures 2A and S3C . After the iterative alignment and averaging, a new-reconstruction, at a much bigger box size to encompass a large area containing surrounding densities was reconstructed using relion_reconstruct and C8 symmetrized. The 0.143-cut-off criterion of the Fourier Shell correlations (FSC) between masked and independently refined half-maps was used to estimate all the reported resolutions. 111 The maps of the subunits of these different rings were composited to generate the final map of the entire subunit of the NPC. This composite map was fit into the map of the whole NPC (of C8 symmetry) using Chimera’s fit-to-map tool, and then C8 symmetrized using relion_image_handler . The entire processing of the data from separate organisms was done completely separately and independently. The schematic of the entire workflow and resolution estimates is also shown in Figure S1 . v3.1.1 of Relion was used for all steps involving Relion. 96 v1.09 or v1.1.0-beta1 of WARP was used for all steps involving WARP. 95 , 110 Pairwise distances amongst yNPCs and their radial distribution function [g(r)] The coordinates of yNPCs with single or double NR in their tomograms were obtained following their subtomogram analysis. For each tomogram, pairwise distances among all yNPCs, as well as those with single and double NR, were calculated using these coordinates. These distances were then used to estimate the g(r) for each tomogram. The g(r) values from all the tomograms were averaged to generate the final g(r) shown in Figure S2B . It should be noted that these pairwise distances and their corresponding g(r) values are averages for all yNPCs and might not apply to small subsets of yNPCs. For instance, yNPCs near the nucleolus are likely to be less enriched in double NRs (with a stable basket). This observation comes from fluorescence imaging, which has shown that yNPCs near the nucleolus lack yMlps (one of the basket-Nups) and have a low level of NR-Nups, indicating a preference for single NR without the basket. 5 , 23 , 39 , 89 Chemical cross-linking and MS (CX-MS) analysis of affinity-purified yeast NPCs CX-MS of Mlp1-PPX-PrA tagged, affinity purified, native, whole NPCs have been described in detail in Akey et al. 5 and Kim et al. 6 To expand and complement these datasets with cross-links mapping exclusively to basket Nups fully assembled into the NPC, we used NPCs affinity purified using Dbp5-PPX-GFP and Gle1-PPX-PrA as the handles using a similar protocol, with the following modifications: After native elution, 1.0 mM disuccinimidyl suberate (DSS) was added and the sample was incubated at 25°C for 40 minutes with shaking (1,200 rpm). The reaction was quenched by adding a final concentration of 50mM freshly prepared ammonium bicarbonate and incubating for 20 minutes with shaking (1,200 rpm) at 25°C. Crosslinked NPCs were pelleted by spinning for 20 minutes in a TLA-55 rotor (Beckman) at 25,000 rpm. The pelleted samples (~50 mg) were resuspended in 1xLDS with 25 mM DTT and incubated at 70°C for 10 minutes. Reduced samples were alkylated by adding a final concentration of 100 mM iodoacetamide and incubating in the dark at 25°C for 30 minutes, followed by addition of an additional 25 mM DTT and further incubation for 15 minutes. Alkylated and reduced samples were denatured at 98°C for 10 minutes and then loaded into 4% SDS-PAGE Bis-Tris gel and run for 10 minutes at a constant 120 V to reduce the complexity of the sample. For in-gel digestion, the high-molecular-weight-region gel bands corresponding to cross-linked NPC proteins were sliced and proteolyzed by trypsin as previously described. 6 In brief, gel plugs were crushed into small pieces and 5–10μg of sequencing-grade trypsin (Promega) per ~100 μg protein were added. Trypsin was supplied in two equal additions and incubated with gel pieces at 37°C in 50 mM ammonium bicarbonate, 0.1% (w/v) Rapigest (Waters). After the first addition, the samples were incubated for 4 hours. After the second addition, the samples were incubated overnight. Peptides were extracted by formic acid and acetonitrile, and dried partially by vacuum centrifugation. To remove the hydrolytic insoluble by-products of Rapigest, the sample was centrifuged at 20,000g for 10 min. The solution was transferred to another tube and then further dried by vacuum centrifugation. Peptides were separated into 6–7 fractions by high pH reverse phase fractionation in a pipet tip self-packed with C18 resin (ReproSil-Pur 120 AQ, 3μm, Dr. Maisch GmbH). Each peptide fraction was resuspended in 5% (v/v) methanol, 0.2% (v/v) formic acid and loaded onto an EASY-Spray column (Thermo Fisher Scientific, ES800, 15cm × 75mm ID, PepMap C18, 3mm) via an EASY-nLC 1200 (Thermo Fisher Scientific). The column temperature was set to 35°C. Using a flow rate of 300 nl/min, peptides were gradient-eluted (3–6% B, 0–6 min; 6–34% B, 6–97 min), where mobile phase B was 0.1% (v/v) formic acid, 95% (v/v) acetonitrile and mobile phase A was 0.1% (v/v) formic acid in water. An Orbitrap Fusion Lumos Tribrid (Thermo Fisher Scientific) was used to perform online mass spectrometric analyses. Full MS scans were performed at least every 5 s. As time between full scans allowed, ions with charge states +4 to +8 were fragmented by higher-energy collisional dissociation in descending intensity order with a maximum injection time of 800 msec. Both precursors and fragments were detected in the Orbitrap. The raw data were searched with pLink 105 and pLink2 106 with cysteine carbamidomethyl as a fixed modification and methionine oxidation as a variable modification. The initial search results were obtained using a default 5% false discovery rate (FDR) expected by the target-decoy search strategy. Spectra corresponding to basket components were selected and manually verified to ensure data quality. 6 Integrative modeling of the basket Coarse-grained structural models of the yeast and mouse baskets were computed using an integrative modeling approach, 6 , 48 – 52 based on information from varied experiments, physical principles, statistical preferences, and prior models ( Table S1 ). The yBasket model includes the yMlp1/2, FG Nups (yNup1, yNup2, and yNup60), as well as the double NR Nups (yNup120, yNup85, yNup145c, ySec13, ySeh1, yNup84, and yNup133). 4 , 24 – 26 The mBasket model includes the orthologs of yeast Nups (mTpr, mNup50, mNup153, mNup160, mNup85, mNup96, mSec13, mSeh1, mNup107, mNup133, mNup43, and mNup37). 12 , 13 Modeling positioned the yMlp/mTpr and FG Nups relative to the fixed double nuclear ring; in addition, it optimized the conformations of the disordered Nup regions. The modeling protocol was scripted using the Python Modeling Interface (PMI) package version a41075a, which is a library for modeling macromolecular complex structures based on our open-source Integrative Modeling Platform (IMP) package version 2.19 ( https://integrativemodeling.org ). 50 Stage 1: Gathering information The sequences of the basket Nups were obtained from the Uniprot database 112 ( Tables S1 and S2 ). Their stoichiometry in the yNPC was previously determined by quantitative mass spectrometry of the isolated yNPC complex 6 ( Table S2 ). In total, 626 unique intra- and intermolecular DSS cross-links were previously identified using mass spectrometry. 6 , 24 , 113 The cryo-ET map described here informed the overall shape of the basket and its anchoring on the double nuclear ring. The structural model of the yNup84 complex of the double NR was previously determined by an integrative approach. 5 The structural model of the yMlps was informed by the coiled-coil propensities and heptad repeat alignments and was generated using COCONUT software 91 ( Figures 3 , stage 2, S4A , and S4B ; Table S1 ). The yNup2 structural model was obtained from the AlphagFold database version 4 ( Table S2 ). Direct physical interactions between yNup60, yNup2, and yMlp1 were determined by in vitro binding assays 53 ( Table S1 ). Previously determined immuno-electron microscopy images help localize the terminal domains of the yMlps. 24 Similar information was used for mBasket modeling 12 , 114 ( Figures 3 and S4 ; Tables S1 and S3 ). Stage 2: Basket representation and spatial restraints Basket representation. We modeled only a single subunit out of the eight subunits comprising the entire yBasket, mostly without explicitly considering the interfaces between the eight symmetry units in the yNPC. This simplification was possible because the explored positions and conformations of the basket components do not clash with each other across the symmetry unit interfaces, courtesy of their anchoring on the fixed double NR. The stoichiometries of yMlp1 and yMlp2 are ambiguous. 6 Thus, we used two copies of poly-alanine per symmetry unit (yMlp), representing both yMlp1 and yMlp2; the yMlp length was set to that of yMlp1. The model also included a single copy of yNup1 and two copies of yNup2, yNup60, and the heptameric yNup84 complex. FG repeats were not included in the model. In total, the yBasket model consists of 21 protein subunits of 12 types ( Table S2 ). A similar representation was used for mBasket modeling with two copies of mTpr, two copies of mNup50, mNup153, and the nonameric mNup107 complex ( Tables S1 and S3 ). 36 , 115 , 116 Thus, the mBasket model consists of 24 protein subunits of 12 types ( Table S3 ). Each component was represented in a multiscale fashion to balance the accuracy of the formulation of restraints and the efficiency of structural sampling ( Figure S4C ; Tables S2 and S3 ). Spatial restraints on yeast and mouse baskets. The subset of input information was converted to spatial restraints for scoring alternative models. 50 These restraints include upper bounds on pairs of crosslinked residues based on chemical crosslinks, the correlation coefficient between Gaussian Mixture Models of a model and the cryo-ET map, positional restraints on NTD/CTD domains of yMlps based on immuno-EM localizations, distance restraints between pairs of domains based on affinity co-purification data, positional restraints on residue segments predicted to lie within the nuclear envelope, connectivity restraints between consecutive pairs of beads in a subunit, excluded volume restraints between non-bonded pairs of beads ( Table S2 ). 50 For the mBasket ( Table S3 ), crosslinking and affinity copurification data were unavailable. However, we supplemented the remaining mBasket restraints with structural equivalence restraints; these distance restraints are designed to maximize the similarity between the mouse and yeast models across the aligned residues, subject to the satisfaction of the remaining restraints. Stage 3: Structural sampling The initial positions and orientations of rigid bodies and flexible beads were randomized except for the double NR rigid body ( Table S2 ), whose position was obtained by fitting into the cryo-ET map, ensuring accurate alignment with experimental cryo-ET maps ( Figure 3 Stage 3; Table S2 ). Structural sampling of rigid body positions and orientations as well as flexible bead positions, was performed using the Replica Exchange Gibbs Monte Carlo (MC) algorithm ( Table S2 ). 117 , 118 Each MC step consisted of a series of random transformations (i.e., rotations and translations) applied to the rigid bodies and flexible beads. The same sampling protocol was used for mBasket modeling, except that the starting structure mimicked the yBasket model ( Table S3 ). Thus, by construction, any potential differences between the yeast and mouse basket models are a direct consequence of the differences on the cryo-ET maps and other input information. Stage 4: Analysis and validation Model validation followed four steps 52 , 119 : (i) selection of the models for validation, (ii) estimation of sampling precision ( Figure S5A ), (iii) estimation of model precision, and (iv) quantification of the degree to which a model satisfies the information used and not used to compute it ( Tables S2 and S3 ; Figures S5 and S6 ). 52 , 120 Integrative modeling iterated through the four stages to find a set of models that satisfy our validation criteria listed above. In each iteration, we considered the input information, representation, scoring, and sampling guided by an analysis of models computed in the preceding iteration of the modeling. For example, the initial low precision of the yBasket model encouraged us to improve the resolution of the cryo-ET map by averaging a larger number of subtomograms; and the initial inability to find yBasket models that satisfied both cryo-ET and crosslinking data encouraged us to increase the resolution and flexibility of the coiled-coil representations, re-defining the coiled-coil segments, 97 disorder predictions for FG Nups, 112 and adding proximity restraints to some components. Figures All figures depicting cryo-ET maps and models were generated using Chimera/ChimeraX 99 , 100 and its RMSF plugin ( https://github.com/salilab/rmf_chimerax ).
Show full methods section
RESOURCE AVAILABILITY
Lead contact Further information and requests for resources and reagents should be directed to and will be fulfilled by the lead contact, Elizabeth Villa ( evilla@ucsd.edu ).
Materials availability
Strains used in this study will be distributed without restriction upon request.
Data and code availability
Cryo-ET maps have been deposited in the EMDB with the following accession codes: Yeast NPC (EMD-44377, EMD-44372, EMD-45255, EMD-45197, EMD-45198, EMD-45256, EMD-45199, EMD-45200, EMD-45201, EMD-45202, EMD-45203, EMD-45204, EMD-45205), Mammalian NPC (EMD-44379, EMD-45257, EMD-45216, EMD-45258, EMD-45219, EMD-45220, EMD-45222, EMD-45223, EMD-45227), Protozoan NPC (EMD-44381, EMD-45259, EMD-45228, EMD-45260, EMD-45229, EMD-45230, EMD-45231, EMD-45232, EMD-45233). Integrative models have been deposited in the PDB-Dev with the following codes: Collection of all models (PDBDEV: PDBDEV_G_1000004), Yeast NPC (PDBDEV: PDBDEV_00000386, PDBDEV: PDBDEV_00000387), and Mammalian NPC (PDBDEV: PDBDEV_00000384, PDBDEV: PDBDEV_00000385). Cross-linking data have been deposited at Zenodo with the 10892434 accession code ( https://zenodo.org/ ). Software scripts and data for integrative modeling are available at: https://github.com/integrativemodeling/NPC_Basket and archived at Zenodo with accession code 12561838. Any additional information required to reanalyze the data reported in this paper can be requested from the lead contact , Elizabeth Villa ( evilla@ucsd.edu ).
EXPERIMENTAL MODEL AND STUDY PARTICIPANT DETAILS
Many cell lines and yeast strains used in this study are standard cell lines and strains, which are readily available via multiple sources. These strains/cell lines plus more specialized ones used in the study will also be distributed without restriction upon request to the lead contact , Elizabeth Villa ( evilla@ucsd.edu ). METHOD DETAILS Cell culture, vitrification and sample preparation W303 yeast cells were cultured in yeast extract peptone dextrose (YPD) media supplemented with adenine hemisulfate. These cells in the log-growth phase were collected and deposited on glow-discharged Quantifoil grids (R 2/1, Cu 200-mesh grid, Electron Microscopy Sciences), as described previously. 5 The mouse fibroblasts cells (NIH3T3) were cultured at 37°C and 5% CO2 in Dulbecco’s Modified Eagle Medium (DMEM) with 10% fetal calf serum. Cells were seeded onto glow-discharged and Fibronectin-coated Quantifoil grids (R1/4, Au 200-mesh grid, Electron Microscopy Sciences). Following this seeding, the cells were cultured for 2 more hours on the grids to allow for their stable adherence onto the grid. In some cases, grids were micropatterned with 40 μm circles and treated with 100 nM jasplakinolide for a further two hours after seeding. The tachyzoites ( T. gondii in rapid growth phase) were thawed out from liquid nitrogen and cultivated in human foreskin fibroblasts (HFFs) using Dulbecco’s modified Eagle’s medium (DMEM), with medium changes every 12 to 24 hours. To collect tachyzoites, trypsin-treated, parasite-infected HFFs were mechanically disrupted using a 27-gauge syringe, and the mixture was filtered to separate tachyzoites from HFF debris. The tachyzoites were then centrifuged, resuspended in DMEM with 30% fetal bovine serum (FBS) and 10% DMSO, and deposited on EM grids for vitrification, as described previously. 107 Excess media was manually blotted from the back (opposite to the carbon film and seeded cells). Grids were plunge-frozen in a liquid ethane-propane mixture (50/50 volume, Airgas) using a custom-built vitrification device (Max Planck Institute for Biochemistry, Munich). Frozen grids were clipped into AutoGrids with a milling slot (Thermo Fisher Scientific) to allow milling at shallow grazing angles as described previously. 32 , 108 Cryo-FIB milling was performed in an Aquilos Dual-Beam (Thermo Fisher Scientific) as described previously. 32 , 108 Tilt series acquisition Tilt series were acquired on the Titan Krios G3 (Thermo Fisher Scientific) at 300 keV with either a K2 detector and Quantum 968 LS post-column energy filter or a K3 Summit detector with 1067HD BioContinuum post-column energy filter in counting and dose fractionation modes (Gatan). The tilt-series parameters were as follows: tilt range: ± 45–60°, pixel size of 3.45 Å (yeast), 1.32 Å (mouse fibroblasts), 3.328 Å ( T. gondii ), tilt increment: 3° (higher for some samples), effective defocus range: −2 to −11 μm, total fluence: ~100–180 e-/Å 2. All image acquisition was done using SerialEM software. 93 , 109 For some tilt-series, parallel cryo-electron tomography (PACE-tomo) scripts were used. 94 In total, 1449, 136, and 19 (total: 1604) tilt series were used for yeast, mouse, and T. gondii , respectively. This data set included 153 tilt-series of yeast from EMPIAR-10466. 8 Subtomogram analysis Frames of the tilt images were motion-corrected using whole-frame motion and organized into stacks in WARP. 95 , 110 The motion-corrected tilt series were then aligned in AreTomo. 102 The aligned tilt-series stacks were subsequently re-imported into WARP for CTF estimation, defocus handedness determination, and final reconstruction. 95 , 110 The CTF estimation and defocus handedness were manually inspected and further refined as needed. In tomograms, nuclear pores were manually picked in IMOD. 101 For each pore, in addition to the coordinate of the pore’s center, an additional point approximately 50–100 nm on the cytoplasmic side was marked. The pores were oriented using these two points with the Dynamo dipole picking mode. 104 The subtomograms of the pores, with these initial orientations, were generated in WARP at a pixel size of 10 Å. The total number of pores picked were ~5160 for yeast, ~220 for mouse, and ~50 for T. gondii , respectively. A small number of pore particles were used to generate a C8 symmetrized initial model in Relion. 96 This initial model served as a reference for refining all the pore particles with C8 symmetry. The refinements were performed with local searches around the initial orientation (initial Euler angles), using the sigma_ang/rot/tilt/psi parameters to restrict the angular searches and prevent the pore particles from flipping. The term sigma_ang/rot/tilt/psi in Relion specifies the width of the Gaussian prior on the starting Euler angles. 3D classification (without alignments, simply referred to as classification), using C8 symmetry, was performed using a mask focused on the inner ring of the NPC to select good particles and discard bad ones. The selected NPC particles were refined further with C8 symmetry. For yeast, classification was performed using a mask focused on the nuclear ring to classify out NPCs with single and double NR, which accounted for ~77% and the remaining ~23% of total NPCs, respectively. The symmetry expansion was carried out to isolate subunits of the NPCs. These subtomograms of the subunits were then reconstructed at a pixel size of 10 Å in WARP. The relion_reconstruct was used to generate an average of these subtomograms for use as reference in the refinement of these subunits using a mask focused on the IR subunit. Following refinement, classification was performed, using the mask focused on the IR subunit, to select good subunits and discard bad ones. The refinements of the good subunits of IR, CR, NR, and the basket (as applicable) were then performed using their respective shape masks. All the refinements and classification of subunits were done without the use of symmetry except for the map shown in Figures 2A and S3C . The total number of subunits used in the final refinements were ~28600 for yeast (out of which, ~6600 were from the NPC with double NR), ~800 for mouse, and ~265 for T. gondii , respectively. The maps shown in Figures 2A and S3C , were determined by the averaging of the whole NPC particle (containing multiple subunits) using the C8-symmetrization. For this averaging, a soft-mask covering the relevant portion of the NPC in the particle, was used for alignment and averaging. This mask did not include the surrounding densities shown in the maps in Figures 2A and S3C . After the iterative alignment and averaging, a new-reconstruction, at a much bigger box size to encompass a large area containing surrounding densities was reconstructed using relion_reconstruct and C8 symmetrized. The 0.143-cut-off criterion of the Fourier Shell correlations (FSC) between masked and independently refined half-maps was used to estimate all the reported resolutions. 111 The maps of the subunits of these different rings were composited to generate the final map of the entire subunit of the NPC. This composite map was fit into the map of the whole NPC (of C8 symmetry) using Chimera’s fit-to-map tool, and then C8 symmetrized using relion_image_handler . The entire processing of the data from separate organisms was done completely separately and independently. The schematic of the entire workflow and resolution estimates is also shown in Figure S1 . v3.1.1 of Relion was used for all steps involving Relion. 96 v1.09 or v1.1.0-beta1 of WARP was used for all steps involving WARP. 95 , 110 Pairwise distances amongst yNPCs and their radial distribution function [g(r)] The coordinates of yNPCs with single or double NR in their tomograms were obtained following their subtomogram analysis. For each tomogram, pairwise distances among all yNPCs, as well as those with single and double NR, were calculated using these coordinates. These distances were then used to estimate the g(r) for each tomogram. The g(r) values from all the tomograms were averaged to generate the final g(r) shown in Figure S2B . It should be noted that these pairwise distances and their corresponding g(r) values are averages for all yNPCs and might not apply to small subsets of yNPCs. For instance, yNPCs near the nucleolus are likely to be less enriched in double NRs (with a stable basket). This observation comes from fluorescence imaging, which has shown that yNPCs near the nucleolus lack yMlps (one of the basket-Nups) and have a low level of NR-Nups, indicating a preference for single NR without the basket. 5 , 23 , 39 , 89 Chemical cross-linking and MS (CX-MS) analysis of affinity-purified yeast NPCs CX-MS of Mlp1-PPX-PrA tagged, affinity purified, native, whole NPCs have been described in detail in Akey et al. 5 and Kim et al. 6 To expand and complement these datasets with cross-links mapping exclusively to basket Nups fully assembled into the NPC, we used NPCs affinity purified using Dbp5-PPX-GFP and Gle1-PPX-PrA as the handles using a similar protocol, with the following modifications: After native elution, 1.0 mM disuccinimidyl suberate (DSS) was added and the sample was incubated at 25°C for 40 minutes with shaking (1,200 rpm). The reaction was quenched by adding a final concentration of 50mM freshly prepared ammonium bicarbonate and incubating for 20 minutes with shaking (1,200 rpm) at 25°C. Crosslinked NPCs were pelleted by spinning for 20 minutes in a TLA-55 rotor (Beckman) at 25,000 rpm. The pelleted samples (~50 mg) were resuspended in 1xLDS with 25 mM DTT and incubated at 70°C for 10 minutes. Reduced samples were alkylated by adding a final concentration of 100 mM iodoacetamide and incubating in the dark at 25°C for 30 minutes, followed by addition of an additional 25 mM DTT and further incubation for 15 minutes. Alkylated and reduced samples were denatured at 98°C for 10 minutes and then loaded into 4% SDS-PAGE Bis-Tris gel and run for 10 minutes at a constant 120 V to reduce the complexity of the sample. For in-gel digestion, the high-molecular-weight-region gel bands corresponding to cross-linked NPC proteins were sliced and proteolyzed by trypsin as previously described. 6 In brief, gel plugs were crushed into small pieces and 5–10μg of sequencing-grade trypsin (Promega) per ~100 μg protein were added. Trypsin was supplied in two equal additions and incubated with gel pieces at 37°C in 50 mM ammonium bicarbonate, 0.1% (w/v) Rapigest (Waters). After the first addition, the samples were incubated for 4 hours. After the second addition, the samples were incubated overnight. Peptides were extracted by formic acid and acetonitrile, and dried partially by vacuum centrifugation. To remove the hydrolytic insoluble by-products of Rapigest, the sample was centrifuged at 20,000g for 10 min. The solution was transferred to another tube and then further dried by vacuum centrifugation. Peptides were separated into 6–7 fractions by high pH reverse phase fractionation in a pipet tip self-packed with C18 resin (ReproSil-Pur 120 AQ, 3μm, Dr. Maisch GmbH). Each peptide fraction was resuspended in 5% (v/v) methanol, 0.2% (v/v) formic acid and loaded onto an EASY-Spray column (Thermo Fisher Scientific, ES800, 15cm × 75mm ID, PepMap C18, 3mm) via an EASY-nLC 1200 (Thermo Fisher Scientific). The column temperature was set to 35°C. Using a flow rate of 300 nl/min, peptides were gradient-eluted (3–6% B, 0–6 min; 6–34% B, 6–97 min), where mobile phase B was 0.1% (v/v) formic acid, 95% (v/v) acetonitrile and mobile phase A was 0.1% (v/v) formic acid in water. An Orbitrap Fusion Lumos Tribrid (Thermo Fisher Scientific) was used to perform online mass spectrometric analyses. Full MS scans were performed at least every 5 s. As time between full scans allowed, ions with charge states +4 to +8 were fragmented by higher-energy collisional dissociation in descending intensity order with a maximum injection time of 800 msec. Both precursors and fragments were detected in the Orbitrap. The raw data were searched with pLink 105 and pLink2 106 with cysteine carbamidomethyl as a fixed modification and methionine oxidation as a variable modification. The initial search results were obtained using a default 5% false discovery rate (FDR) expected by the target-decoy search strategy. Spectra corresponding to basket components were selected and manually verified to ensure data quality. 6 Integrative modeling of the basket Coarse-grained structural models of the yeast and mouse baskets were computed using an integrative modeling approach, 6 , 48 – 52 based on information from varied experiments, physical principles, statistical preferences, and prior models ( Table S1 ). The yBasket model includes the yMlp1/2, FG Nups (yNup1, yNup2, and yNup60), as well as the double NR Nups (yNup120, yNup85, yNup145c, ySec13, ySeh1, yNup84, and yNup133). 4 , 24 – 26 The mBasket model includes the orthologs of yeast Nups (mTpr, mNup50, mNup153, mNup160, mNup85, mNup96, mSec13, mSeh1, mNup107, mNup133, mNup43, and mNup37). 12 , 13 Modeling positioned the yMlp/mTpr and FG Nups relative to the fixed double nuclear ring; in addition, it optimized the conformations of the disordered Nup regions. The modeling protocol was scripted using the Python Modeling Interface (PMI) package version a41075a, which is a library for modeling macromolecular complex structures based on our open-source Integrative Modeling Platform (IMP) package version 2.19 ( https://integrativemodeling.org ). 50 Stage 1: Gathering information The sequences of the basket Nups were obtained from the Uniprot database 112 ( Tables S1 and S2 ). Their stoichiometry in the yNPC was previously determined by quantitative mass spectrometry of the isolated yNPC complex 6 ( Table S2 ). In total, 626 unique intra- and intermolecular DSS cross-links were previously identified using mass spectrometry. 6 , 24 , 113 The cryo-ET map described here informed the overall shape of the basket and its anchoring on the double nuclear ring. The structural model of the yNup84 complex of the double NR was previously determined by an integrative approach. 5 The structural model of the yMlps was informed by the coiled-coil propensities and heptad repeat alignments and was generated using COCONUT software 91 ( Figures 3 , stage 2, S4A , and S4B ; Table S1 ). The yNup2 structural model was obtained from the AlphagFold database version 4 ( Table S2 ). Direct physical interactions between yNup60, yNup2, and yMlp1 were determined by in vitro binding assays 53 ( Table S1 ). Previously determined immuno-electron microscopy images help localize the terminal domains of the yMlps. 24 Similar information was used for mBasket modeling 12 , 114 ( Figures 3 and S4 ; Tables S1 and S3 ). Stage 2: Basket representation and spatial restraints Basket representation. We modeled only a single subunit out of the eight subunits comprising the entire yBasket, mostly without explicitly considering the interfaces between the eight symmetry units in the yNPC. This simplification was possible because the explored positions and conformations of the basket components do not clash with each other across the symmetry unit interfaces, courtesy of their anchoring on the fixed double NR. The stoichiometries of yMlp1 and yMlp2 are ambiguous. 6 Thus, we used two copies of poly-alanine per symmetry unit (yMlp), representing both yMlp1 and yMlp2; the yMlp length was set to that of yMlp1. The model also included a single copy of yNup1 and two copies of yNup2, yNup60, and the heptameric yNup84 complex. FG repeats were not included in the model. In total, the yBasket model consists of 21 protein subunits of 12 types ( Table S2 ). A similar representation was used for mBasket modeling with two copies of mTpr, two copies of mNup50, mNup153, and the nonameric mNup107 complex ( Tables S1 and S3 ). 36 , 115 , 116 Thus, the mBasket model consists of 24 protein subunits of 12 types ( Table S3 ). Each component was represented in a multiscale fashion to balance the accuracy of the formulation of restraints and the efficiency of structural sampling ( Figure S4C ; Tables S2 and S3 ). Spatial restraints on yeast and mouse baskets. The subset of input information was converted to spatial restraints for scoring alternative models. 50 These restraints include upper bounds on pairs of crosslinked residues based on chemical crosslinks, the correlation coefficient between Gaussian Mixture Models of a model and the cryo-ET map, positional restraints on NTD/CTD domains of yMlps based on immuno-EM localizations, distance restraints between pairs of domains based on affinity co-purification data, positional restraints on residue segments predicted to lie within the nuclear envelope, connectivity restraints between consecutive pairs of beads in a subunit, excluded volume restraints between non-bonded pairs of beads ( Table S2 ). 50 For the mBasket ( Table S3 ), crosslinking and affinity copurification data were unavailable. However, we supplemented the remaining mBasket restraints with structural equivalence restraints; these distance restraints are designed to maximize the similarity between the mouse and yeast models across the aligned residues, subject to the satisfaction of the remaining restraints. Stage 3: Structural sampling The initial positions and orientations of rigid bodies and flexible beads were randomized except for the double NR rigid body ( Table S2 ), whose position was obtained by fitting into the cryo-ET map, ensuring accurate alignment with experimental cryo-ET maps ( Figure 3 Stage 3; Table S2 ). Structural sampling of rigid body positions and orientations as well as flexible bead positions, was performed using the Replica Exchange Gibbs Monte Carlo (MC) algorithm ( Table S2 ). 117 , 118 Each MC step consisted of a series of random transformations (i.e., rotations and translations) applied to the rigid bodies and flexible beads. The same sampling protocol was used for mBasket modeling, except that the starting structure mimicked the yBasket model ( Table S3 ). Thus, by construction, any potential differences between the yeast and mouse basket models are a direct consequence of the differences on the cryo-ET maps and other input information. Stage 4: Analysis and validation Model validation followed four steps 52 , 119 : (i) selection of the models for validation, (ii) estimation of sampling precision ( Figure S5A ), (iii) estimation of model precision, and (iv) quantification of the degree to which a model satisfies the information used and not used to compute it ( Tables S2 and S3 ; Figures S5 and S6 ). 52 , 120 Integrative modeling iterated through the four stages to find a set of models that satisfy our validation criteria listed above. In each iteration, we considered the input information, representation, scoring, and sampling guided by an analysis of models computed in the preceding iteration of the modeling. For example, the initial low precision of the yBasket model encouraged us to improve the resolution of the cryo-ET map by averaging a larger number of subtomograms; and the initial inability to find yBasket models that satisfied both cryo-ET and crosslinking data encouraged us to increase the resolution and flexibility of the coiled-coil representations, re-defining the coiled-coil segments, 97 disorder predictions for FG Nups, 112 and adding proximity restraints to some components. Figures All figures depicting cryo-ET maps and models were generated using Chimera/ChimeraX 99 , 100 and its RMSF plugin ( https://github.com/salilab/rmf_chimerax ).
QUANTIFICATION AND STATISTICAL ANALYSIS
Resolution of all cryo-ET maps were estimated using FSC-0.143 criterion in Relion. 96 , 111 Local resolution maps were calculated in EMAN2. 121 These details of quantification and all statistical analyses have also been described in the relevant sections of the method details .
Materials availability
Strains used in this study will be distributed without restriction upon request.
EXPERIMENTAL MODEL AND STUDY PARTICIPANT DETAILS
Many cell lines and yeast strains used in this study are standard cell lines and strains, which are readily available via multiple sources. These strains/cell lines plus more specialized ones used in the study will also be distributed without restriction upon request to the lead contact , Elizabeth Villa ( evilla@ucsd.edu ).
METHOD DETAILS Cell culture, vitrification and sample preparation W303 yeast cells were cultured in yeast extract peptone dextrose (YPD) media supplemented with adenine hemisulfate. These cells in the log-growth phase were collected and deposited on glow-discharged Quantifoil grids (R 2/1, Cu 200-mesh grid, Electron Microscopy Sciences), as described previously. 5 The mouse fibroblasts cells (NIH3T3) were cultured at 37°C and 5% CO2 in Dulbecco’s Modified Eagle Medium (DMEM) with 10% fetal calf serum. Cells were seeded onto glow-discharged and Fibronectin-coated Quantifoil grids (R1/4, Au 200-mesh grid, Electron Microscopy Sciences). Following this seeding, the cells were cultured for 2 more hours on the grids to allow for their stable adherence onto the grid. In some cases, grids were micropatterned with 40 μm circles and treated with 100 nM jasplakinolide for a further two hours after seeding. The tachyzoites ( T. gondii in rapid growth phase) were thawed out from liquid nitrogen and cultivated in human foreskin fibroblasts (HFFs) using Dulbecco’s modified Eagle’s medium (DMEM), with medium changes every 12 to 24 hours. To collect tachyzoites, trypsin-treated, parasite-infected HFFs were mechanically disrupted using a 27-gauge syringe, and the mixture was filtered to separate tachyzoites from HFF debris. The tachyzoites were then centrifuged, resuspended in DMEM with 30% fetal bovine serum (FBS) and 10% DMSO, and deposited on EM grids for vitrification, as described previously. 107 Excess media was manually blotted from the back (opposite to the carbon film and seeded cells). Grids were plunge-frozen in a liquid ethane-propane mixture (50/50 volume, Airgas) using a custom-built vitrification device (Max Planck Institute for Biochemistry, Munich). Frozen grids were clipped into AutoGrids with a milling slot (Thermo Fisher Scientific) to allow milling at shallow grazing angles as described previously. 32 , 108 Cryo-FIB milling was performed in an Aquilos Dual-Beam (Thermo Fisher Scientific) as described previously. 32 , 108 Tilt series acquisition Tilt series were acquired on the Titan Krios G3 (Thermo Fisher Scientific) at 300 keV with either a K2 detector and Quantum 968 LS post-column energy filter or a K3 Summit detector with 1067HD BioContinuum post-column energy filter in counting and dose fractionation modes (Gatan). The tilt-series parameters were as follows: tilt range: ± 45–60°, pixel size of 3.45 Å (yeast), 1.32 Å (mouse fibroblasts), 3.328 Å ( T. gondii ), tilt increment: 3° (higher for some samples), effective defocus range: −2 to −11 μm, total fluence: ~100–180 e-/Å 2. All image acquisition was done using SerialEM software. 93 , 109 For some tilt-series, parallel cryo-electron tomography (PACE-tomo) scripts were used. 94 In total, 1449, 136, and 19 (total: 1604) tilt series were used for yeast, mouse, and T. gondii , respectively. This data set included 153 tilt-series of yeast from EMPIAR-10466. 8 Subtomogram analysis Frames of the tilt images were motion-corrected using whole-frame motion and organized into stacks in WARP. 95 , 110 The motion-corrected tilt series were then aligned in AreTomo. 102 The aligned tilt-series stacks were subsequently re-imported into WARP for CTF estimation, defocus handedness determination, and final reconstruction. 95 , 110 The CTF estimation and defocus handedness were manually inspected and further refined as needed. In tomograms, nuclear pores were manually picked in IMOD. 101 For each pore, in addition to the coordinate of the pore’s center, an additional point approximately 50–100 nm on the cytoplasmic side was marked. The pores were oriented using these two points with the Dynamo dipole picking mode. 104 The subtomograms of the pores, with these initial orientations, were generated in WARP at a pixel size of 10 Å. The total number of pores picked were ~5160 for yeast, ~220 for mouse, and ~50 for T. gondii , respectively. A small number of pore particles were used to generate a C8 symmetrized initial model in Relion. 96 This initial model served as a reference for refining all the pore particles with C8 symmetry. The refinements were performed with local searches around the initial orientation (initial Euler angles), using the sigma_ang/rot/tilt/psi parameters to restrict the angular searches and prevent the pore particles from flipping. The term sigma_ang/rot/tilt/psi in Relion specifies the width of the Gaussian prior on the starting Euler angles. 3D classification (without alignments, simply referred to as classification), using C8 symmetry, was performed using a mask focused on the inner ring of the NPC to select good particles and discard bad ones. The selected NPC particles were refined further with C8 symmetry. For yeast, classification was performed using a mask focused on the nuclear ring to classify out NPCs with single and double NR, which accounted for ~77% and the remaining ~23% of total NPCs, respectively. The symmetry expansion was carried out to isolate subunits of the NPCs. These subtomograms of the subunits were then reconstructed at a pixel size of 10 Å in WARP. The relion_reconstruct was used to generate an average of these subtomograms for use as reference in the refinement of these subunits using a mask focused on the IR subunit. Following refinement, classification was performed, using the mask focused on the IR subunit, to select good subunits and discard bad ones. The refinements of the good subunits of IR, CR, NR, and the basket (as applicable) were then performed using their respective shape masks. All the refinements and classification of subunits were done without the use of symmetry except for the map shown in Figures 2A and S3C . The total number of subunits used in the final refinements were ~28600 for yeast (out of which, ~6600 were from the NPC with double NR), ~800 for mouse, and ~265 for T. gondii , respectively. The maps shown in Figures 2A and S3C , were determined by the averaging of the whole NPC particle (containing multiple subunits) using the C8-symmetrization. For this averaging, a soft-mask covering the relevant portion of the NPC in the particle, was used for alignment and averaging. This mask did not include the surrounding densities shown in the maps in Figures 2A and S3C . After the iterative alignment and averaging, a new-reconstruction, at a much bigger box size to encompass a large area containing surrounding densities was reconstructed using relion_reconstruct and C8 symmetrized. The 0.143-cut-off criterion of the Fourier Shell correlations (FSC) between masked and independently refined half-maps was used to estimate all the reported resolutions. 111 The maps of the subunits of these different rings were composited to generate the final map of the entire subunit of the NPC. This composite map was fit into the map of the whole NPC (of C8 symmetry) using Chimera’s fit-to-map tool, and then C8 symmetrized using relion_image_handler . The entire processing of the data from separate organisms was done completely separately and independently. The schematic of the entire workflow and resolution estimates is also shown in Figure S1 . v3.1.1 of Relion was used for all steps involving Relion. 96 v1.09 or v1.1.0-beta1 of WARP was used for all steps involving WARP. 95 , 110 Pairwise distances amongst yNPCs and their radial distribution function [g(r)] The coordinates of yNPCs with single or double NR in their tomograms were obtained following their subtomogram analysis. For each tomogram, pairwise distances among all yNPCs, as well as those with single and double NR, were calculated using these coordinates. These distances were then used to estimate the g(r) for each tomogram. The g(r) values from all the tomograms were averaged to generate the final g(r) shown in Figure S2B . It should be noted that these pairwise distances and their corresponding g(r) values are averages for all yNPCs and might not apply to small subsets of yNPCs. For instance, yNPCs near the nucleolus are likely to be less enriched in double NRs (with a stable basket). This observation comes from fluorescence imaging, which has shown that yNPCs near the nucleolus lack yMlps (one of the basket-Nups) and have a low level of NR-Nups, indicating a preference for single NR without the basket. 5 , 23 , 39 , 89 Chemical cross-linking and MS (CX-MS) analysis of affinity-purified yeast NPCs CX-MS of Mlp1-PPX-PrA tagged, affinity purified, native, whole NPCs have been described in detail in Akey et al. 5 and Kim et al. 6 To expand and complement these datasets with cross-links mapping exclusively to basket Nups fully assembled into the NPC, we used NPCs affinity purified using Dbp5-PPX-GFP and Gle1-PPX-PrA as the handles using a similar protocol, with the following modifications: After native elution, 1.0 mM disuccinimidyl suberate (DSS) was added and the sample was incubated at 25°C for 40 minutes with shaking (1,200 rpm). The reaction was quenched by adding a final concentration of 50mM freshly prepared ammonium bicarbonate and incubating for 20 minutes with shaking (1,200 rpm) at 25°C. Crosslinked NPCs were pelleted by spinning for 20 minutes in a TLA-55 rotor (Beckman) at 25,000 rpm. The pelleted samples (~50 mg) were resuspended in 1xLDS with 25 mM DTT and incubated at 70°C for 10 minutes. Reduced samples were alkylated by adding a final concentration of 100 mM iodoacetamide and incubating in the dark at 25°C for 30 minutes, followed by addition of an additional 25 mM DTT and further incubation for 15 minutes. Alkylated and reduced samples were denatured at 98°C for 10 minutes and then loaded into 4% SDS-PAGE Bis-Tris gel and run for 10 minutes at a constant 120 V to reduce the complexity of the sample. For in-gel digestion, the high-molecular-weight-region gel bands corresponding to cross-linked NPC proteins were sliced and proteolyzed by trypsin as previously described. 6 In brief, gel plugs were crushed into small pieces and 5–10μg of sequencing-grade trypsin (Promega) per ~100 μg protein were added. Trypsin was supplied in two equal additions and incubated with gel pieces at 37°C in 50 mM ammonium bicarbonate, 0.1% (w/v) Rapigest (Waters). After the first addition, the samples were incubated for 4 hours. After the second addition, the samples were incubated overnight. Peptides were extracted by formic acid and acetonitrile, and dried partially by vacuum centrifugation. To remove the hydrolytic insoluble by-products of Rapigest, the sample was centrifuged at 20,000g for 10 min. The solution was transferred to another tube and then further dried by vacuum centrifugation. Peptides were separated into 6–7 fractions by high pH reverse phase fractionation in a pipet tip self-packed with C18 resin (ReproSil-Pur 120 AQ, 3μm, Dr. Maisch GmbH). Each peptide fraction was resuspended in 5% (v/v) methanol, 0.2% (v/v) formic acid and loaded onto an EASY-Spray column (Thermo Fisher Scientific, ES800, 15cm × 75mm ID, PepMap C18, 3mm) via an EASY-nLC 1200 (Thermo Fisher Scientific). The column temperature was set to 35°C. Using a flow rate of 300 nl/min, peptides were gradient-eluted (3–6% B, 0–6 min; 6–34% B, 6–97 min), where mobile phase B was 0.1% (v/v) formic acid, 95% (v/v) acetonitrile and mobile phase A was 0.1% (v/v) formic acid in water. An Orbitrap Fusion Lumos Tribrid (Thermo Fisher Scientific) was used to perform online mass spectrometric analyses. Full MS scans were performed at least every 5 s. As time between full scans allowed, ions with charge states +4 to +8 were fragmented by higher-energy collisional dissociation in descending intensity order with a maximum injection time of 800 msec. Both precursors and fragments were detected in the Orbitrap. The raw data were searched with pLink 105 and pLink2 106 with cysteine carbamidomethyl as a fixed modification and methionine oxidation as a variable modification. The initial search results were obtained using a default 5% false discovery rate (FDR) expected by the target-decoy search strategy. Spectra corresponding to basket components were selected and manually verified to ensure data quality. 6 Integrative modeling of the basket Coarse-grained structural models of the yeast and mouse baskets were computed using an integrative modeling approach, 6 , 48 – 52 based on information from varied experiments, physical principles, statistical preferences, and prior models ( Table S1 ). The yBasket model includes the yMlp1/2, FG Nups (yNup1, yNup2, and yNup60), as well as the double NR Nups (yNup120, yNup85, yNup145c, ySec13, ySeh1, yNup84, and yNup133). 4 , 24 – 26 The mBasket model includes the orthologs of yeast Nups (mTpr, mNup50, mNup153, mNup160, mNup85, mNup96, mSec13, mSeh1, mNup107, mNup133, mNup43, and mNup37). 12 , 13 Modeling positioned the yMlp/mTpr and FG Nups relative to the fixed double nuclear ring; in addition, it optimized the conformations of the disordered Nup regions. The modeling protocol was scripted using the Python Modeling Interface (PMI) package version a41075a, which is a library for modeling macromolecular complex structures based on our open-source Integrative Modeling Platform (IMP) package version 2.19 ( https://integrativemodeling.org ). 50 Stage 1: Gathering information The sequences of the basket Nups were obtained from the Uniprot database 112 ( Tables S1 and S2 ). Their stoichiometry in the yNPC was previously determined by quantitative mass spectrometry of the isolated yNPC complex 6 ( Table S2 ). In total, 626 unique intra- and intermolecular DSS cross-links were previously identified using mass spectrometry. 6 , 24 , 113 The cryo-ET map described here informed the overall shape of the basket and its anchoring on the double nuclear ring. The structural model of the yNup84 complex of the double NR was previously determined by an integrative approach. 5 The structural model of the yMlps was informed by the coiled-coil propensities and heptad repeat alignments and was generated using COCONUT software 91 ( Figures 3 , stage 2, S4A , and S4B ; Table S1 ). The yNup2 structural model was obtained from the AlphagFold database version 4 ( Table S2 ). Direct physical interactions between yNup60, yNup2, and yMlp1 were determined by in vitro binding assays 53 ( Table S1 ). Previously determined immuno-electron microscopy images help localize the terminal domains of the yMlps. 24 Similar information was used for mBasket modeling 12 , 114 ( Figures 3 and S4 ; Tables S1 and S3 ). Stage 2: Basket representation and spatial restraints Basket representation. We modeled only a single subunit out of the eight subunits comprising the entire yBasket, mostly without explicitly considering the interfaces between the eight symmetry units in the yNPC. This simplification was possible because the explored positions and conformations of the basket components do not clash with each other across the symmetry unit interfaces, courtesy of their anchoring on the fixed double NR. The stoichiometries of yMlp1 and yMlp2 are ambiguous. 6 Thus, we used two copies of poly-alanine per symmetry unit (yMlp), representing both yMlp1 and yMlp2; the yMlp length was set to that of yMlp1. The model also included a single copy of yNup1 and two copies of yNup2, yNup60, and the heptameric yNup84 complex. FG repeats were not included in the model. In total, the yBasket model consists of 21 protein subunits of 12 types ( Table S2 ). A similar representation was used for mBasket modeling with two copies of mTpr, two copies of mNup50, mNup153, and the nonameric mNup107 complex ( Tables S1 and S3 ). 36 , 115 , 116 Thus, the mBasket model consists of 24 protein subunits of 12 types ( Table S3 ). Each component was represented in a multiscale fashion to balance the accuracy of the formulation of restraints and the efficiency of structural sampling ( Figure S4C ; Tables S2 and S3 ). Spatial restraints on yeast and mouse baskets. The subset of input information was converted to spatial restraints for scoring alternative models. 50 These restraints include upper bounds on pairs of crosslinked residues based on chemical crosslinks, the correlation coefficient between Gaussian Mixture Models of a model and the cryo-ET map, positional restraints on NTD/CTD domains of yMlps based on immuno-EM localizations, distance restraints between pairs of domains based on affinity co-purification data, positional restraints on residue segments predicted to lie within the nuclear envelope, connectivity restraints between consecutive pairs of beads in a subunit, excluded volume restraints between non-bonded pairs of beads ( Table S2 ). 50 For the mBasket ( Table S3 ), crosslinking and affinity copurification data were unavailable. However, we supplemented the remaining mBasket restraints with structural equivalence restraints; these distance restraints are designed to maximize the similarity between the mouse and yeast models across the aligned residues, subject to the satisfaction of the remaining restraints. Stage 3: Structural sampling The initial positions and orientations of rigid bodies and flexible beads were randomized except for the double NR rigid body ( Table S2 ), whose position was obtained by fitting into the cryo-ET map, ensuring accurate alignment with experimental cryo-ET maps ( Figure 3 Stage 3; Table S2 ). Structural sampling of rigid body positions and orientations as well as flexible bead positions, was performed using the Replica Exchange Gibbs Monte Carlo (MC) algorithm ( Table S2 ). 117 , 118 Each MC step consisted of a series of random transformations (i.e., rotations and translations) applied to the rigid bodies and flexible beads. The same sampling protocol was used for mBasket modeling, except that the starting structure mimicked the yBasket model ( Table S3 ). Thus, by construction, any potential differences between the yeast and mouse basket models are a direct consequence of the differences on the cryo-ET maps and other input information. Stage 4: Analysis and validation Model validation followed four steps 52 , 119 : (i) selection of the models for validation, (ii) estimation of sampling precision ( Figure S5A ), (iii) estimation of model precision, and (iv) quantification of the degree to which a model satisfies the information used and not used to compute it ( Tables S2 and S3 ; Figures S5 and S6 ). 52 , 120 Integrative modeling iterated through the four stages to find a set of models that satisfy our validation criteria listed above. In each iteration, we considered the input information, representation, scoring, and sampling guided by an analysis of models computed in the preceding iteration of the modeling. For example, the initial low precision of the yBasket model encouraged us to improve the resolution of the cryo-ET map by averaging a larger number of subtomograms; and the initial inability to find yBasket models that satisfied both cryo-ET and crosslinking data encouraged us to increase the resolution and flexibility of the coiled-coil representations, re-defining the coiled-coil segments, 97 disorder predictions for FG Nups, 112 and adding proximity restraints to some components. Figures All figures depicting cryo-ET maps and models were generated using Chimera/ChimeraX 99 , 100 and its RMSF plugin ( https://github.com/salilab/rmf_chimerax ).
Supplementary Material MMC1 MMC2 3
📊 Figures
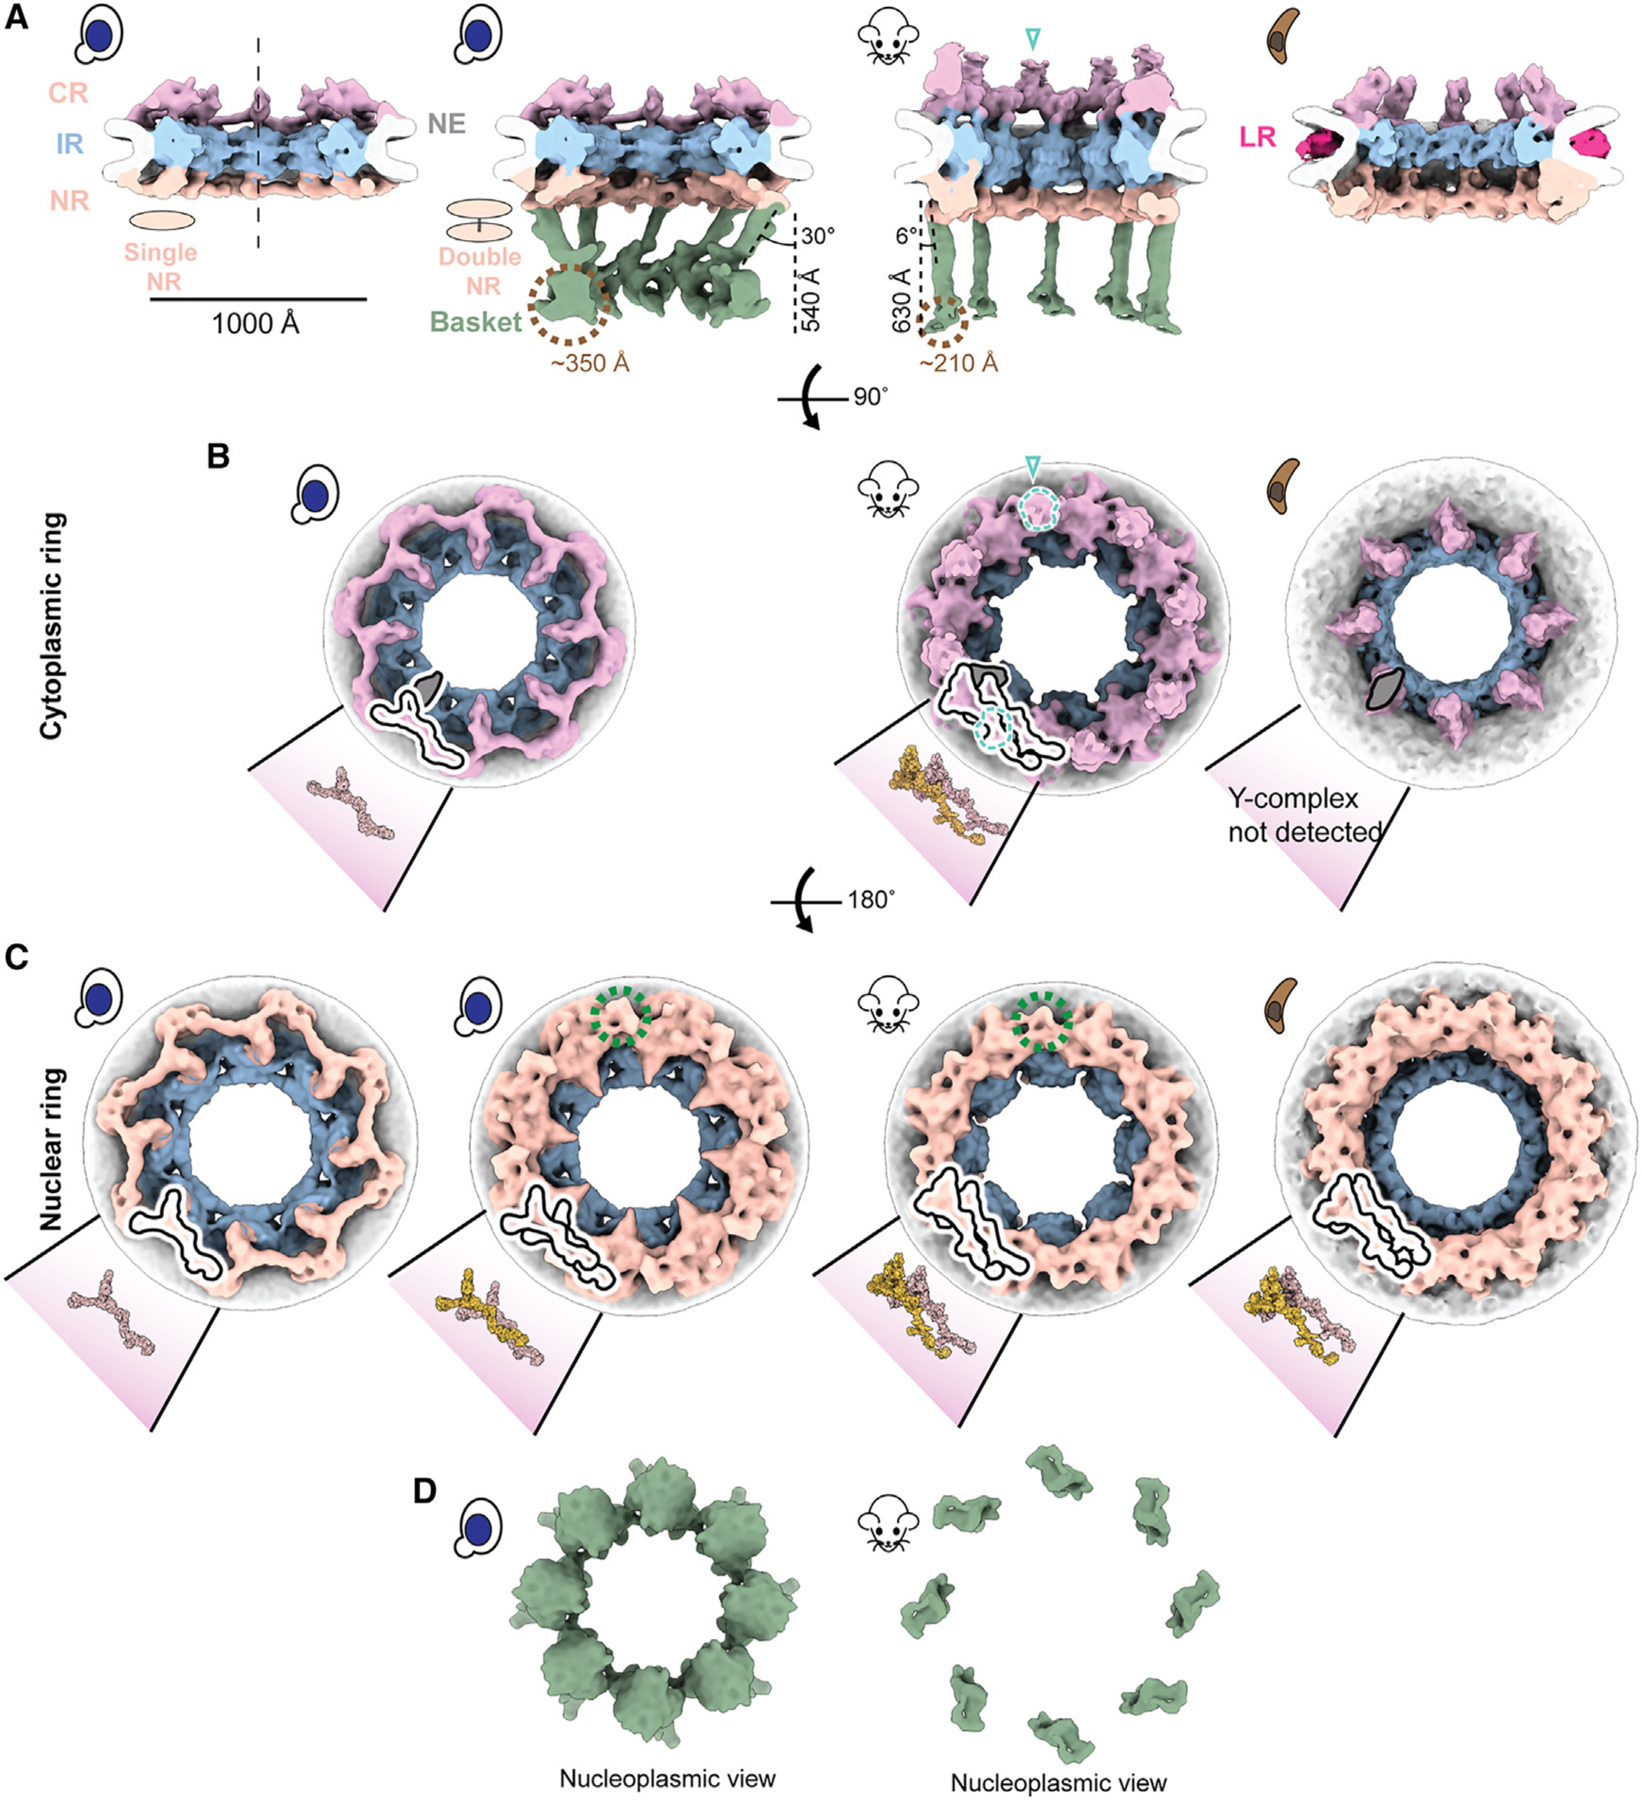
Figure 1.
A stable nuclear basket is bound to a double nuclear ring
(A) Cross-sectional views along the central axis (dashed line) of the in-cell cryo-ET maps of yNPC with single and double NR variants, mNPC and pNPC. The nuclear basket is resolved for the mNPC and yN...
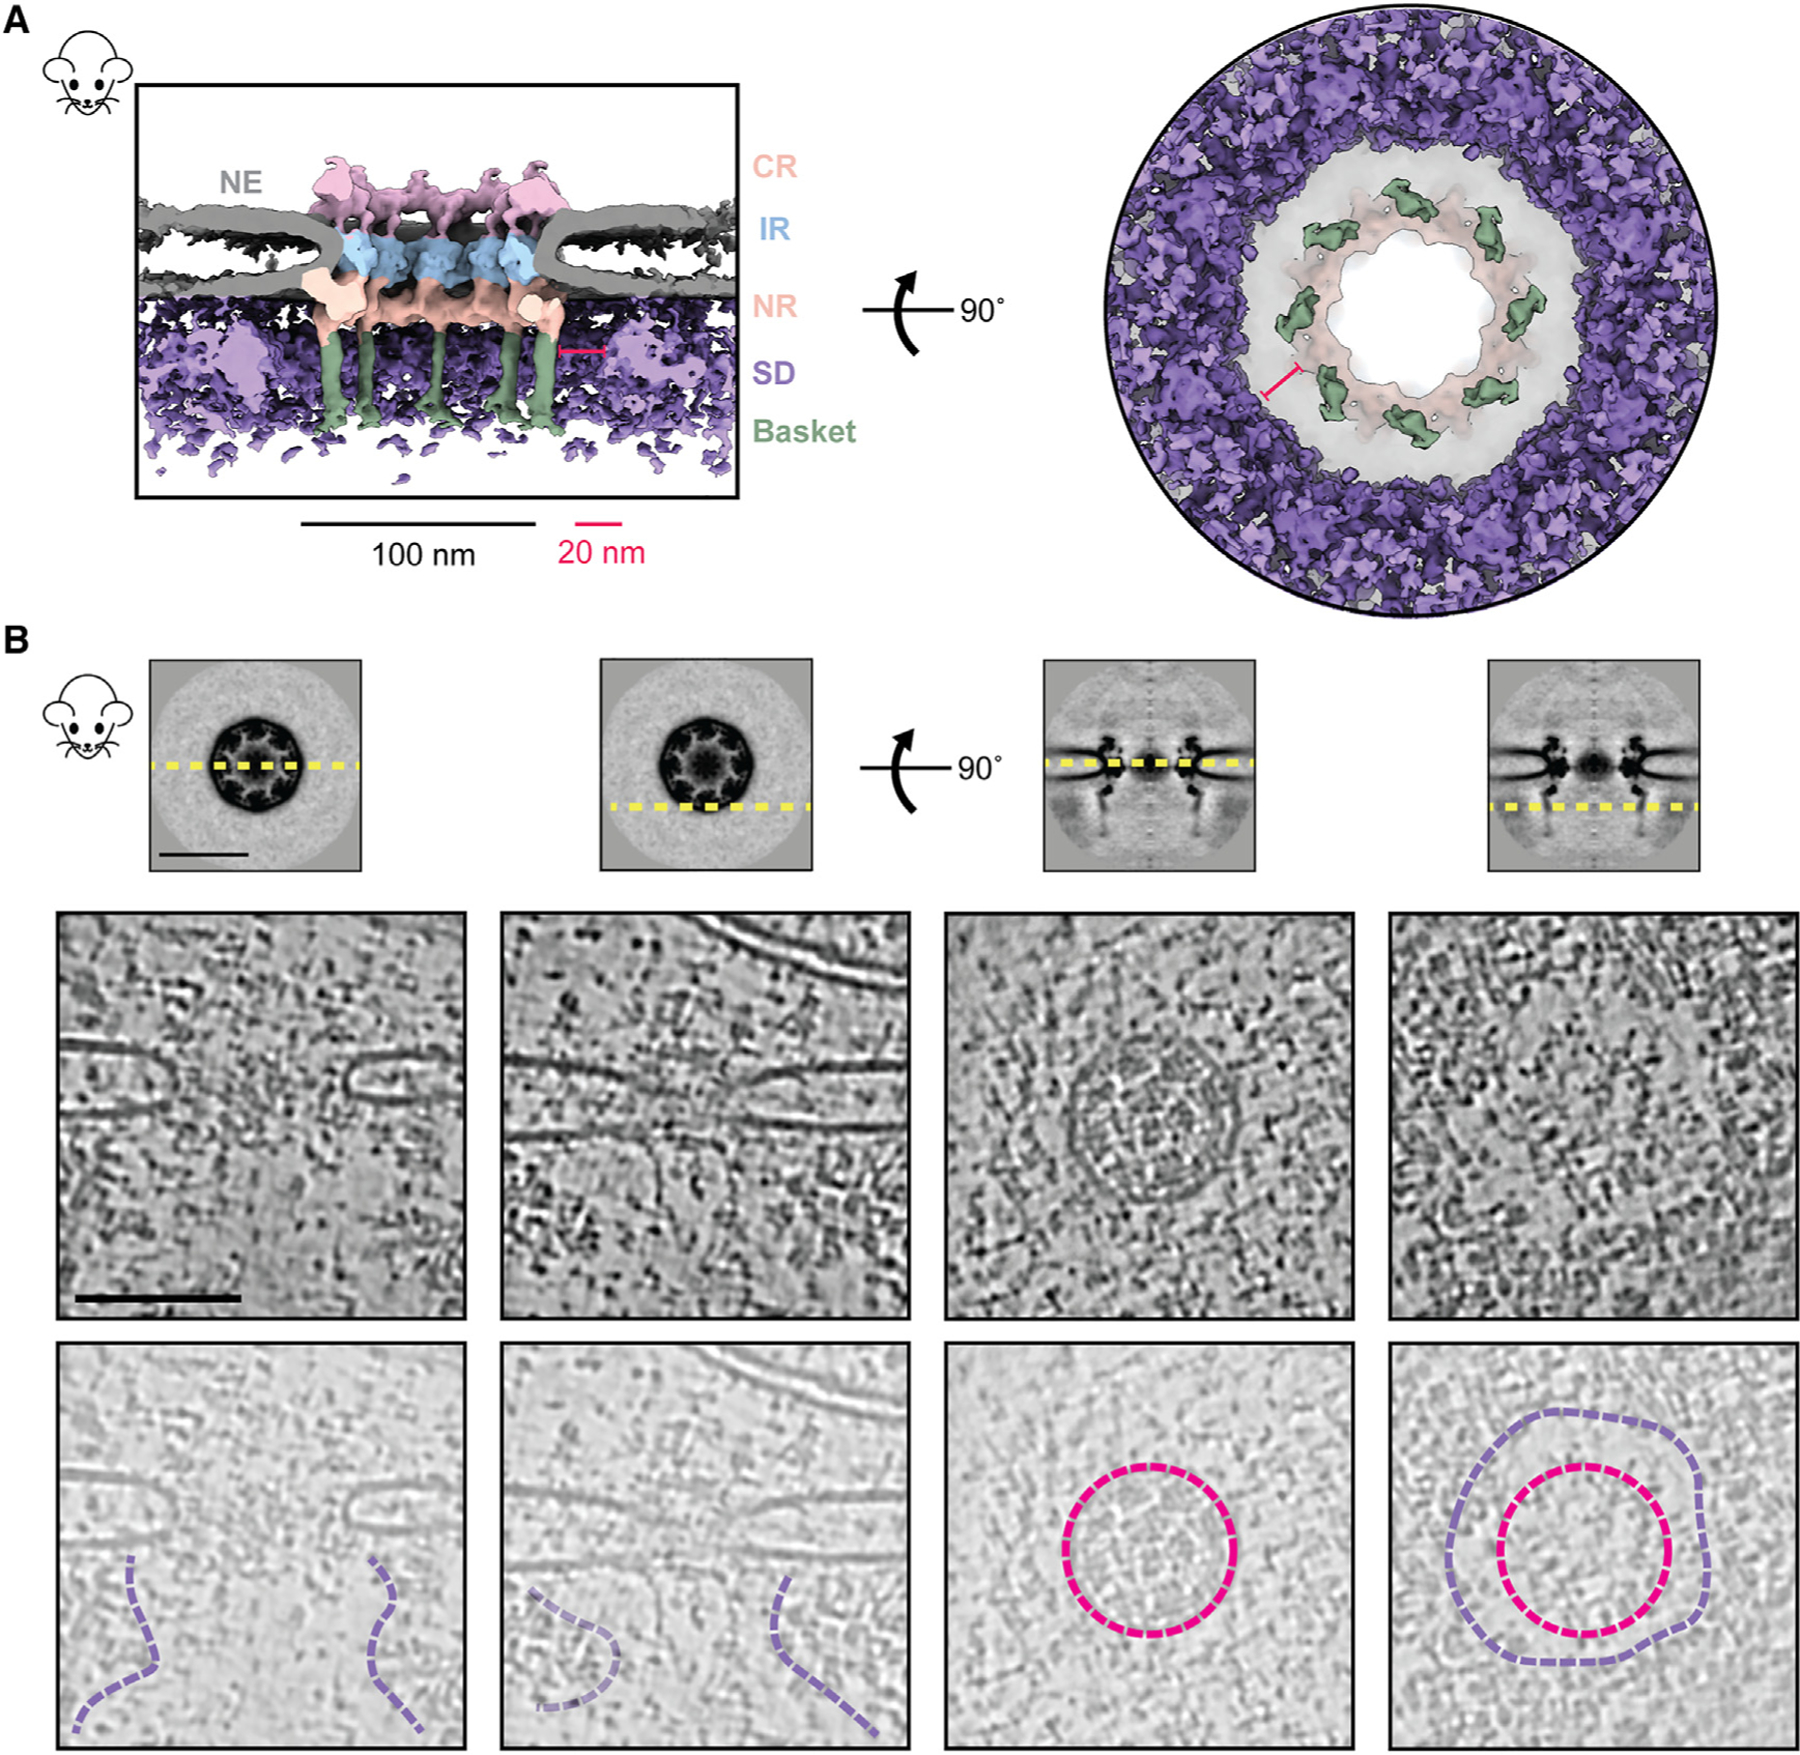
Figure 2.
Direct observation of the heterochromatin exclusion zone around the mNPC
(A) The cross-sectional (left) and nucleoplasmic view (right) of the C8-symmetrized average map of mNPC shows that molecular crowding (via surrounding densities [SDs]) around the mNPC is absent in the...
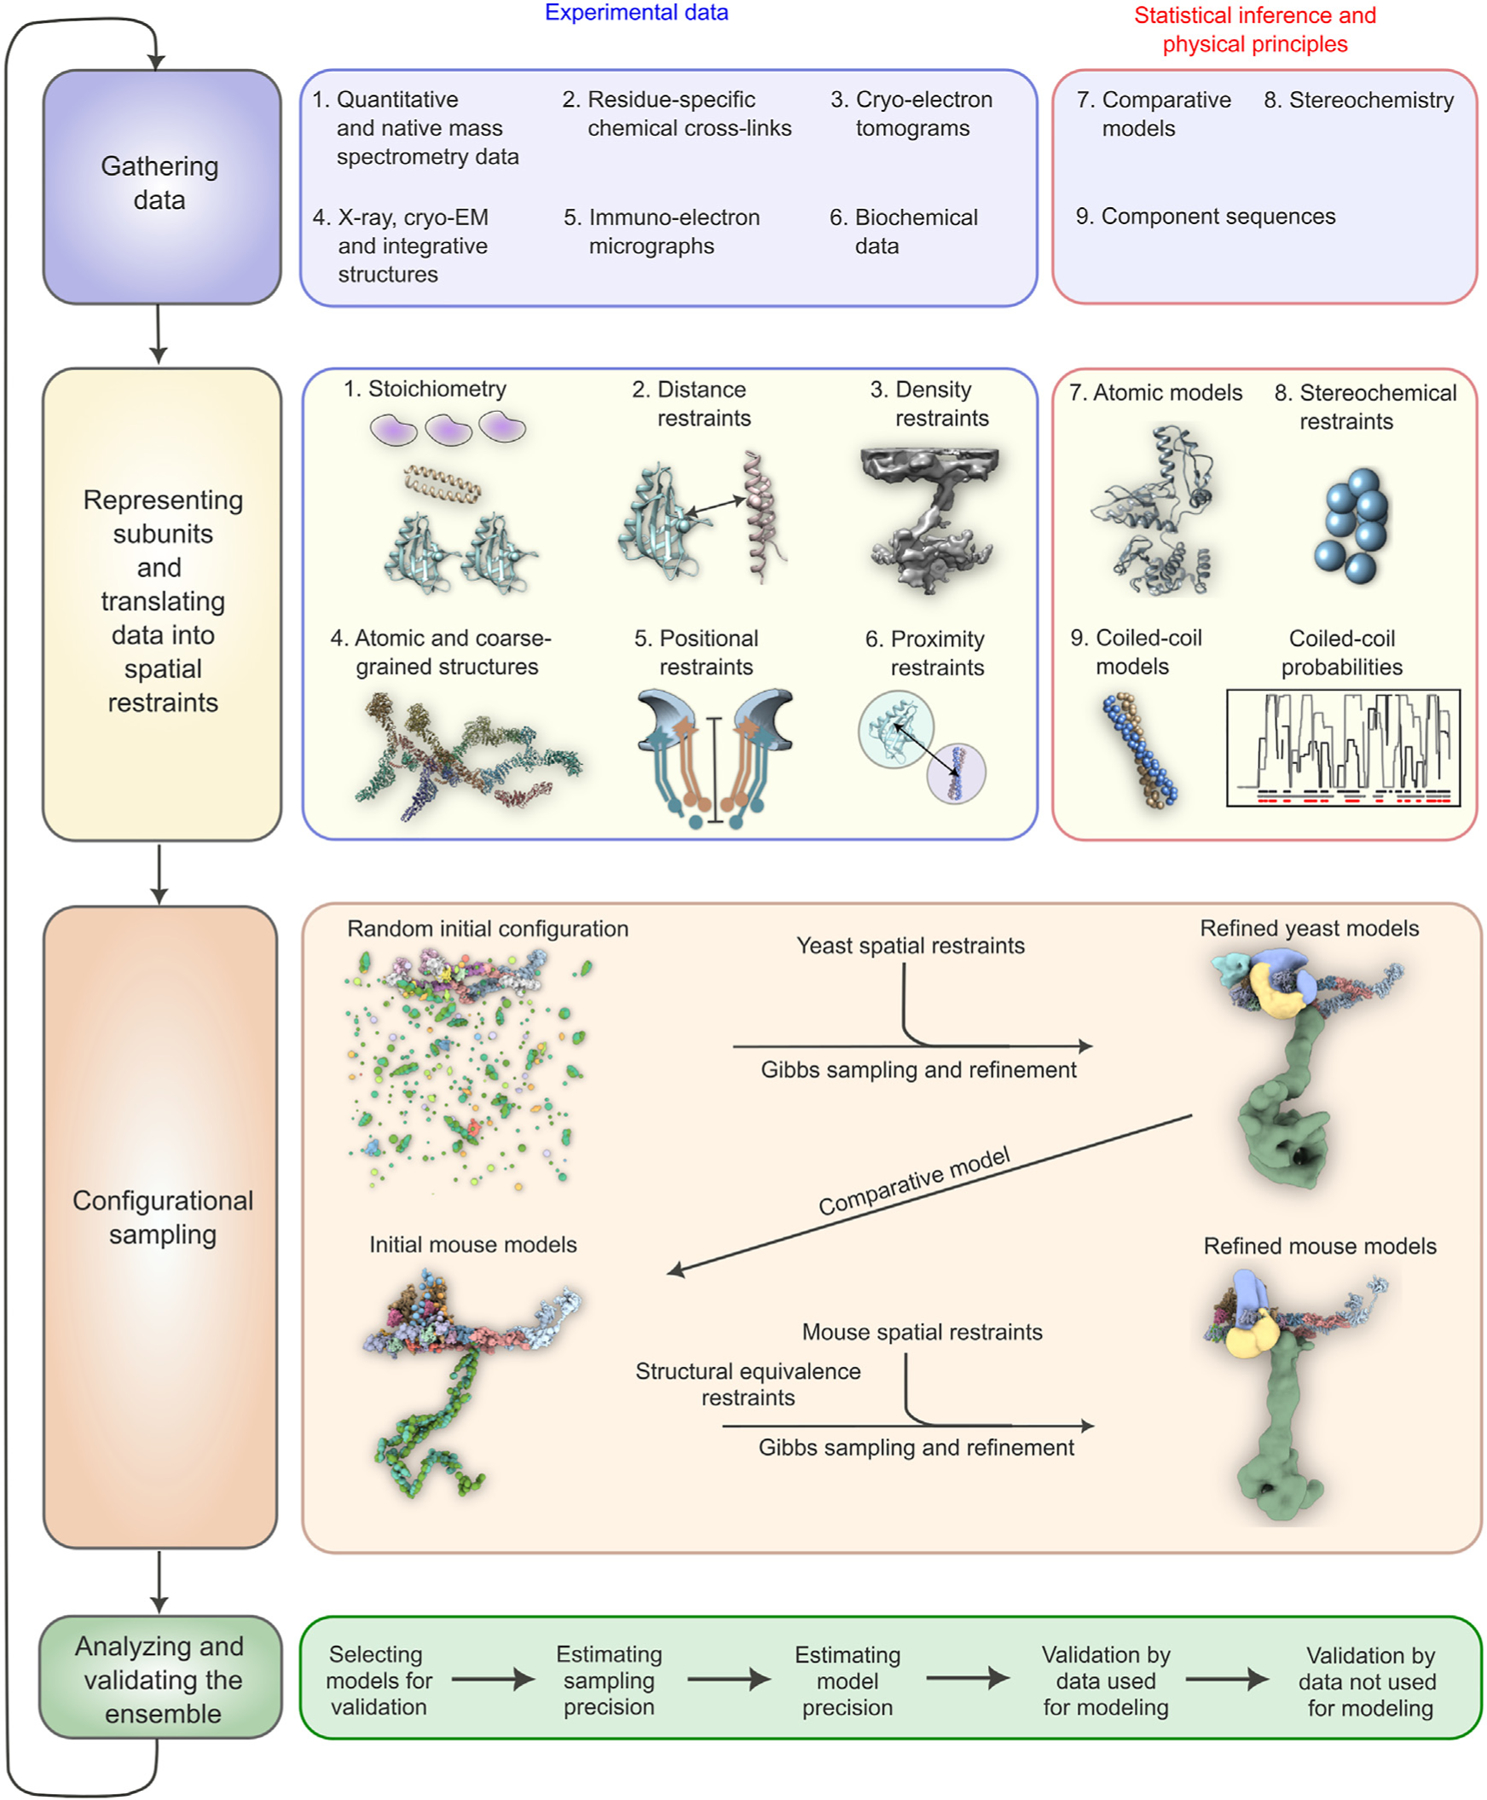
Figure 3.
The four-stage scheme for integrative modeling of the baskets
Our integrative approach proceeds through four stages: (1) gathering data, (2) representing subunits and translating the data into spatial restraints, (3) configurational sampling to produce an ensemb...
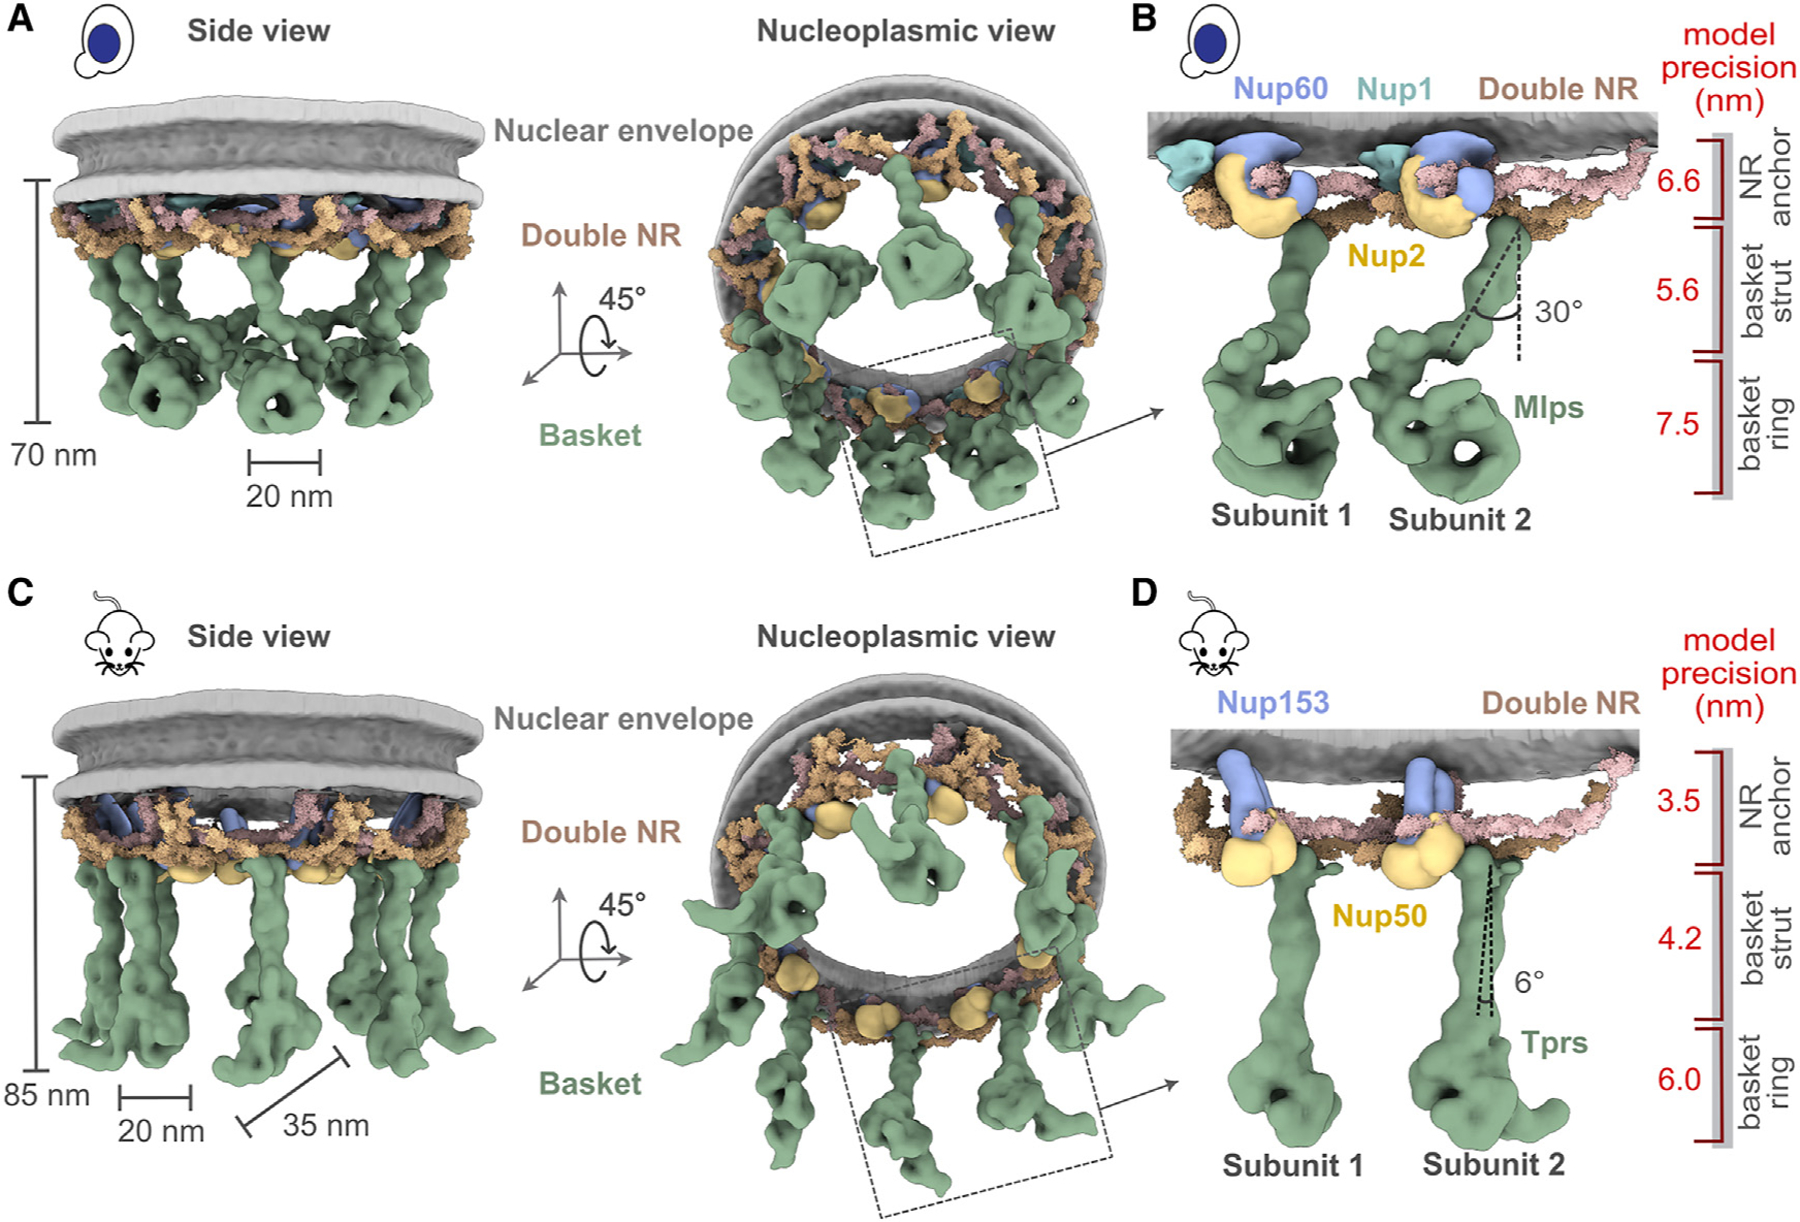
Figure 4.
Integrative structure models and precisions of yeast and mammalian nuclear baskets
(A and C) Localization probability density for the yBasket (containing yMlp, yNup1, yNup60, and yNup2 Nups) and mBasket (containing mTpr, mNup50, and mNup153 Nups) obtained from the ensemble of good s...
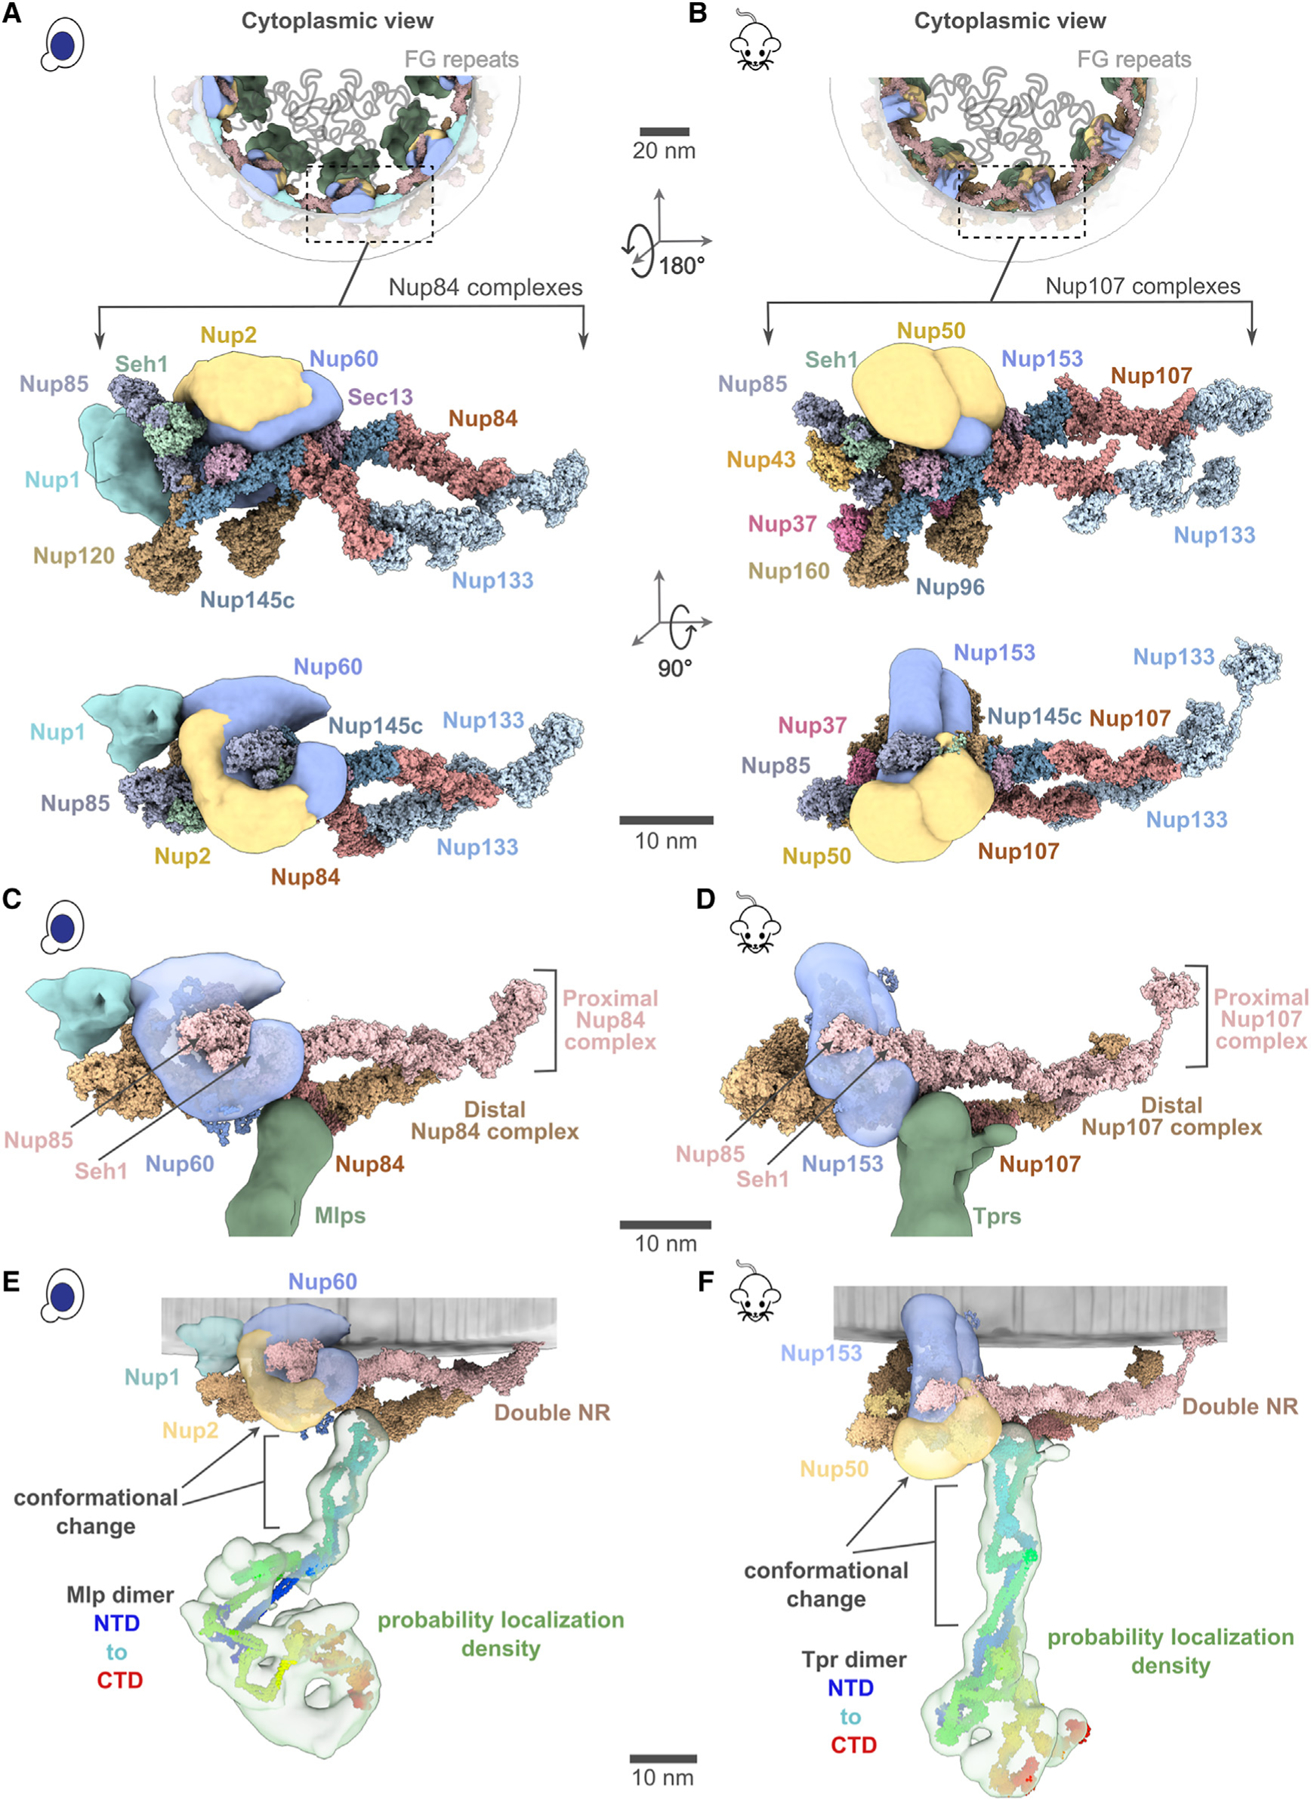
Figure 5.
Position of different nucleoporins in the basket model
(A and B) Cytoplasmic view of the yeast and mammalian basket zooms into a Y-complexes (yNup84 complex for yeast and mNup107 complex for mammalian). Schematic representations of the FG repeats and anch...
Figure images are served from the NIH/NLM PubMed Central Open Access Subset or Europe PMC; copyright remains with the publishers and authors.
💬 Discussion
0 commentsNo comments yet. Be the first to start a discussion!
Leave a Comment