Abstract
AbstractExtracellular vesicles (EVs) are secreted from all cell types and are intimately involved in tissue homeostasis. They are being explored as vaccine and gene therapy platforms, as well as potential biomarkers. As their size is below the diffraction limit of light microscopy, direct visualizations have been daunting and single‐particle studies under physiological conditions have been hampered. Here, direct stochastic optical reconstruction microscopy (dSTORM) was employed to visualize EVs in three‐dimensions and to localize molecule clusters such as the tetraspanins CD81 and CD9 on the surface of individual EVs. These studies demonstrate the existence of membrane microdomains on EVs. These were confirmed by Cryo‐EM. Individual particle visualization provided insights into the heterogeneity, structure, and complexity of EVs not previously appreciated
🔬 Techniques
🔭 Microscopes
💻 Software
✨ Fluorophores
🧪 Sample Preparation
🏭 Microscope Brands
🧪 Reagent Suppliers
📷 Detectors
🔎 Objectives
💻 Software Details
🏛️ Research Organizations (ROR)
Affiliated research institutions:
📋 Methods
Cell lines
Human osteosarcoma (U‐2 OS) cells were obtained from the ATCC (HTB‐96) and grown in Dulbecco's Modified Eagle Medium (DMEM) (Thermo Fisher 21013024) supplemented with 10% exosome‐free Foetal Bovine Serum (FBS) (VWR 97068–085) and 100 units/ml of Penicillin, 100 μg/ml of Streptomycin solution (Gibco 15140‐122). Cells were maintained at 37°C and 5% CO 2 . To develop clonal cell lines, 10 6 U‐2 OS cells (ATCC HTB‐96) were plated onto a 10‐cm tissue culture plate (Fisher 430167) and transfected with 1 μg of plasmid with 5 μl of Lipofectamine‐2000 (ThermoFisher 11668019) diluted in DMEM. Cells were selected using 500 μg/ml of Geneticin (Thermo Fisher 10131035).
Single‐cell fluorescence‐assisted cell sorting
(FACS) was done using the FACS Aria II, maintained and operated by the UNC Flow Cytometry Core. Cells were grown in selective media and verified for continual fluorescence activity using an BD Accuri 6 Plus flow cytometer (BD Biosciences) equipped with a 488 and 640 laser, along with the emission filters FITC (488–519 nm), PE (546–578 nm), PerCP (640–678 nm), and APC (650–670 nm). mCherry‐CD81‐10 was a gift from Michael Davidson (Addgene plasmid # 55012). CD63‐pEGFP C2 was a gift from Paul Luzio (Addgene plasmid # 62964).
EV isolation and purification U‐2
OS cells were grown to confluency, and supernatant containing EVs was processed as previously described (Mcnamara et al., 2018 ). In short, 0.5–1.0 L of cell culture supernatant was passaged through a 0.45 and 0.22 μm vacuum filtration apparatus (Genesee 25–230 and 25–227, respectively). Clarified supernatant was concentrated and equilibrated with 1X phosphate‐buffered saline (PBS) via tangential‐flow filtration using the AKTA Flux S (GE Healthcare 29038437) equipped with a 750 kDa cut‐off filter (GE Healthcare 29‐0142‐95). The concentrated/equilibrated solution was further concentrated by precipitating with 40 mg/ml of PEG‐8000 overnight and centrifugation at 1200 * g at 4°C for 1 h. EV pellets were resuspended in 0.5 ml of 1X PBS, DNAse and RNAse‐treated, and incubated with 50 μg/ml of CellMask Red and/or CellMask Green (CM Red or CM Green, respectively, Thermo Fisher C10046 and C37608 ) for full EV saturation as imaged by dSTORM (see below), and RNase A (50 μg/ml, Thermo Scientific, EN0531) at 4°C for 1 h and fractionated on the AKTA Start equipped with a HiTrap Capto Core 700 column (GE Healthcare 17548151). Affinity selection for CD81+ EVs was done using anti‐CD81 beads (Thermo Fisher 10616D) overnight. Beads were washed three times with 1X PBS and CD81+ EVs were eluted using 0.2 M Glycine pH = 2.0 at 37 °C for 30 min. The EV solution was then transferred to another tube containing an equal volume of 100 mM Tris‐HCl pH = 7.5 in 1X PBS.
Show full methods section
Cell lines
Human osteosarcoma (U‐2 OS) cells were obtained from the ATCC (HTB‐96) and grown in Dulbecco's Modified Eagle Medium (DMEM) (Thermo Fisher 21013024) supplemented with 10% exosome‐free Foetal Bovine Serum (FBS) (VWR 97068–085) and 100 units/ml of Penicillin, 100 μg/ml of Streptomycin solution (Gibco 15140‐122). Cells were maintained at 37°C and 5% CO 2 . To develop clonal cell lines, 10 6 U‐2 OS cells (ATCC HTB‐96) were plated onto a 10‐cm tissue culture plate (Fisher 430167) and transfected with 1 μg of plasmid with 5 μl of Lipofectamine‐2000 (ThermoFisher 11668019) diluted in DMEM. Cells were selected using 500 μg/ml of Geneticin (Thermo Fisher 10131035).
Single‐cell fluorescence‐assisted cell sorting
(FACS) was done using the FACS Aria II, maintained and operated by the UNC Flow Cytometry Core. Cells were grown in selective media and verified for continual fluorescence activity using an BD Accuri 6 Plus flow cytometer (BD Biosciences) equipped with a 488 and 640 laser, along with the emission filters FITC (488–519 nm), PE (546–578 nm), PerCP (640–678 nm), and APC (650–670 nm). mCherry‐CD81‐10 was a gift from Michael Davidson (Addgene plasmid # 55012). CD63‐pEGFP C2 was a gift from Paul Luzio (Addgene plasmid # 62964).
EV isolation and purification U‐2
OS cells were grown to confluency, and supernatant containing EVs was processed as previously described (Mcnamara et al., 2018 ). In short, 0.5–1.0 L of cell culture supernatant was passaged through a 0.45 and 0.22 μm vacuum filtration apparatus (Genesee 25–230 and 25–227, respectively). Clarified supernatant was concentrated and equilibrated with 1X phosphate‐buffered saline (PBS) via tangential‐flow filtration using the AKTA Flux S (GE Healthcare 29038437) equipped with a 750 kDa cut‐off filter (GE Healthcare 29‐0142‐95). The concentrated/equilibrated solution was further concentrated by precipitating with 40 mg/ml of PEG‐8000 overnight and centrifugation at 1200 * g at 4°C for 1 h. EV pellets were resuspended in 0.5 ml of 1X PBS, DNAse and RNAse‐treated, and incubated with 50 μg/ml of CellMask Red and/or CellMask Green (CM Red or CM Green, respectively, Thermo Fisher C10046 and C37608 ) for full EV saturation as imaged by dSTORM (see below), and RNase A (50 μg/ml, Thermo Scientific, EN0531) at 4°C for 1 h and fractionated on the AKTA Start equipped with a HiTrap Capto Core 700 column (GE Healthcare 17548151). Affinity selection for CD81+ EVs was done using anti‐CD81 beads (Thermo Fisher 10616D) overnight. Beads were washed three times with 1X PBS and CD81+ EVs were eluted using 0.2 M Glycine pH = 2.0 at 37 °C for 30 min. The EV solution was then transferred to another tube containing an equal volume of 100 mM Tris‐HCl pH = 7.5 in 1X PBS.
EV quantitation and biophysical characterizations
Size and particle concentrations were determined using the ZetaView (Particle Metrix PMX‐120BASIC). EVs were diluted in nanopure water until approximately 50–200 particles were in a field of view. Size distribution profiles and concentrations were taken using eleven technical replicates per sample. A total of ≥ three complete biological replicates from independent cultures at different dates were done to ensure reproducibility.
Animal care
All experiments using rhesus macaques were approved by the Tulane Institutional Animal Care and Use Committee. The Tulane National Primate Research Centre (TNPRC) is an Association for Assessment and Accreditation of Laboratory Animal Care International‐accredited facility (AAALAC #000594). The NIH Office of Laboratory Animal Welfare assurance number for the TNPRC is A3071‐01. All clinical procedures, including administration of anaesthesia and analgesics, were carried out under the direction of a laboratory animal veterinarian. All possible measures are taken to minimize the discomfort of all the animals used in this study. Tulane University complies with NIH policy on animal welfare, the Animal Welfare Act, and all other applicable federal, state, and local laws.
Fluorescence microscopy
Cells were seeded onto glass coverslips previously sterilized with 1% HCl diluted in 70% ethanol inside of a 6‐well plate (Fisher 07‐200‐83). Cells were imaged as previously described (Mcnamara et al., 2018 ) using the DM55008 microscope (Leica) equipped with the Leica HCX PL Apo 63x Oil Objective and the Leica HCX PL Apo 100x Oil Objective lenses (both with numerical aperture = 1.40). Coverslips were mounted onto Frosted Micro Slides (Corning 2948–75 × 25) using 30 μl of ProLong Gold Antifade Reagent (Cell Signalling 9071S). Z‐stacks were captured and deconvoluted using MetaMorph V 7.8.12.0 (Molecular Devices), and multi‐plane images were visualized using Imaris V 9.2.0 (Bitplane).
Super‐resolution microscopy U‐2
OS cell lines were grown in Glass Bottom 15 μ‐Slide 8 well plates (Ibidi 80827). Cells were fixed and permeabilized as above. Cells were blocked with 5% bovine serum albumin (BSA) (Thermo Fisher BP9706‐100) diluted in 1X PBS at 4°C for 1 h and incubated with Phalloidin‐488 (Thermo Fisher A12379) at a dilution of 1:100 for 1 h at room temperature. Cells were overlaid with 200 μl of B‐cubed buffer (Oxford Nanoimaging) for 30 min at room temperature before visualization. The Nanoimager (Oxford Nanoimaging) was calibrated for dSTORM using 100 nm Tetraspek microspheres (Invitrogen T7279) diluted in water. Calibration beads were viewed under the Nanoimager using a 405/473/561/640 nm laser configuration with a 100X oil‐objective lens. X, Y, and Z axes errors were obtained after the 3‐D mapping calibration was completed. Parameters for super‐resolution are summarized in Tables S1 and S 2 . The software analysis program used was the Nanoimager Software v 1.4.8740 (Oxford Nanoimaging). Channels were pseudocoloured (Channel 0 = light blue #55aaff; Channel 1 = bright red #ff0011) for RG‐colourblind individuals. Videos of the 3‐D CD81+ EV were created by drawing a 3‐D visualization box around a region of interest. The video was recorded using ONI software and then converted into an MPEG4 or WMV file using HandBrake v 1.3.3.
EV tracing using super‐resolution images
For image localization points, .csv files were obtained by using the Nanoimager Software XYZ Plane View Tool (X by Y; X by Z; Y by Z). For size‐distribution analysis, individual EVs identified through dSTORM were identified and the Line Histogram Tool (ONI) was used to bisect the EV. Events were binned into 31 nm fragments away from the modal centre, allowing for size distribution analysis to be conducted. A total of 50 manual traces were done, each across three separate biological experiments, yielding n = 150. Individual particle tracking was done on 3‐D images using the Tracking Tool. Z‐position was used, and point tracking was done to give an estimated concentration and mean diameter of 3‐D objects.
EV lysis and immunoblotting
EVs were lysed in EV‐lysis buffer (1% NP‐40, 5% Glycerol, 0.5% sodium dodecyl sulphate (SDS), 0.5% sodium deoxycholate, 150 mM NaCl, and 1 mM PMSF) in two separate tubes. To one tube, dithiothreitol (DTT) was added to a final concentration of 1 mM DTT. Cellular and EV fractions were run on a 4–12% NuPAGE Bis‐Tris 15‐well gel (ThermoFisher NP0336BOX) using 1X Bolt MES buffer (ThermoFisher B0002) at constant voltage for 60 min and transferred to nitrocellulose membranes (Bio‐Rad 1620115) at 250 mA for 90 min.
Primary antibodies at dilutions listed in Table
S4 in 8% milk in Tris‐buffered saline + tween‐20 (TBS‐T) were incubated with the membrane for > 1 h. Membranes were vigorously washed 3X with tris‐buffered saline + tween‐20 (TBS‐T) for 10 min per wash and then secondary antibodies at dilutions shown in Table S4 in 8% milk in TBS‐T were incubated with the membrane for > 1 h. Images were taken on the Li‐Cor Odyssey and analysed using Image Studio V. 5.2. Tetraspanins were detected using non‐reducing conditions, whereas other proteins were detected under reducing conditions.
Transmission Electron Microscopy
(EM) preparation EV samples were adsorbed to glow‐discharged carbon‐coated 400‐mesh copper grids for 3 min and then stained with 2% (weight/volume) uranyl acetate in water, rinsed briefly with water, and air‐dried. The grids were visualized in a FEI Tecnai 12 transmission EM at 80 kV. Images were captured on a Gatan Orius CCD camera with Gatan Digital Micrograph software. Cryogenic electron microscopy (Cryo‐EM) The Cryo‐EM core operated by UNC houses a 200 KV Thermo Fisher Scientific Talos Arctica G3 TEM equipped with a Gatan K3 direct electron detector. EVs purified in the absence of any acidic elution steps were added onto a Quantifoil grid (R 1.2/1.3, 400 Mesh, Copper) from EMS (ID: Q425CR1.3) and snap‐frozen in ethane and propane mixture prechilled by liquid nitrogen to ‐165°C at a concentration of 10 10 particles/ml. Individual Cryo‐EM snapshots were obtained in .mrc format and exported to high‐resolution .tiff images using IMOD 4.11 (University of Colorado).
Supporting information Supplementary Information Click here for additional data file. Supplementary Information Click here for additional data file. Supplementary Information Click here for additional data file. Supplementary Information Click here for additional data file. Supplementary Information Click here for additional data file. Supplementary Information Click here for additional data file. Supplementary Information Click here for additional data file. Supplementary Information Click here for additional data file. Supplementary Information Click here for additional data file. Supplementary Information Click here for additional data file. Supplementary Information ‐ Table S1 Click here for additional data file. Supplementary Information ‐ Table S2 Click here for additional data file. Supplementary Information ‐ Table S3 Click here for additional data file. Supplementary Information ‐ Table S4 Click here for additional data file.
📊 Figures
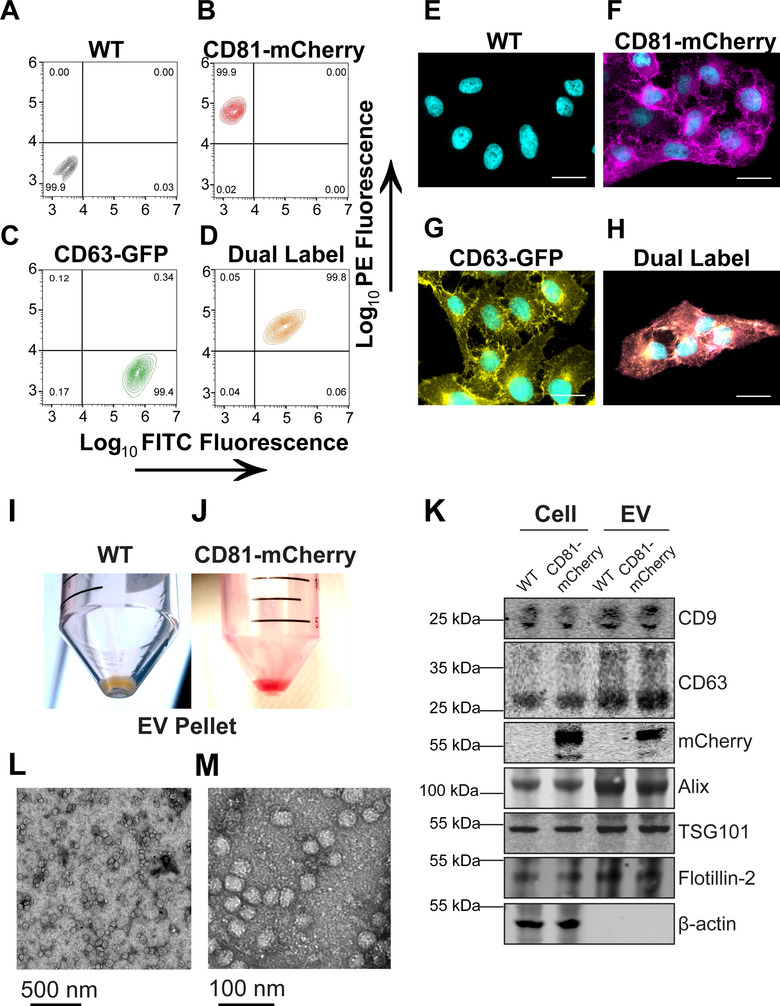
FIGURE 1
Generation of clonal CD81u2010mCherry cells . (Au2013D) Uu20102 OS cells were transfected with the indicated plasmid and selected via FACS and cell populations were analysed for clonal expansion via f...
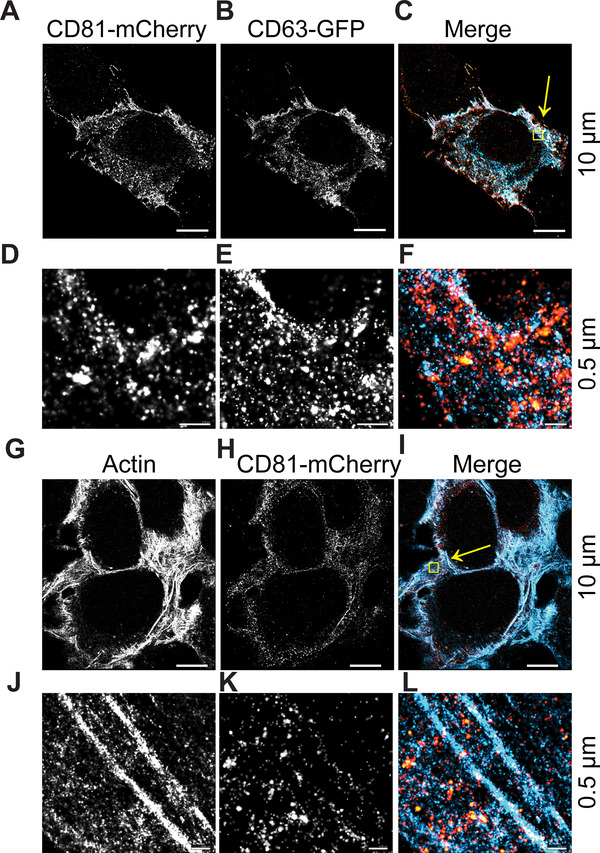
FIGURE 2
CD81 and CD63 cou2010occupy intracellular regions . (Au2010C) CD63u2010GFP and CD81u2010mCherry Uu20102 OS expressing cells were visualized by dSTORM. (Du2013F) Zoomedu2010in view of yellow box in C. ...
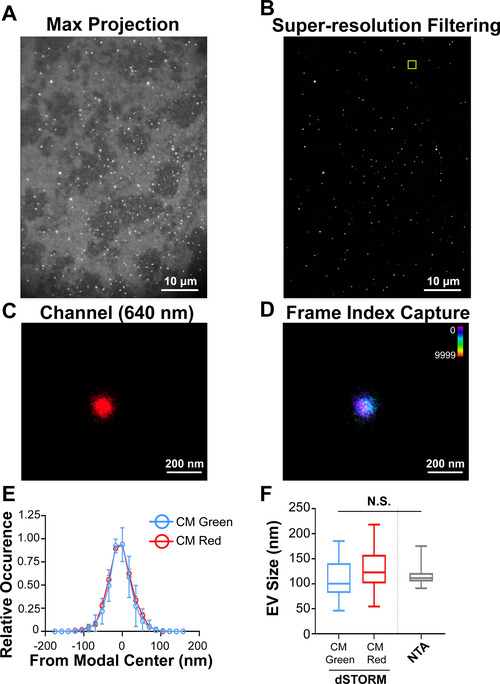
FIGURE 3
Superu2010resolution (dSTORM) microscopy of a single EV in solution . (A) CD81+ EVs were affinity purified and labelled with the photoswitchable dye CM Red. Max projection image (i.e., preu2010dSTORM ...
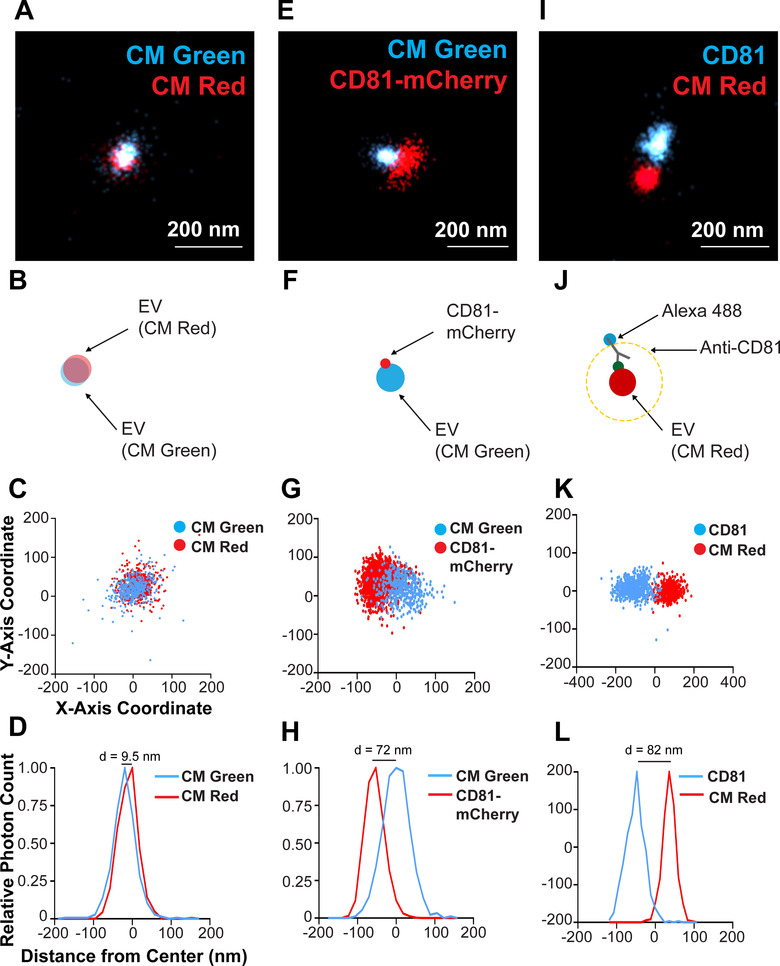
FIGURE 4
Twou2010colour staining of a single CD81+ EV and visualization of CD81 localized to the membrane . (A) CD81+ EVs were dual stained with CM Green and CM Red and imaged using dSTORM. (B) Scheme of the e...
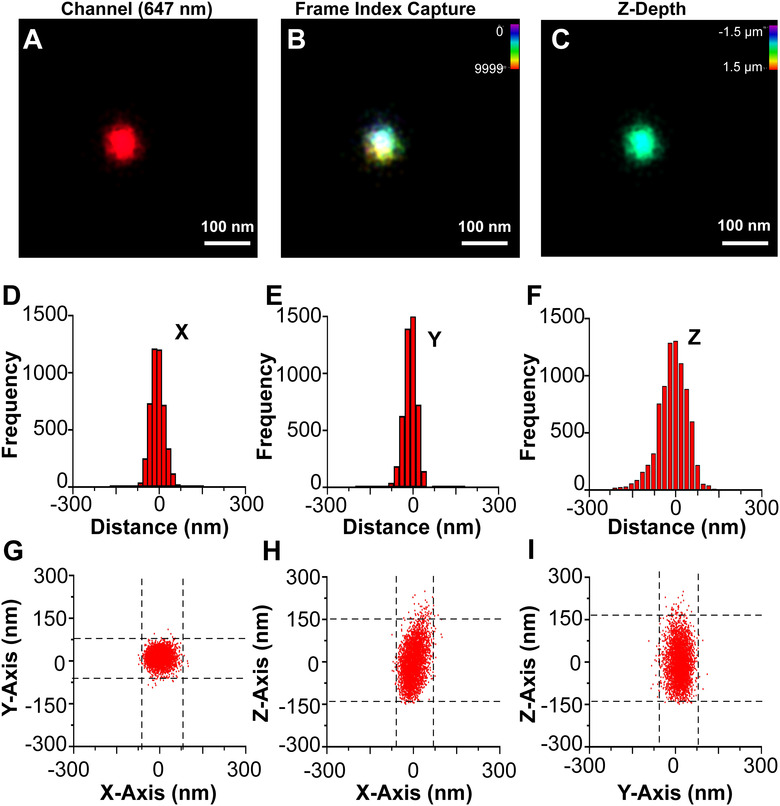
FIGURE 5
3u2010D dSTORM of a single CD81+ EV . (A) A single CD81+ EV from WT cells stained with CM Red was visualized by dSTORM with Zu2010axis astigmatism activated. (B) Frame index capture of the CD81+ EV sh...
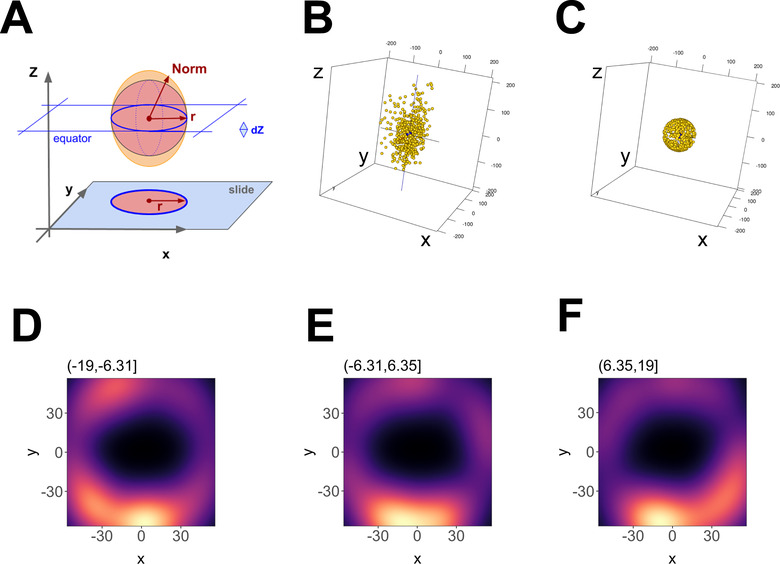
FIGURE 6
3u2010D reconstruction of a single EV . (A) Outline of the geometric foundation, with u201cslideu201d indicating the focal plane at zu00a0=u00a0u2010max. The filled red circle and red radius depict ho...
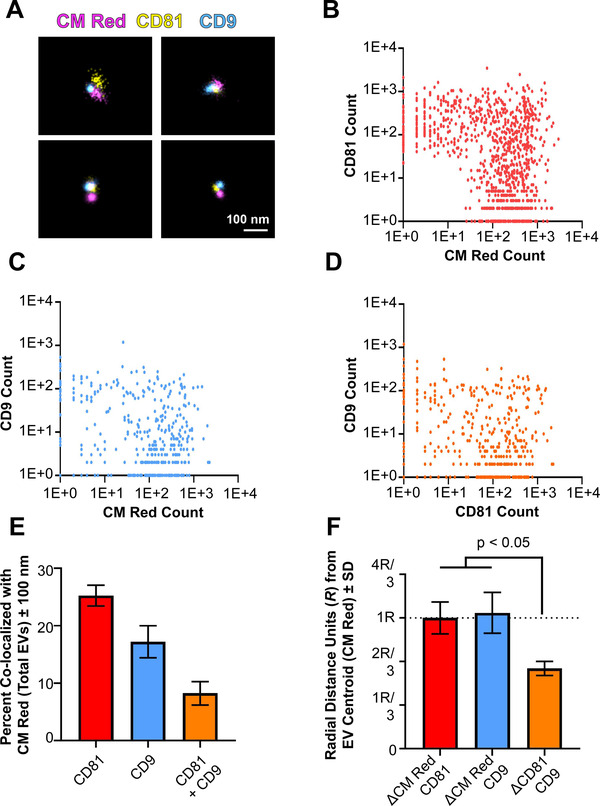
FIGURE 7
Tetraspanins cluster on the surface of single EVs . (A) Threeu2010colour dSTORM was performed on total EVs using emissions from CM Red, CD81u2010mCherry, and antiu2010CD9 Alexafluoru2010488. Four repr...
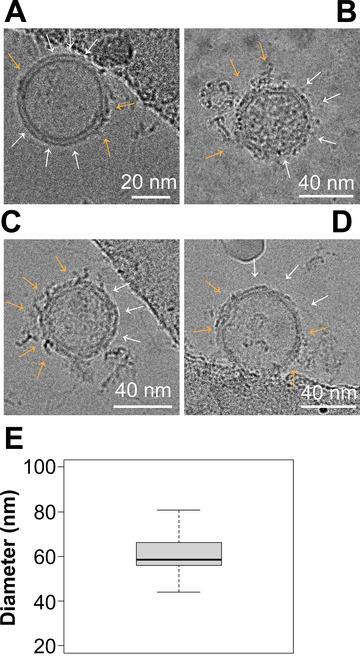
FIGURE 8
Cryou2010EM of EVs shows proteinu2010rich clusters on the surface . (Au2013D) Representative images of EVs viewed under Cryou2010EM. Surface nanodomains are shown with an orange arrow, highlighting th...
Figure images are served from the NIH/NLM PubMed Central Open Access Subset or Europe PMC; copyright remains with the publishers and authors.
💬 Discussion
0 commentsNo comments yet. Be the first to start a discussion!
Leave a Comment