Abstract
Disorders of lysosomal physiology have increasingly been found to underlie the pathology of a rapidly growing cast of neurodevelopmental disorders and sporadic diseases of aging. One cardinal aspect of lysosomal (dys)function is lysosomal acidification in which defects trigger lysosomal stress signaling and defects in proteolytic capacity. We have developed a genetically encoded ratiometric probe to measure lysosomal pH coupled with a purification tag to efficiently purify lysosomes for both proteomic and in vitro evaluation of their function. Using our probe, we showed that lysosomal pH is remarkably stable over a period of days in a variety of cell types. Additionally, this probe can be used to determine that lysosomal stress signaling via TFEB is uncoupled from gross changes in lysosomal pH. Finally, we demonstrated that while overexpression of ARL8B GTPase causes striking alkalinization of peripheral lysosomes in HEK293 T cells, peripheral lysosomes per se are no less acidic than juxtanuclear lysosomes in our cell lines.Abbreviations: ARL8B: ADP ribosylation factor like GTPase 8B; ATP: adenosine triphosphate; ATP5F1B/ATPB: ATP synthase F1 subunit beta; ATP6V1A: ATPase H+ transporting V1 subunit A; Baf: bafilomycin A1; BLOC-1: biogenesis of lysosome-related organelles complex 1; BSA: bovine serum albumin; Cos7: African green monkey kidney fibroblast-like cell line; CQ: chloroquine; CTSB: cathepsin B; CYCS: cytochrome c, somatic; DAPI: 4',6-diamidino -2- phenylindole; DIC: differential interference contrast; DIV: days in vitro; DMEM: Dulbecco's modified Eagle's medium; E8: embryonic day 8; EEA1: early endosome antigen 1; EGTA: ethylene glycol-bis(β-aminoethyl ether)-N,N,N',N'-tetraacetic acid; ER: endoplasmic reticulum; FBS: fetal bovine serum; FITC: fluorescein isothiocyanate; GABARAPL2: GABA type A receptor associated protein like 2; GAPDH: glyceraldehyde-3-phosphate dehydrogenase; GOLGA2/GM130: golgin A2; GTP: guanosine triphosphate; HEK293T: human embryonic kidney 293 cells, that expresses a mutant version of the SV40 large T antigen; HeLa: Henrietta Lacks-derived cell; HEPES: 4-(2-hydroxyethyl)-1-piperazineethanesulfonic acid; HRP: horseradish peroxidase; IGF2R/ciM6PR: insulin like growth factor 2 receptor; LAMP1/2: lysosomal associated membrane protein 1/2; LMAN2/VIP36: lectin, mannose binding 2; MAP1LC3/LC3: microtubule-associated protein 1 light chain 3; MTORC1: mechanistic target of rapamycin kinase complex 1; PCR: polymerase chain reaction; PDL: poly-d-lysine; PGK1p: promotor from human phosphoglycerate kinase 1; PIKFYVE: phosphoinositide kinase, FYVE-type zinc finger containing; PPT1/CLN1: palmitoyl-protein thioesterase 1; RPS6KB1/p70: ribosomal protein S6 kinase B1; STAT3: signal transducer and activator of transcription 3; TAX1BP1: Tax1 binding protein 1; TFEB: transcription factor EB; TGN: trans-Golgi network; TGOLN2/TGN46: trans-Golgi network protein 2; TIRF: total internal reflection fluorescence; TMEM106B: transmembrane protein 106B; TOR: target of rapamycin; TRPM2: transient receptor potential cation channel subfamily M member 2; V-ATPase: vacuolar-type proton-translocating ATPase; VPS35: VPS35 retromer complex component.
🔬 Techniques
🔭 Microscopes
🧬 Organisms
💻 Software
✨ Fluorophores
🧪 Sample Preparation
🔬 Cell Lines
🏭 Microscope Brands
🧪 Reagent Suppliers
🔎 Objectives
💻 Software Details
🏷️ Research Resource Identifiers (RRIDs)
Verified research resources used in this paper:
🏛️ Research Organizations (ROR)
Affiliated research institutions:
📋 Methods
Reagents
Fractionation buffer (pH 7.4) consisted of 50 mM KCl (Sigma-Aldrich, P9333), 1 mM EGTA (Sigma-Aldrich, E3889), 5 mM MgCl 2 (Sigma-Aldrich, M8266), 50 mM sucrose (Sigma-Aldrich, S7903), 20 mM HEPES (Sigma-Aldrich, H3375) pH 7.5, 2.5 mM ATP (Sigma-Aldrich, A2383) and protease inhibitors (Roche, 4693159001). Calibration buffers for measurement of lysosomal pH consisted of 140 mM KCl, 1 mM MgCl 2 , 0.2 mM EGTA, 20 mM HEPES for buffers at pH 7.0–8.0, 20 mM MES (Sigma-Aldrich, M3671) for buffers pH 4–6.5. The following primary antibodies were from Proteintech: RAB5A (11947-1-AP); RPS6KB1/p70 S6K (14485-1-AP); TGOLN2/TGN46 (13573-1-AP). The following primary antibodies were from Abcam: LAMP1 (ab107597, used only for immunofluorescence); LAMP2 (ab25631); GAPDH (ab9485); ATP5 F1B/ATPB (ab14730); ATP6V1A (ab199326); ATP6V1E1 (ab111733); RAB7A (ab137029); GOLGA2/GM130 (ab52649). The following primary antibodies were from Cell Signaling Technologies: EEA1 (C45B10); DYKDDDDK (14793); LAMTOR1 (8975). The anti-RFP primary antibody was from Chromotek (6G6). The anti-HsLAMP1 antibody used for western blot was from BD Biosciences (BD555798). The anti-LC3 primary antibody was from Nanotools (5F10). The anti-CYCS/cytochrome C antibody was from BioLegend (612302). The anti-VPS35 antibody was from Santa Cruz (sc374372). The anti-TFEB and anti-p-RPS6 (Ser233/236) primary antibodies were a generous gift from Prof. Sylvie Urbe and Prof. Michael Clague (Department of Cellular and Molecular Physiology, Institute of Translational Medicine, University of Liverpool, UK). The following secondary antibodies were from Pierce, goat anti-mouse HRP (31430); goat anti-rabbit HRP (31460). The donkey anti-goat HRP secondary antibody was from Abcam (ab6885). The goat anti-mouse and goat anti-rabbit Alexa Fluor 647 secondary antibodies were from Life Technologies (A21236 and A21245, respectively). The following chemicals were from Sigma-Aldrich: bafilomycin A 1 (B1793); nigericin (N7143); torin2 (SML1224); thapsigargin (T9033), ionomycin (I0634). Apilimod was from Bio Vision (B1129-5). Dextran Alexa Fluor 647 was from Life Technologies ( D22914 ). The ARL8B plasmid [ 35 ] was a kind gift of Dr. Mahak Sharma (Department of Biological Sciences, Indian Institute of Science Education and Research‐Mohali [IISERM], India). RpH-LAMP1-3xFLAG was PCR amplified into the gateway pDONR223 vector (discontinued, Invitrogen) using the BP Clonase II enzyme mix (11789100, Invitrogen), prior to recombination into the pLenti PGK Puro DEST gateway lentiviral vector (Addgene, 19068, E. Campeau) using the LR Clonase II enzyme mix (11791100, Invitrogen) to produce pLenti PGK-Puromycin RpH-LAMP1-3xFLAG. TFEB-mTAGBFP2 was PCR amplified into the gateway pDONR223 vector prior to recombination into the pLenti6.2-ccdB-3xFLAG-V5 gateway lentiviral vector (Addgene, 87071, M. Taipale) to produce pLenti-CMV-Blasticidin TFEB-mTagBFP2. The fluorophore mTSapphire [ 43 ] was codon-optimized and synthesized by IDT-DNA, and subcloned into TFEB plasmid to obtain TFEB-mTSapphire.
Show full methods section
Reagents
Fractionation buffer (pH 7.4) consisted of 50 mM KCl (Sigma-Aldrich, P9333), 1 mM EGTA (Sigma-Aldrich, E3889), 5 mM MgCl 2 (Sigma-Aldrich, M8266), 50 mM sucrose (Sigma-Aldrich, S7903), 20 mM HEPES (Sigma-Aldrich, H3375) pH 7.5, 2.5 mM ATP (Sigma-Aldrich, A2383) and protease inhibitors (Roche, 4693159001). Calibration buffers for measurement of lysosomal pH consisted of 140 mM KCl, 1 mM MgCl 2 , 0.2 mM EGTA, 20 mM HEPES for buffers at pH 7.0–8.0, 20 mM MES (Sigma-Aldrich, M3671) for buffers pH 4–6.5. The following primary antibodies were from Proteintech: RAB5A (11947-1-AP); RPS6KB1/p70 S6K (14485-1-AP); TGOLN2/TGN46 (13573-1-AP). The following primary antibodies were from Abcam: LAMP1 (ab107597, used only for immunofluorescence); LAMP2 (ab25631); GAPDH (ab9485); ATP5 F1B/ATPB (ab14730); ATP6V1A (ab199326); ATP6V1E1 (ab111733); RAB7A (ab137029); GOLGA2/GM130 (ab52649). The following primary antibodies were from Cell Signaling Technologies: EEA1 (C45B10); DYKDDDDK (14793); LAMTOR1 (8975). The anti-RFP primary antibody was from Chromotek (6G6). The anti-HsLAMP1 antibody used for western blot was from BD Biosciences (BD555798). The anti-LC3 primary antibody was from Nanotools (5F10). The anti-CYCS/cytochrome C antibody was from BioLegend (612302). The anti-VPS35 antibody was from Santa Cruz (sc374372). The anti-TFEB and anti-p-RPS6 (Ser233/236) primary antibodies were a generous gift from Prof. Sylvie Urbe and Prof. Michael Clague (Department of Cellular and Molecular Physiology, Institute of Translational Medicine, University of Liverpool, UK). The following secondary antibodies were from Pierce, goat anti-mouse HRP (31430); goat anti-rabbit HRP (31460). The donkey anti-goat HRP secondary antibody was from Abcam (ab6885). The goat anti-mouse and goat anti-rabbit Alexa Fluor 647 secondary antibodies were from Life Technologies (A21236 and A21245, respectively). The following chemicals were from Sigma-Aldrich: bafilomycin A 1 (B1793); nigericin (N7143); torin2 (SML1224); thapsigargin (T9033), ionomycin (I0634). Apilimod was from Bio Vision (B1129-5). Dextran Alexa Fluor 647 was from Life Technologies ( D22914 ). The ARL8B plasmid [ 35 ] was a kind gift of Dr. Mahak Sharma (Department of Biological Sciences, Indian Institute of Science Education and Research‐Mohali [IISERM], India). RpH-LAMP1-3xFLAG was PCR amplified into the gateway pDONR223 vector (discontinued, Invitrogen) using the BP Clonase II enzyme mix (11789100, Invitrogen), prior to recombination into the pLenti PGK Puro DEST gateway lentiviral vector (Addgene, 19068, E. Campeau) using the LR Clonase II enzyme mix (11791100, Invitrogen) to produce pLenti PGK-Puromycin RpH-LAMP1-3xFLAG. TFEB-mTAGBFP2 was PCR amplified into the gateway pDONR223 vector prior to recombination into the pLenti6.2-ccdB-3xFLAG-V5 gateway lentiviral vector (Addgene, 87071, M. Taipale) to produce pLenti-CMV-Blasticidin TFEB-mTagBFP2. The fluorophore mTSapphire [ 43 ] was codon-optimized and synthesized by IDT-DNA, and subcloned into TFEB plasmid to obtain TFEB-mTSapphire.
Generation of lentiviral stable cell-lines
HEK293T (takarabio, 632180) cells were transfected with pLenti PGK-Puromycin RpH-LAMP1-3xFLAG alongside a lentiviral packaging mix consisting of PLP1, PLP2 and VSVG plasmids (Thermo Fisher Scientific, A43237) using Lipofectamine 2000 reagent (Invitrogen, 11668019). At 24 h post-transfection, the media was collected and used to transduce HEK293T cells with the pLenti PGK-Puromycin RpH-LAMP1-3xFLAG virus. Puromycin (Sigma-Aldrich, P8833, 2 μg/ml) was added to the cells 24 h-post-transduction, and media changed every 48 h following this until individual colonies were visible. Colonies were subsequently expanded to generate clonal stable lentiviral cell lines. HEK293T cells stably expressing RpH-LAMP1-3xFLAG were subsequently transduced with pLenti-CMV-Blasticidin TFEB-mTagBFP2 virus. Blasticidin (Millipore, 203350, 10 μg/ml) was added to cells 24 h-post-transduction, and cell lines generated as described.
Cell lysis for western blotting Confluent dishes of HEK293
T cells, HEK293 T cells stably expressing lentiviral RpH-LAMP1-3xFLAG, HeLa cells ± transient transfection with pLenti PGK-Puromycin RpH-LAMP1-3xFLAG and Cos7 cells ± transient transfection with pLenti PGK-Puromycin RpH-LAMP1-3xFLAG plasmid were washed 2 x in ice-cold PBS (Sigma-Aldrich, 11666789001) prior to lysis in RIPA buffer (Sigma-Aldrich, R0278) on ice for 20 min. Cell lysates were centrifuged at 13,500 rpm for 10 min at 4°C and protein concentrations measured prior to analysis. Dynabead cross-linking with anti-Flag Magnetic Dynabeads (Life Technologies, 10004) were incubated with Rabbit anti-FLAG (NEB, 14793S) in PBS-0.01% Tween 20 (Thermo Fisher Scientific, 10485733) rotating for 15 min at room temperature. Dynabeads were then cross-linked with dimethyl pimelimidate (Sigma-Aldrich, D8388) in 0.2 M triethanolamine (Sigma-Aldrich, 90279) pH 8.2 rotating for 30 min at room temperature. The cross-linking reaction was subsequently stopped with 50 mM Tris-HCl (Sigma-Aldrich, T5981) pH 7.5 rotating for 15 min at room temperature.
Isolation of intact lysosomes through immunoprecipitation
Intact lysosomes were isolated from HEK293T cells stably expressing lentiviral RpH-LAMP1-3xFLAG using Magnetic Dynabeads cross-linked with anti-Flag antibody. Confluent 15 cm dishes were washed 3x in ice-cold PBS then frozen at −80°C in 1.25 ml fractionation buffer for 5 min prior to scraping the cells into a glass dounce homogenizer and lysed using 20 strokes. The nuclear fraction was pelleted at 435 x g for 10 min at 4°C. Cytoplasmic fractions were subsequently centrifuged 17,900 x g for 15 min at 4°C to pellet small organelles. The pellet was resuspended in 0.5 ml PBS supplemented with 2.5 mM ATP and protease inhibitors or PBS supplemented with 2.5 mM ATP, 50 mM sucrose and protease inhibitors (indicated in figure) prior to incubation with anti-FLAG magnetic beads for 2 h at 4°C 10 rpm. Beads were then washed 3x in PBS prior to imaging, analysis by western blotting or mass spectrometry.
Imaging of intact lysosomes bound to anti-FLAG magnetic beads
Intact lysosomes were isolated from HEK293 T cells stably expressing lentiviral RpH-LAMP1-3xFLAG using anti-FLAG magnetic beads as described above. Lysosome-bound anti-FLAG magnetic beads were imaged on a Leica LSM-800 confocal microscope using 488 nm and 561 nm lasers and 63x oil objective. Z-stack images were collected at room temperature in fractionation buffer at intervals specified in the figure legends.
Analysis of anti-FLAG magnetic bead-bound lysosomes by western blotting
Following immunoprecipitation, lysosome-bound anti-FLAG magnetic beads were boiled in Laemlli buffer prior to visualization by western blotting. Samples were run on pre-cast 4–20% TGX gels (Bio-Rad, 456–1903), transferred onto nitrocellulose membranes (Sigma, GE10600002), and blocked for 1 h in 5% milk (Marvel, SKU: 5000183932780) at room temperature. The membranes were incubated with primary antibodies (see reagents, above) overnight at 4°C. Following incubation, membranes were then probed with goat anti-rabbit HRP and goat anti-mouse HRP secondary antibodies for 1 h at room temperature prior to visualization using the Bio-Rad ChemiDoc MP imaging system.
Electron microscopy of lysosome-bound anti-FLAG magnetic beads
Lysosomes were isolated using the immunoprecipitation protocol described above. Following immunoprecipitation, beads were fixed in 2.5% glutaraldehyde (Electron Microscopy Services, 16120) in 0.1 M HEPES pH 7.4 for 1 h at room temperature. Beads were then post-fixed in 1% osmium tetroxide (Electron Microscopy Services, 19110), 1.5% potassium ferrocyanide (Electron Microscopy Services, 26603–01) in 0.1 M cacodylate (Electron Microscopy Services, 11654) for 1 h and “en bloc” stained with 0.5% uranyl acetate (Agar Scientific, AGR1260A). Finally, samples were rinsed in dH 2 O, dehydrated with increasing concentrations of ethanol, embedded in Epon (Sigma-Aldrich, 45359–1EA-F) and cured in an oven at 60°C for 48 h. Ultrathin sections (70–90 nm) were obtained using an ultramicrotome (UC7, Leica microsystem, Vienna, Austria), collected, stained with uranyl acetate and Sato’s lead solutions, and observed in a Transmission Electron Microscope (Leo 912AB, Carl Zeiss, Oberkochen, Germany). Digital micrographs were taken with a 2 Kx2K bottom-mounted slow-scan camera (ProScan, Lagerlechfeld, Germany) controlled by the EsivisionPro 3.2 software (Soft Imaging System, Münster, Germany).
Analysis of anti-FLAG magnetic bead-bound lysosomes by Mass spectrometry
Following immunoprecipitation (3 biological replicates per condition), lysosome-bound anti-FLAG magnetic beads were boiled in Laemlli buffer, centrifuged for 5 min and extracted supernatants were run on an SDS polyacrylamide gel for 5 min. Stained proteins were excised, digested and analyzed by mass spectrometry-based proteomics as described previously [ 87 ]. Briefly, IPs were performed in triplicates from untransfected HEK293 cells, stably transduced HEK293 cells expressing RpH-LAMP1-3xFLAG, untransfected control cells treated with chloroquine and stably transduced HEK293 cells expressing RpH-LAMP1-3xFLAG treated with chloroquine. In addition, total cell lysates of untransfected HEK293 T cells were prepared by the filter aided sample preparation method [ 88 ]. The resulting MS and MS/MS spectra were analyzed using MaxQuant (version 1.6.0.13, www.maxquant.org/ [ 89 , 90 ], as described previously [ 91 ] using its incorporated label-free quantification tool [ 92 ]. First, proteins precipitated from RpH-LAMP1-3xFLAG cells were compared to the total proteome of HEK293T cells. Next, IPs from HEK293T cells and HEK293T cells expressing RpH-LAMP1-3xFLAG were compared. Similarly, HEK293T cells and HEK293T cells expressing RpH-LAMP1-3xFLAG, both treated with chloroquine were compared. Finally, the IPS from untreated and chloroquine-treated HEK293T cells expressing RpH-LAMP1-3xFLAG were compared. Only proteins that were specific outliers in the previous two experiments were labeled in these plots. The methods are described in detail in [ 93 ]. All calculations and plots were performed with the R software package ( www.r-project.org/ ; RRID:SCR_001905) and the protocol for label-free proteomics [ 93 ]. Stimulation of lysosomal stress treatments Stable HEK293T and lipofectamine transfected Cos7 lentiviral cell-lines expressing RpH-LAMP1-3xFLAG were seeded onto glass-bottom imaging dishes at the desired density for each experiment. 24 h post-seeding, cells were treated under one of the following conditions: 90 mM sucrose 4 h; 20 nM apilimod 3 h; 100 μM chloroquine 5 h; 250 nM torin2 2 h; 100 nM bafilomycin A1 plus 10 μM nigericin 30 min. Following treatment, cells were immediately imaged at room temperature in imaging buffer (Life Technologies) on a Leica LSM-800 confocal microscope using 488 nm and 561 nm lasers and 63x oil objective. Amino acid starvation experiments Amino acid-free medium (Stratech, D9800-13-USB) was reconstituted from powder and buffered at pH 7.4. Before addition to cells, starvation medium was warmed and normalized 10 min in the incubator. At the microscope, normal culture media was replaced with the warmed medium. HEK293T RpH-LAMP1-3xFLAG cells expressing transfected TFEB-mTSapphire were imaged using on a Zeiss LSM800 in an environmental chamber with 5% CO 2 at 37°C.
TIRF microscopy
Observation of HEK293T stable cells and HeLa cells transiently expressing RpH-LAMP1-3xFLAG by total internal reflection fluorescence (TIRFM) microscopy [ 94 ]. We have used multicolor total internal reflection fluorescence microscopy (TIRFM). Cells were imaged at 37°C/5% CO 2 by TIRFM using a Leica DMi8 with Andor Dragonfly inverted microscope fitted with a 60 × 1.45 N.A. TIRFM Dragonfly was controlled by Andor software (Andor Technologies, Belfast, Ireland). The calculated evanescent field depth was ≈ 60–100 nm, automatically set by the microscope.
Immunocytochemistry Stable HEK293T lentiviral cell-lines expressing
RpH-LAMP1-3xFLAG were fixed in 4% PFA and 4% sucrose in PBS and permeabilized with 0.1% Triton X-100 (Sigma-Aldrich, X100) for 20 min. Samples were blocked in 0.1% BSA (Sigma-Aldrich, A7906) for 1 h at room temperature prior to incubation with primary antibody overnight at 4°C. Samples were then incubated with goat anti-mouse Alexa-Fluor-647 secondary antibodies for 1 h at room temperature. Samples were mounted using ProLong Gold Antifade reagent (Life Technologies, P36930 ) prior to imaging on Leica LSM-800 confocal microscope using 488 nm, 561 nm and 647 nm lasers and 63x objective. Nuclei were stained using DAPI (Sigma, D9542) (1:2000) Dextran lysosomal marker Stable HEK293T lentiviral cell-line expressing RpH-LAMP1-3xFLAG and untransduced HEK293T cells were seeded as a co-culture onto glass-bottom imaging dishes at the desired density for each experiment. 24 h post-seeding, cells were loaded with 20 μg/ml Alexa Fluor 647-Dextran (Thermo Fisher Scientific, D22914 ) for 16 h to label all lysosomes at 37°C 5% CO 2 , and chased for 3 h the following day at 37°C 5% CO 2 prior to live-cell imaging on a Leica LSM-800 confocal microscope using 488 nm, 561 nm and 647 nm lasers and 63x oil objective. CTSB activity label Stable HEK293T lentiviral cell-line expressing RpH-LAMP1-3xFLAG and untransduced HEK293T cells were seeded as a co-culture onto glass-bottom imaging dishes at the desired density for each experiment. 24 h post-seeding, cells were loaded overnight with CATB FAST 680 (Perkin-Elmer, NEV11112, 1 μM) to label all lysosomes at 37°C 5% CO 2 , prior to live-cell imaging.
Chick neuron preparation and transfection
Dissociated chick mixed hippocampal-cortex neurons were prepared from brain of chick embryos (E8) similarly as described previously for mouse neurons preparation [ 95 ] and following surgery and cell preparation according to published methods [ 96 ]. Briefly: we used fertilized eggs from white leghorn chicken ( Gallus domesticus ). The eggs were incubated in the laboratory using an egg incubator (Rcom MARU Deluxe MAX) for 8 d at 45% humidity, 37 ± 1°C. Mixed hippocampi-cortex were isolated from eggs (E8). First, the chorioallantoic membrane was gently cut. The embryo was extracted and the head was isolated. The developing calvarium was removed, followed by the separation of the two hemispheres from the rest of the brain, and finally, the meninges were completely peeled off. The clean hemispheres are fragmented, dispersed mechanically and seeded in culture dishes at 0.4 × 10 6 cells/ml density. The imaging dishes were pre-treated with poly-D-lysine (Sigma-Aldrich, A-003-M, 0.1 mg/ml). The cells were cultured in neurobasal medium (Gibco, 21103049) supplemented with 2% B-27 supplement (Gibco, 17504044) and 0.5% fetal bovine serum (Invitrogen, 10270106). Transfection was performed using electroporation at the time of dissociation using an Amaxa Nucleofector system, following the manufacturer’s instructions that suggest the use of program O-003 for chicks. The average transfection efficiency was from 40 to 60%, and the majority of transfected neurons showed plasmid expression from day 3–5 until around 14 d in culture. Measurement of lysosomal pH, dynamics and size Lysosomal pH measurements were performed on cells and isolated lysosomes on beads through ratiometric imaging of the mCherry and pHluorin fluorophores. mCherry and pHluorin fluorophores were excited at 561 nm and 488 nm, respectively and both channels acquired simultaneously to minimize misalignment between channels. Calibration curves were performed on both fixed and permeabilized cells and on live, bafilomycin A1-treated and nigericin-permeabilized cells by incubating cells with calibration solutions ranging from pH 4–8 as previously described [ 97 ]. Images were analyzed as described in the graphical workflow in Fig. S1 C . For live-cell imaging, calibration solutions were supplemented with 100 nM bafilomycin A 1 and 10 μM nigericin. Ratiometric calculations were performed using Matlab.
Measurement of central and peripheral lysosome pH
The outer boundaries of HEK293T cells stably expressing RpH-LAMP1-3xFLAG were determined using the pHluorin channel fluorescence at the cell surface. Central/peripheral boundaries drawn by hand in ImageJ (NIH, Public Domain license) at the half-way point between the nucleus and cell membrane. pH was analyzed in Matlab as described. Ratiometric calculations and standard curve Raw fluorescence data in nigericin plus bafilomycin A1-treated cells was acquired for each cell line, in calibrated imaging buffers as previously described [ 98 ]. Non-linear fitting of average pixel intensities per object was done according to a standard Boltzmann equation [ 99–101 ] shown in Eq1 below, as previously used for cytoplasmic EGFP-mRFP tandem [ 99 ] and lysosomal chemical fluorophores [ 102 ]: (0.1) R { P H / C H } ( p H ) = R min + R max − R min 1 + e p k a − p H S l o p e Where R is the ratio at the variation of pH, and R max and R min are maximum and minimum ratio range obtainable at either alkaline or acidic pH. To measure pKa of our probe in cell lines, we solved (1.2) below, fitting the raw data from our standardized curves. Once pKa was established, this equation was used to calculate pH from the raw ratiometric data acquired. (0.2) p H ( R { P H / C H } ) = p K a − S l o p e ∗ ln ( − R max − R { P H / C H } R min − R { P H / C H } ) Statistical analyses For western blotting, all data points represent the mean of at least 2, but often 3 independent biological replicates. Error bars represent standard deviation unless otherwise stated. For images, typically at least 6–8 fields of view were analyzed from at least 3 independent experiments (unless otherwise stated); the data indicate average and the error bars represent the standard error of the mean. For pairwise comparisons, P-values were determined using Student´s t-test, otherwise, one-sided ANOVA was employed.
Supplementary Material Supplemental Material Click here for additional data file.
Supplementary material Supplemental data for this article can be accessed here .
📊 Figures
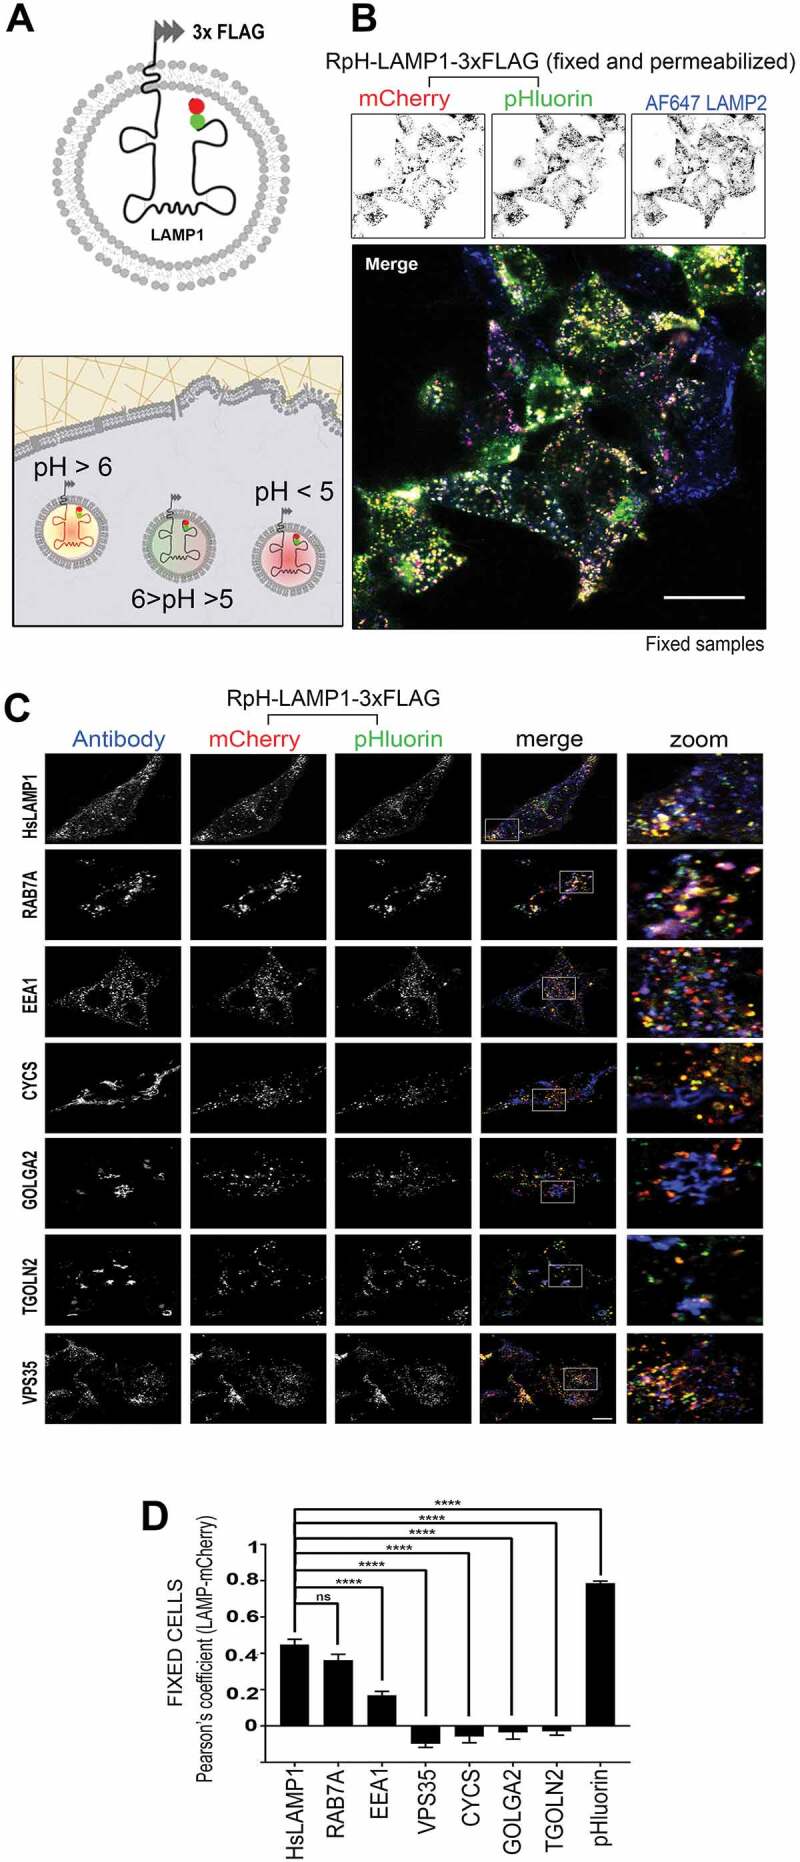
Figure 1.
Design and expression of RpH-LAMP1-3xFLAG. (A) Topology of the probe with luminal Cherry-pHluorin tandem and cytosolic 3xFLAG tag. (B) A mixed culture of lentivirally transduced RpH-LAMP1-3xFLAG HEK29...
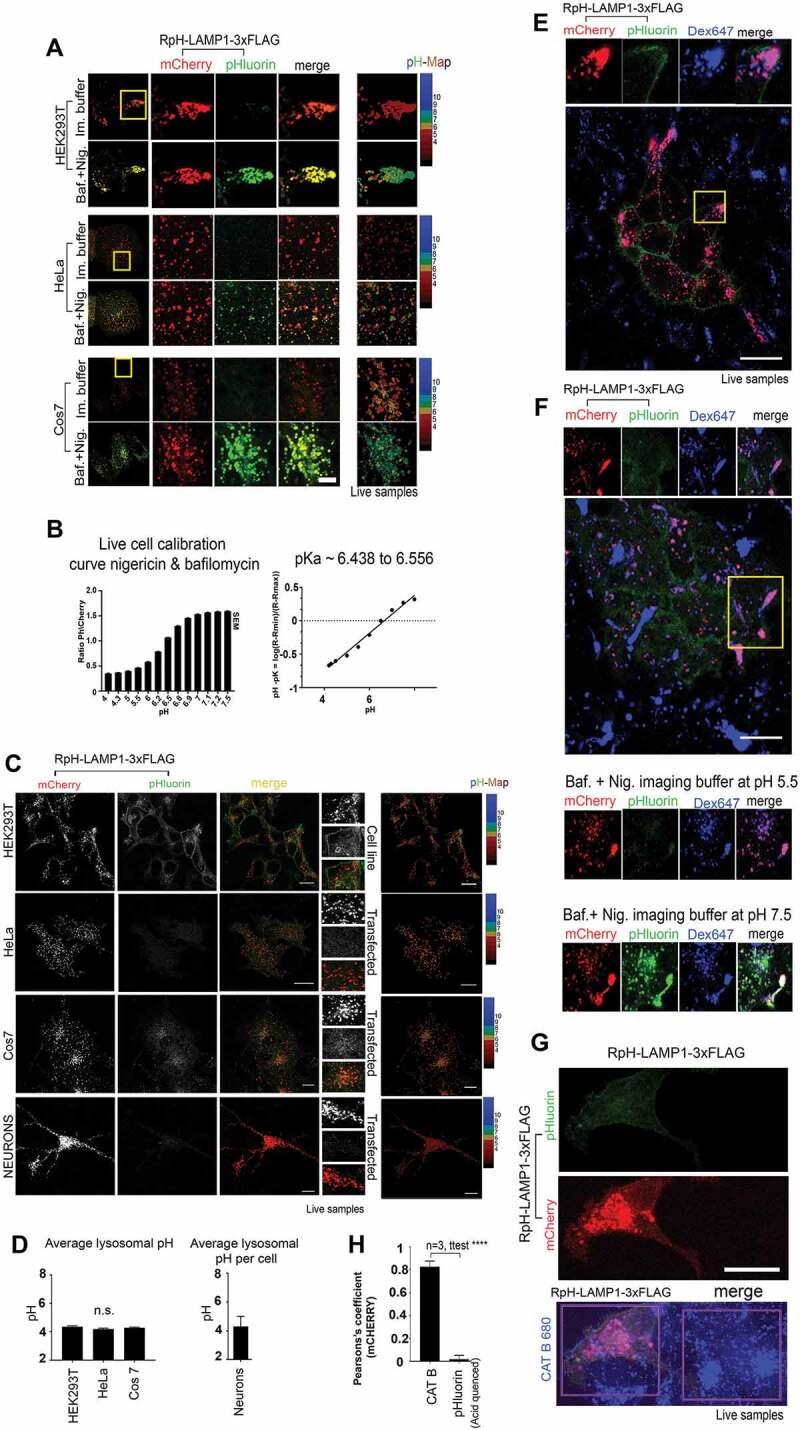
Figure 2.
RpH-LAMP1-3xFLAG revealed stably acidic lysosomal pH in live-cell imaging. (A) RpH-LAMP1-3xFLAG expressed in HEK293T, HeLa and Cos7 cells showed the probe was found in acidic organelles (i.e., pHluori...
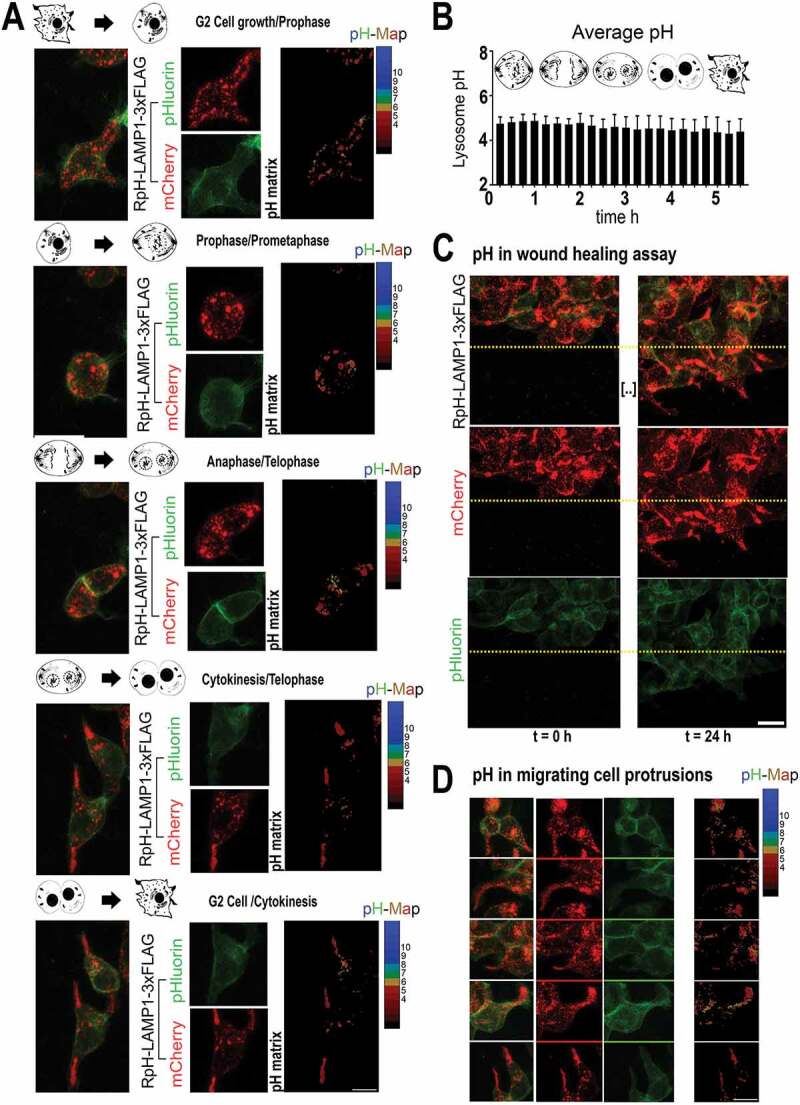
Figure 3.
Lysosomal pH remained stable through cell cycle and cell migration. (A) RpH-LAMP1-3xFLAG in HEK293T cells undergoing spontaneous cell division (see Movie S6 ). Maximum projection of an image stack per...
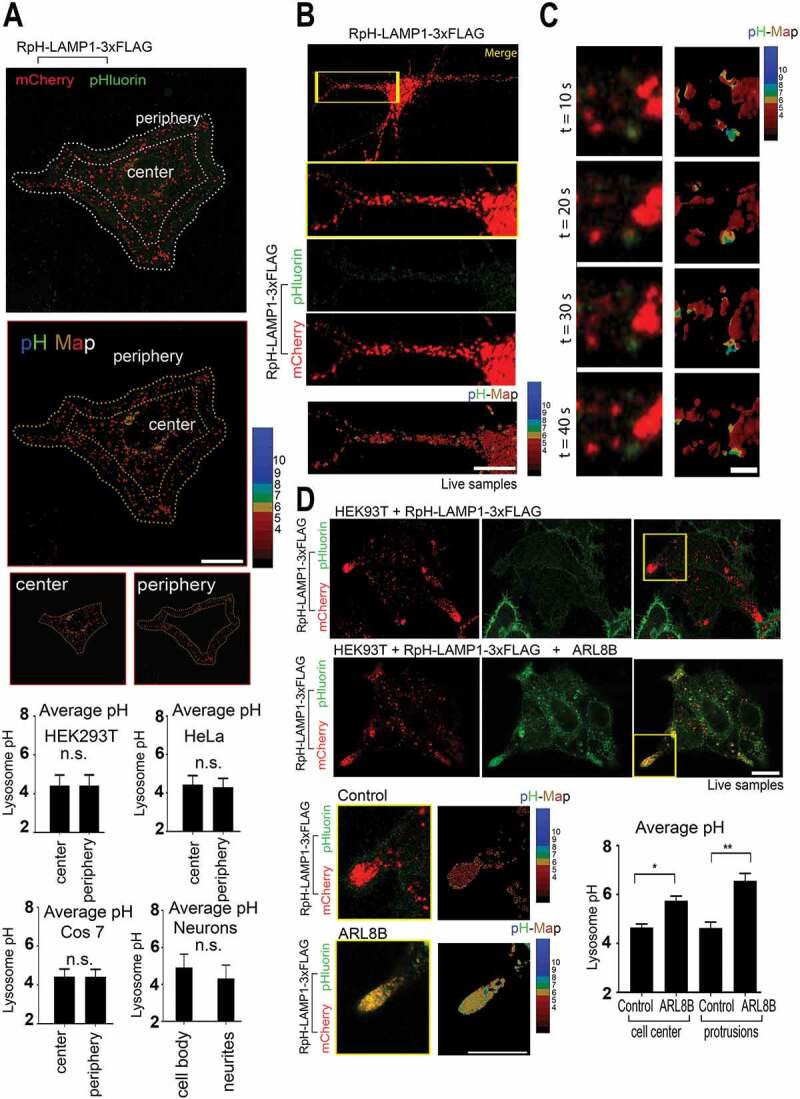
Figure 4.
ARL8B overexpression markedly alkalinized lysosomes, but peripheral localization did not confer a similar effect on pH. (A) Peripheral vs central puncta quantified for HEK293T, HeLa, Cos7 and neurons ...
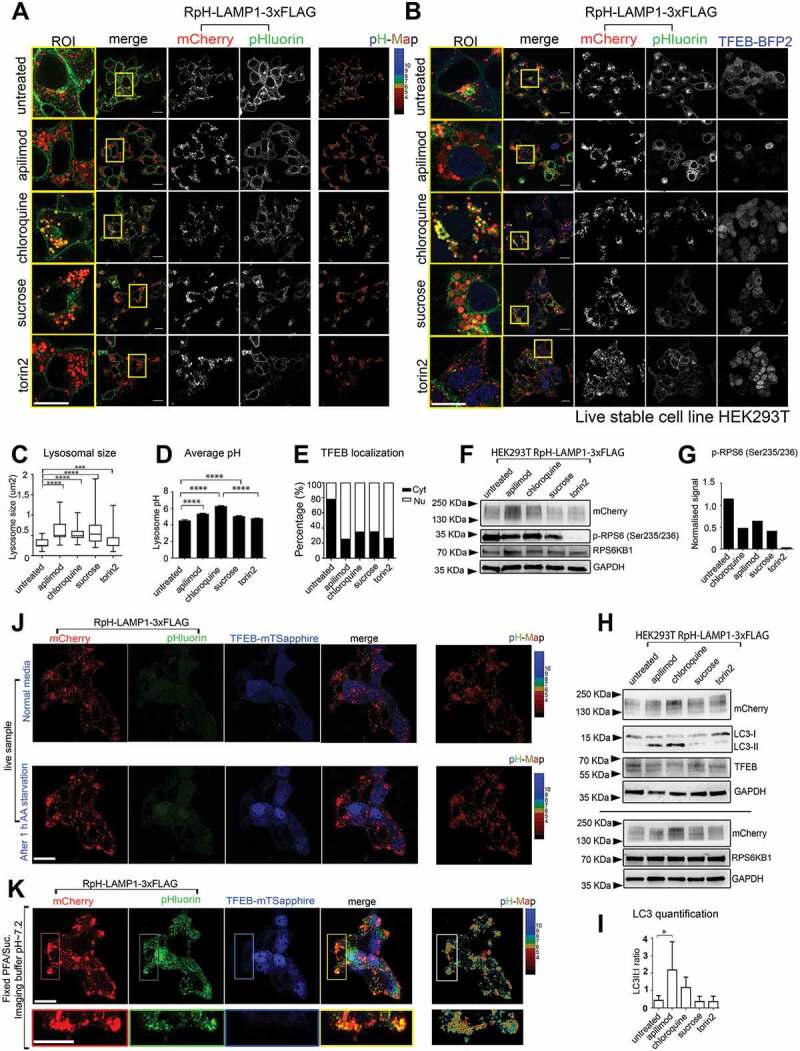
Figure 5.
Pharmacological treatment with lysosomal stressors in HEK293T cells. (A) Treatment with apilimod (3u00a0h, 20u00a0nM), chloroquine (5u00a0h, 100u00a0u03bcM), sucrose (4u00a0h, 90u00a0mM), and torin2 (...
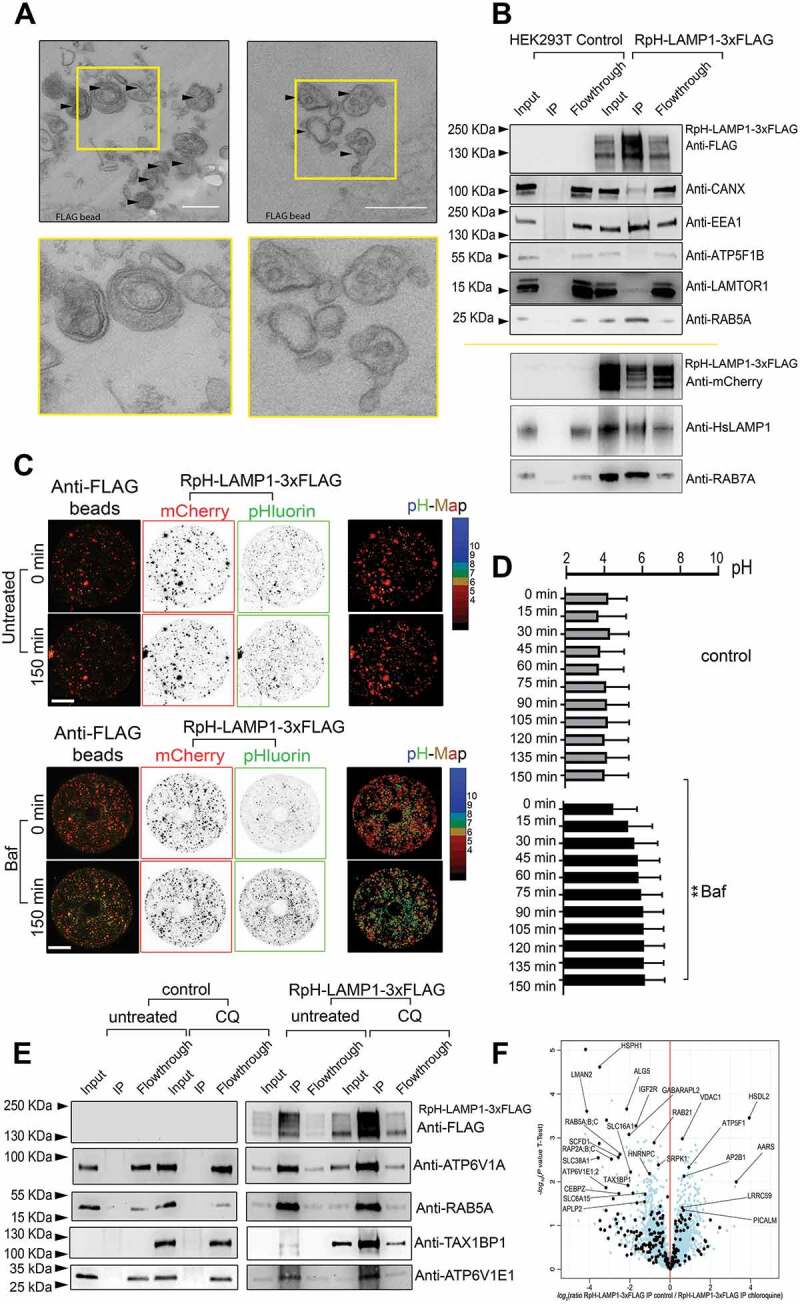
Figure 6.
Immunopurification of functional RpH-LAMP1-3xFLAG lysosomes. Stable cell lines expressing RpH-LAMP1-3xFLAG were flash-frozen and cytosolic membranes harvested, pelleted and the pellet fraction immunop...
Figure images are served from the NIH/NLM PubMed Central Open Access Subset or Europe PMC; copyright remains with the publishers and authors.
💬 Discussion
0 commentsNo comments yet. Be the first to start a discussion!
Leave a Comment