Abstract
Recent observations using multiphoton intravital microscopy (MP-IVM) have uncovered an unexpectedly high lymphocyte motility within peripheral lymph nodes (PLNs). Lymphocyte-expressed intracellular signaling molecules governing interstitial movement remain largely unknown. Here, we used MP-IVM of murine PLNs to examine interstitial motility of lymphocytes lacking the Rac guanine exchange factor DOCK2 and phosphoinositide-3-kinase (PI3K)gamma, signaling molecules that act downstream of G protein-coupled receptors, including chemokine receptors (CKRs). T and B cells lacking DOCK2 alone or DOCK2 and PI3Kgamma displayed markedly reduced motility inside T cell area and B cell follicle, respectively. Lack of PI3Kgamma alone had no effect on migration velocity but resulted in increased turning angles of T cells. As lymphocyte egress from PLNs requires the sphingosine-1-phosphate (S1P) receptor 1, a G(alphai) protein-coupled receptor similar to CKR, we further analyzed whether DOCK2 and PI3Kgamma contributed to S1P-triggered signaling events. S1P-induced cell migration was significantly reduced in T and B cells lacking DOCK2, whereas T cell-expressed PI3Kgamma contributed to F-actin polymerization and protein kinase B phosphorylation but not migration. These findings correlated with delayed lymphocyte egress from PLNs in the absence of DOCK2 but not PI3Kgamma, and a markedly reduced cell motility of DOCK2-deficient T cells in close proximity to efferent lymphatic vessels. In summary, our data support a central role for DOCK2, and to a lesser extent T cell-expressed PI3Kgamma, for signal transduction during interstitial lymphocyte migration and S1P-mediated egress.
🔬 Techniques
🔭 Microscopes
🧬 Organisms
💻 Software
✨ Fluorophores
🧪 Sample Preparation
🔬 Cell Lines
🏭 Microscope Brands
🧪 Reagent Suppliers
🔴 Lasers
🎨 Filters
💻 Software Details
💾 Data Repositories
🏛️ Research Organizations (ROR)
Affiliated research institutions:
📋 Methods
Reagents and mice. AMCA-conjugated anti–rat IgM and Alexa350-conjugated anti–rabbit Ig were from Jackson ImmunoResearch Laboratories. Anti–LYVE-1 was purchased from RELIATech. Anti–mouse S1P 1 polyclonal rabbit Ig directed against the N and C terminus was provided by S. Mandala and E.J. Quackenbush (Merck Research Laboratories, Rahway, NJ). All other antibodies were from BD Biosciences or affinity purified from hybridoma supernatant (Mel-14; Nanotools). S1P and human collagen type IV were purchased from Sigma-Aldrich. CMTMR (CellTracker orange), CMFDA (CellTracker green), and CFSE were from Invitrogen. SEW2871 was from Calbiochem. 6–12-wk-old control, DOCK2 −/− , PI3Kγ −/− , and DOCK2 −/− × PI3Kγ −/− mice in a C57BL/6 background were used for all experiments. CD45.1 + C57BL/6 used in some reconstitution experiments were from The Jackson Laboratory. All experiments were performed in accordance with National Institutes of Health (NIH) guidelines and approved by the Committees on Animal Care and Use of Harvard Medical School, the CBR Institute for Biomedical Research, and the Kanton of Bern. MP-IVM of popliteal PLNs. Single cell suspensions were obtained from the PLNs, mesenteric lymph nodes, and spleens of control and genetically deficient mice. Alternatively, in some experiments (control and PI3Kγ −/− T cells, and control, DOCK2 −/− , PI3Kγ −/− , and DOCK2 −/− × PI3Kγ −/− B cells), cells were isolated from irradiated CD45.1 + mice reconstituted with CD45.2 + bone marrow cells from control, DOCK2 −/− , PI3Kγ −/− , and DOCK2 −/− × PI3Kγ −/− mice, respectively. When required, endogenous CD45.1 + cells were eliminated by negative selection with anti-CD45.1–coated magnetic beads (Miltenyi Biotec). In all experiments, T and B cell isolation was performed by negative immunomagnetic cell sorting (Miltenyi Biotec) with purity yields of >95% for T cells and >90% for B cells. Purified control, DOCK2 −/− , PI3Kγ −/− , or DOCK2 −/− × PI3Kγ −/− T or B cells were fluorescently labeled with 5 μM CFSE or 10 μM CMTMR for 15 min at 37°C, washed, and injected i.v. into sex-matched 6-wk-old C57BL/6 recipient mice. Numbers of transferred lymphocytes (2–10 × 10 6 cells) were calculated according to the homing ability of each subset to allow sufficient accumulation of cells inside the node for visualization. When we checked the phenotype of control and DOCK2-deficient adoptively transferred T or B lymphocytes by flow cytometry, we found that >99% of transferred cells in PLNs were either Thy1.2 + or B220 + , with >70% corresponding to bona fide naive lymphocytes (Fig. S1). 15–22 h after transfer, recipient mice were anesthetized and the right popliteal lymph node was surgically exposed, as described previously ( 33 ). Multiphoton imaging was performed with an Olympus BX50WI fluorescence microscope equipped with a 20× objective and a Bio-Rad Radiance 2000 MP Confocal/Multiphoton microscopy system, controlled by Lasersharp software (Bio-Rad Laboratories). For multiphoton excitation and second harmonic generation, a Ti:sapphire laser with a 10-W MilleniaXs pump laser (Tsunami; Spectra-Physics) was tuned to 800 nm. For four-dimensional analysis of cell migration, stacks of 16 square x-y sections were acquired every 15 s during 30 min with electronic zooming up to 6× to provide image volumes of 60 μm in depth. Emitted light and second harmonic signals were detected through 400/40-nm, 525/50-nm, and 620/100-nm bandpass filters with nondescanned detectors to generate three-color images. Sequences of image stacks were transformed into volume-rendered four-dimensional movies using Volocity software (Improvision), which was also used for semi-automated tracking of cell motility in three dimensions. From x, y, and z coordinates of cell centroids, parameters of cellular motility were calculated as described previously ( 33 ). In brief, the instantaneous three-dimensional velocity is the cellular velocity between two time points, whereas the turning angle describes the angle between the two velocity vectors before and after a measurement time point ( 12 ). Both parameters are determined independently for each cell track. S1P-induced PKB and ERK phosphorylation, F-actin polymerization, and migration. Lymphocyte isolation and functional experiments were performed in RPMI supplemented with 1 mg/ml of fatty acid–free BSA, L-Gln, NaPyruvate, β-mercaptoethanol, and PenStrep (RPMI-BSA). After o.n. incubation in RPMI-BSA at 37°C, 7% CO 2 , lymphocytes were stimulated with 500 nM S1P or 100 nM CXCL12, permeabilized, and incubated with anti-phosphoPKB or anti-phosphoErk (Cell Signaling Laboratories). As secondary antibodies, we used biotinylated anti–rabbit IgG (Jackson ImmunoResearch Laboratories), followed by APC-conjugated streptavidin (BD Biosciences). Comparable results were obtained using Western blot analysis (unpublished data). Actin polymerization assays were performed as described previously ( 31 ). In brief, single cell suspensions of total lymphocytes (10 7 cells/ml) were stimulated with 500 nM S1P, and aliquots were taken at indicated time points, followed by immediate fixation in 4% paraformaldehyde for 15 min. Cells were washed with PBS and stained for Thy1.2 + and B220 + cells, permeabilized, labeled with FITC-Phalloidin (Invitrogen), and analyzed by flow cytometry using CELLQuest software (Becton Dickinson). In some experiments, lymphocytes were treated with 0.1 μg/ml pertussis toxin (Sigma-Aldrich), 0.5 μM Wortmannin (Calbiochem), 5 μM SEW2871, or 0.5 μM FTY720 or FTY720-P (provided by V. Brinkmann, Novartis, Basel, Switzerland, and S. Mandala and E.J. Quackenbush, respectively) for 15 min or 2 h at 37°C, 7% CO 2 , before S1P stimulation. Chemotaxis assays were performed using Transwell chambers (5-μm pore size; CoStar). Filters were coated o.n. at 4°C with a 10 μg/ml solution of human collagen type IV, washed twice with 500 μl PBS, and dried before use. Uncoated filter inserts were used with comparable results. 10 6 lymphocytes in 100 μl RPMI-BSA was placed in the top chamber and allowed to migrate to 25 nM S1P for 4 h at 37°C, 7% CO 2 . This concentration was found to be optimal for both control and DOCK2 −/− lymphocytes over a range from 10 nM to 1 μM S1P (unpublished data). The percentage of total migrated cells was determined by flow cytometry comparing with a precalibrated bead standard (Sigma-Aldrich). After migration, input and migrated populations were labeled for T and B cells to calculate percentages of subset migration. Determination of S1P 1 mRNA levels and surface expression. Total RNA was isolated from freshly isolated CD4 + T cells according to the manufacturer's instructions (QIAGEN). Quantitative RT-PCR was performed using the universal probe library system (Roche Applied Science). For S1P 1 surface labeling, lymphocytes were incubated o.n. in RPMI-BSA and labeled with anti–mouse N-terminal S1P 1 -specific rabbit Ig, followed by biotinylated anti–rabbit Ig and streptavidin-APC. As controls, we used C-terminal S1P 1 or S1P 4 -specific rabbit Ig and FTY720-P pretreatment. Lymph node egress assays. Total lymphocytes were isolated from the spleens and PLNs of control and genetically deficient mice and fluorescently labeled using 0.3 μM CMFDA or 1.5 μM CMTMR for 45 min, 5% CO 2 , 37°C in RPMI supplemented with 10% FCS, L-Gln, NaPyruvate, β-mercaptoethanol, and PenStrep (CM-R). Depending on the homing ability of different subsets, 2–4 × 10 7 cells of each cell population were mixed in 200 μl CM-R and injected i.v into age- and sex-matched C57BL/6 recipient mice. 4 or 20 h after lymphocyte transfer, mice received i.v. injections of Mel-14 (100 μg/mouse) to prevent further homing. Mice were killed 2, 12, and 24 h after mAb injection for assessment of the rate of egress of injected lymphocytes from PLNs. SLOs and blood were collected, labeled with anti-Thy1.2 and anti-B220, and the numbers of adoptively transferred T and B cells were determined using flow cytometry. For each organ, absolute numbers of each lymphocyte subset were calculated by using a precalibrated bead standard. A lymph node retention ratio was determined for each time point as the ratio of (percent recovered gene-deficient lymphocytes/percent recovered control lymphocytes) × correction factor for the input population ratio, as described previously ( 31 ). One lymph node from each mouse was snap frozen for immunohistological analysis. Immunohistology. 8-μm sections of frozen PLNs were fixed for 10 min in 2% paraformaldehyde, washed in PBS, blocked with FCS, and stained with anti-PNAd (MECA-79) or anti–LYVE-1 antibody. AMCA-conjugated anti–rat IgM or Alexa350-conjugated anti–rabbit Ig were used as secondary antibody. Preparations were observed using a fluorescence microscope (Nikon). For determination of cell distribution, adoptively transferred lymphocytes were considered close to LYVE-1 + structures at a distance of
Show full methods section
Reagents and mice. AMCA-conjugated anti–rat IgM and Alexa350-conjugated anti–rabbit Ig were from Jackson ImmunoResearch Laboratories. Anti–LYVE-1 was purchased from RELIATech. Anti–mouse S1P 1 polyclonal rabbit Ig directed against the N and C terminus was provided by S. Mandala and E.J. Quackenbush (Merck Research Laboratories, Rahway, NJ). All other antibodies were from BD Biosciences or affinity purified from hybridoma supernatant (Mel-14; Nanotools). S1P and human collagen type IV were purchased from Sigma-Aldrich. CMTMR (CellTracker orange), CMFDA (CellTracker green), and CFSE were from Invitrogen. SEW2871 was from Calbiochem. 6–12-wk-old control, DOCK2 −/− , PI3Kγ −/− , and DOCK2 −/− × PI3Kγ −/− mice in a C57BL/6 background were used for all experiments. CD45.1 + C57BL/6 used in some reconstitution experiments were from The Jackson Laboratory. All experiments were performed in accordance with National Institutes of Health (NIH) guidelines and approved by the Committees on Animal Care and Use of Harvard Medical School, the CBR Institute for Biomedical Research, and the Kanton of Bern. MP-IVM of popliteal PLNs. Single cell suspensions were obtained from the PLNs, mesenteric lymph nodes, and spleens of control and genetically deficient mice. Alternatively, in some experiments (control and PI3Kγ −/− T cells, and control, DOCK2 −/− , PI3Kγ −/− , and DOCK2 −/− × PI3Kγ −/− B cells), cells were isolated from irradiated CD45.1 + mice reconstituted with CD45.2 + bone marrow cells from control, DOCK2 −/− , PI3Kγ −/− , and DOCK2 −/− × PI3Kγ −/− mice, respectively. When required, endogenous CD45.1 + cells were eliminated by negative selection with anti-CD45.1–coated magnetic beads (Miltenyi Biotec). In all experiments, T and B cell isolation was performed by negative immunomagnetic cell sorting (Miltenyi Biotec) with purity yields of >95% for T cells and >90% for B cells. Purified control, DOCK2 −/− , PI3Kγ −/− , or DOCK2 −/− × PI3Kγ −/− T or B cells were fluorescently labeled with 5 μM CFSE or 10 μM CMTMR for 15 min at 37°C, washed, and injected i.v. into sex-matched 6-wk-old C57BL/6 recipient mice. Numbers of transferred lymphocytes (2–10 × 10 6 cells) were calculated according to the homing ability of each subset to allow sufficient accumulation of cells inside the node for visualization. When we checked the phenotype of control and DOCK2-deficient adoptively transferred T or B lymphocytes by flow cytometry, we found that >99% of transferred cells in PLNs were either Thy1.2 + or B220 + , with >70% corresponding to bona fide naive lymphocytes (Fig. S1). 15–22 h after transfer, recipient mice were anesthetized and the right popliteal lymph node was surgically exposed, as described previously ( 33 ). Multiphoton imaging was performed with an Olympus BX50WI fluorescence microscope equipped with a 20× objective and a Bio-Rad Radiance 2000 MP Confocal/Multiphoton microscopy system, controlled by Lasersharp software (Bio-Rad Laboratories). For multiphoton excitation and second harmonic generation, a Ti:sapphire laser with a 10-W MilleniaXs pump laser (Tsunami; Spectra-Physics) was tuned to 800 nm. For four-dimensional analysis of cell migration, stacks of 16 square x-y sections were acquired every 15 s during 30 min with electronic zooming up to 6× to provide image volumes of 60 μm in depth. Emitted light and second harmonic signals were detected through 400/40-nm, 525/50-nm, and 620/100-nm bandpass filters with nondescanned detectors to generate three-color images. Sequences of image stacks were transformed into volume-rendered four-dimensional movies using Volocity software (Improvision), which was also used for semi-automated tracking of cell motility in three dimensions. From x, y, and z coordinates of cell centroids, parameters of cellular motility were calculated as described previously ( 33 ). In brief, the instantaneous three-dimensional velocity is the cellular velocity between two time points, whereas the turning angle describes the angle between the two velocity vectors before and after a measurement time point ( 12 ). Both parameters are determined independently for each cell track. S1P-induced PKB and ERK phosphorylation, F-actin polymerization, and migration. Lymphocyte isolation and functional experiments were performed in RPMI supplemented with 1 mg/ml of fatty acid–free BSA, L-Gln, NaPyruvate, β-mercaptoethanol, and PenStrep (RPMI-BSA). After o.n. incubation in RPMI-BSA at 37°C, 7% CO 2 , lymphocytes were stimulated with 500 nM S1P or 100 nM CXCL12, permeabilized, and incubated with anti-phosphoPKB or anti-phosphoErk (Cell Signaling Laboratories). As secondary antibodies, we used biotinylated anti–rabbit IgG (Jackson ImmunoResearch Laboratories), followed by APC-conjugated streptavidin (BD Biosciences). Comparable results were obtained using Western blot analysis (unpublished data). Actin polymerization assays were performed as described previously ( 31 ). In brief, single cell suspensions of total lymphocytes (10 7 cells/ml) were stimulated with 500 nM S1P, and aliquots were taken at indicated time points, followed by immediate fixation in 4% paraformaldehyde for 15 min. Cells were washed with PBS and stained for Thy1.2 + and B220 + cells, permeabilized, labeled with FITC-Phalloidin (Invitrogen), and analyzed by flow cytometry using CELLQuest software (Becton Dickinson). In some experiments, lymphocytes were treated with 0.1 μg/ml pertussis toxin (Sigma-Aldrich), 0.5 μM Wortmannin (Calbiochem), 5 μM SEW2871, or 0.5 μM FTY720 or FTY720-P (provided by V. Brinkmann, Novartis, Basel, Switzerland, and S. Mandala and E.J. Quackenbush, respectively) for 15 min or 2 h at 37°C, 7% CO 2 , before S1P stimulation. Chemotaxis assays were performed using Transwell chambers (5-μm pore size; CoStar). Filters were coated o.n. at 4°C with a 10 μg/ml solution of human collagen type IV, washed twice with 500 μl PBS, and dried before use. Uncoated filter inserts were used with comparable results. 10 6 lymphocytes in 100 μl RPMI-BSA was placed in the top chamber and allowed to migrate to 25 nM S1P for 4 h at 37°C, 7% CO 2 . This concentration was found to be optimal for both control and DOCK2 −/− lymphocytes over a range from 10 nM to 1 μM S1P (unpublished data). The percentage of total migrated cells was determined by flow cytometry comparing with a precalibrated bead standard (Sigma-Aldrich). After migration, input and migrated populations were labeled for T and B cells to calculate percentages of subset migration. Determination of S1P 1 mRNA levels and surface expression. Total RNA was isolated from freshly isolated CD4 + T cells according to the manufacturer's instructions (QIAGEN). Quantitative RT-PCR was performed using the universal probe library system (Roche Applied Science). For S1P 1 surface labeling, lymphocytes were incubated o.n. in RPMI-BSA and labeled with anti–mouse N-terminal S1P 1 -specific rabbit Ig, followed by biotinylated anti–rabbit Ig and streptavidin-APC. As controls, we used C-terminal S1P 1 or S1P 4 -specific rabbit Ig and FTY720-P pretreatment. Lymph node egress assays. Total lymphocytes were isolated from the spleens and PLNs of control and genetically deficient mice and fluorescently labeled using 0.3 μM CMFDA or 1.5 μM CMTMR for 45 min, 5% CO 2 , 37°C in RPMI supplemented with 10% FCS, L-Gln, NaPyruvate, β-mercaptoethanol, and PenStrep (CM-R). Depending on the homing ability of different subsets, 2–4 × 10 7 cells of each cell population were mixed in 200 μl CM-R and injected i.v into age- and sex-matched C57BL/6 recipient mice. 4 or 20 h after lymphocyte transfer, mice received i.v. injections of Mel-14 (100 μg/mouse) to prevent further homing. Mice were killed 2, 12, and 24 h after mAb injection for assessment of the rate of egress of injected lymphocytes from PLNs. SLOs and blood were collected, labeled with anti-Thy1.2 and anti-B220, and the numbers of adoptively transferred T and B cells were determined using flow cytometry. For each organ, absolute numbers of each lymphocyte subset were calculated by using a precalibrated bead standard. A lymph node retention ratio was determined for each time point as the ratio of (percent recovered gene-deficient lymphocytes/percent recovered control lymphocytes) × correction factor for the input population ratio, as described previously ( 31 ). One lymph node from each mouse was snap frozen for immunohistological analysis. Immunohistology. 8-μm sections of frozen PLNs were fixed for 10 min in 2% paraformaldehyde, washed in PBS, blocked with FCS, and stained with anti-PNAd (MECA-79) or anti–LYVE-1 antibody. AMCA-conjugated anti–rat IgM or Alexa350-conjugated anti–rabbit Ig were used as secondary antibody. Preparations were observed using a fluorescence microscope (Nikon). For determination of cell distribution, adoptively transferred lymphocytes were considered close to LYVE-1 + structures at a distance of
📊 Figures
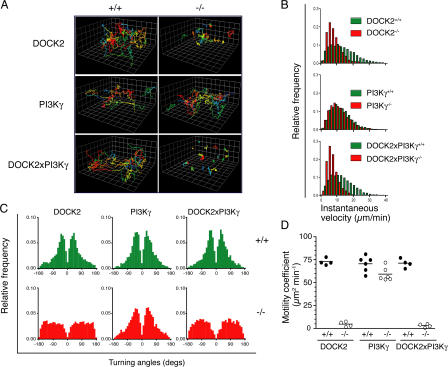
Figure 1.
Paracortical T cell migration in the absence of DOCK2 and PI3Ku03b3. Fluorescently labeled control T cells and DOCK2 u2212/u2212 , PI3Ku03b3 u2212/u2212 , or DOCK2 u2212/u2212 u00d7 PI3Ku03b3 u2212/u2...
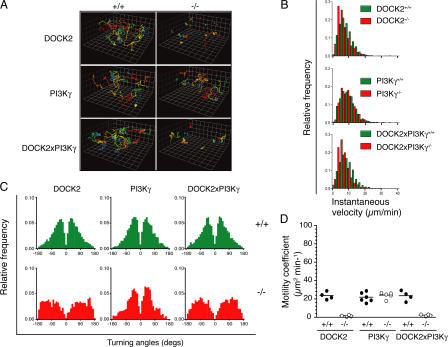
Figure 2.
Follicular B cell migration in the absence of DOCK2 and PI3Ku03b3. Control B cells were adoptively transferred with DOCK2 u2212/u2212 , PI3Ku03b3 u2212/u2212 , or DOCK2 u2212/u2212 u00d7 PI3Ku03b3 u22...
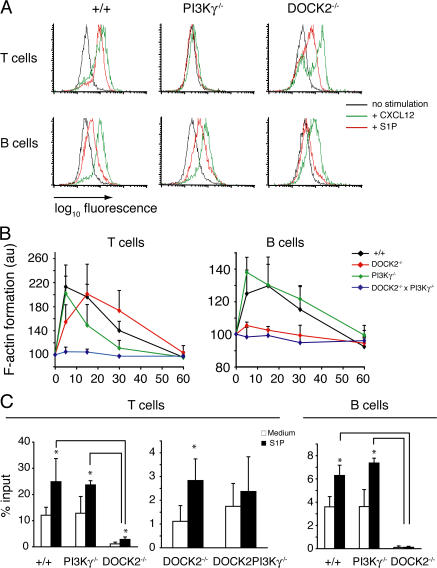
Figure 3.
DOCK2 and PI3Ku03b3 transmit signals downstream of S1P receptors. (A) Flow cytometric analysis of PKB phosphorylation 30 s after the addition of S1P (1 u03bcM final concentration; red line) or 1 min a...
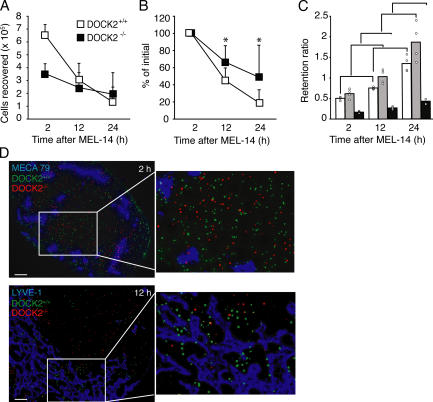
Figure 4.
DOCK2 deficiency delays lymphocyte egress from PLNs. (A) Absolute numbers of control and DOCK2 u2212/u2212 lymphocytes recovered from PLNs at the indicated times after Mel-14 treatment (20 h after ado...
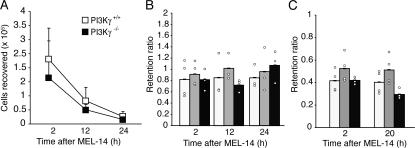
Figure 5.
PI3Ku03b3 deficiency does not affect lymphocyte egress from PLNs. (A) Total numbers of PI3Ku03b3 +/+ and PI3Ku03b3 u2212/u2212 cells present in PLNs at 2, 12, and 24 h after Mel-14 mAb treatment (4 h ...
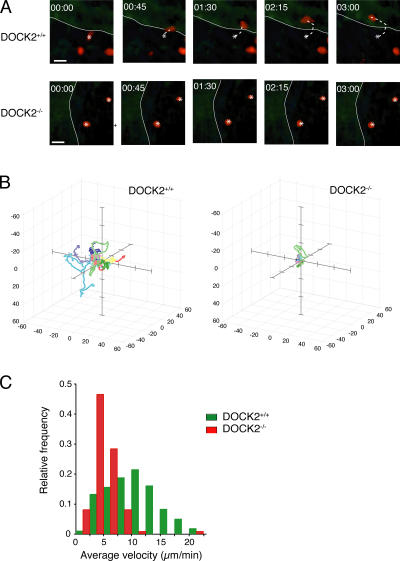
Figure 6.
Medullar T cell migration in the absence of DOCK2. (A) Image sequence of control and DOCK2-deficient T cells proximal to efferent WGA + lymphatic vessels (green, outline labeled white for greater clar...
Figure images are served from the NIH/NLM PubMed Central Open Access Subset or Europe PMC; copyright remains with the publishers and authors.
💬 Discussion
0 commentsNo comments yet. Be the first to start a discussion!
Leave a Comment