Abstract
Diverse extracellular matrix patterns are observed in both normal and pathological tissue. However, most current tools for quantitative analysis focus on a single aspect of matrix patterning. Thus, an automated pipeline that simultaneously quantifies a broad range of metrics and enables a comprehensive description of varied matrix patterns is needed. To this end, we have developed an ImageJ plugin called TWOMBLI, which stands for The Workflow Of Matrix BioLogy Informatics. This pipeline includes metrics of matrix alignment, length, branching, end points, gaps, fractal dimension, curvature, and the distribution of fibre thickness. TWOMBLI is designed to be quick, versatile and easy-to-use particularly for non-computational scientists. TWOMBLI can be downloaded from https://github.com/wershofe/TWOMBLI together with detailed documentation and tutorial video. Although developed with the extracellular matrix in mind, TWOMBLI is versatile and can be applied to vascular and cytoskeletal networks. Here we present an overview of the pipeline together with examples from a wide range of contexts where matrix patterns are generated.
🔬 Techniques
🔭 Microscopes
💻 Software
✨ Fluorophores
🧪 Sample Preparation
🏭 Microscope Brands
🧪 Reagent Suppliers
🔴 Lasers
🔎 Objectives
💻 Software Details
💻 Code & Software
💾 Data Repositories
🏛️ Research Organizations (ROR)
Affiliated research institutions:
📋 Methods
Computational analysis
All computational methods are described in detail in the TWOMBLI documentation which can be found at https://github.com/wershofe/TWOMBLI .
Picrosirius red staining
Samples were stained using ABCAM ab150681 Picrosirius Red Kit. Briefly, slides were deparaffinised and hydrated, before applying Picrosirius red solution for 60 min, rinsing twice in acetic acid, then alcohol dehydration, and finally mounting. Slides were then scanned at 10× using Zeiss Axio Scan.Z1. CDM assay The CDM assay and the fibroblasts used are described in Park et al ( 4 ). Briefly, glass-bottom dishes (P35-1.5-14-C; MatTek) were pre-prepared with 0.2% gelatin solution (1 h, 37°C), then 1% glutaraldehyde for 30 min at RT. After PBS buffer solution wash, the plate was incubated with 1 M ethanolamine for 30 min (RT). After two washes with PBS, we seeded 7 × 10 4 cells in media with 100 μg ml −1 ascorbic acid ((+)-sodium L-ascorbate, A4034; Sigma-Aldrich). Cells were kept for 6 d and media changed every 2 d. We used extraction buffer and washed several times with PBS before immunofluorescence for ECM using anti-fibronectin-FITC (1:50 dilution, ab72686; Abcam). Samples were imaged using a Zeiss LSM 780 microscope using either a 20× 0.75 NA objective or 10× 0.45 NA objective.
Collagen imaging
Second-harmonic generation imaging for collagen was performed as described in Park et al using a Zeiss LSM 780 microscope with Mai Tai multi-photon laser. Fresh post-mortem tissue from PDGFRA::H2B-eGFP mice was used.
Supplementary Material Reviewer comments
📊 Figures
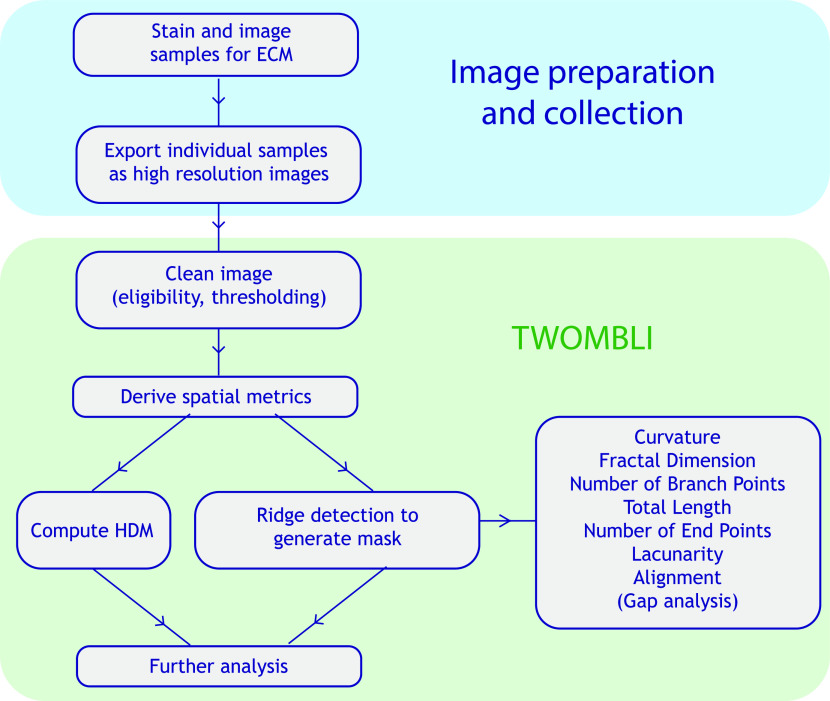
Figure 1.
Workflow diagram of quantification of matrix patterns.
End-to-end pipeline from obtaining the samples through matrix quantification to survival analysis based on this matrix metrology. A list of metrics is given in the right-most box.
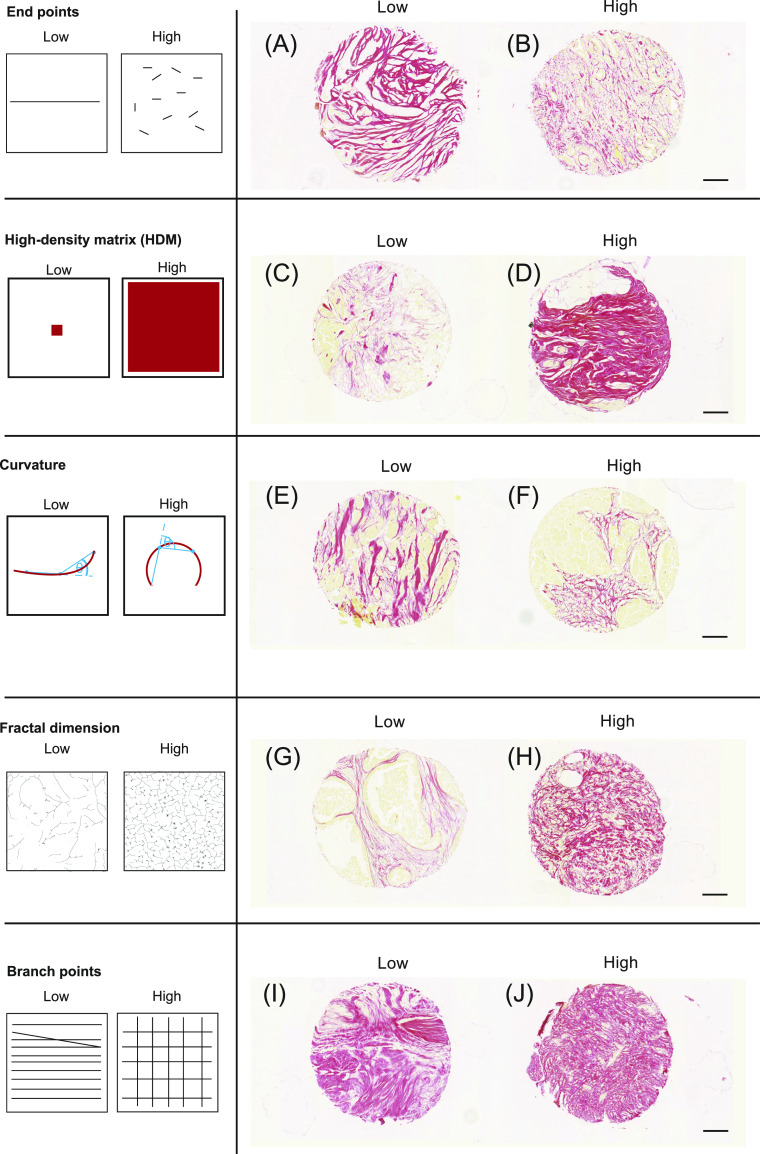
Figure 2.
Schematics and example tissue biopsies of ECM metrics.
(A, B, C, D, E, F, G, H, I, J) Images show Picrosirius red staining breast cancer biopsies. Each biopsy is 600 u03bcm in diameter, scale bar is 100 u03bcm.
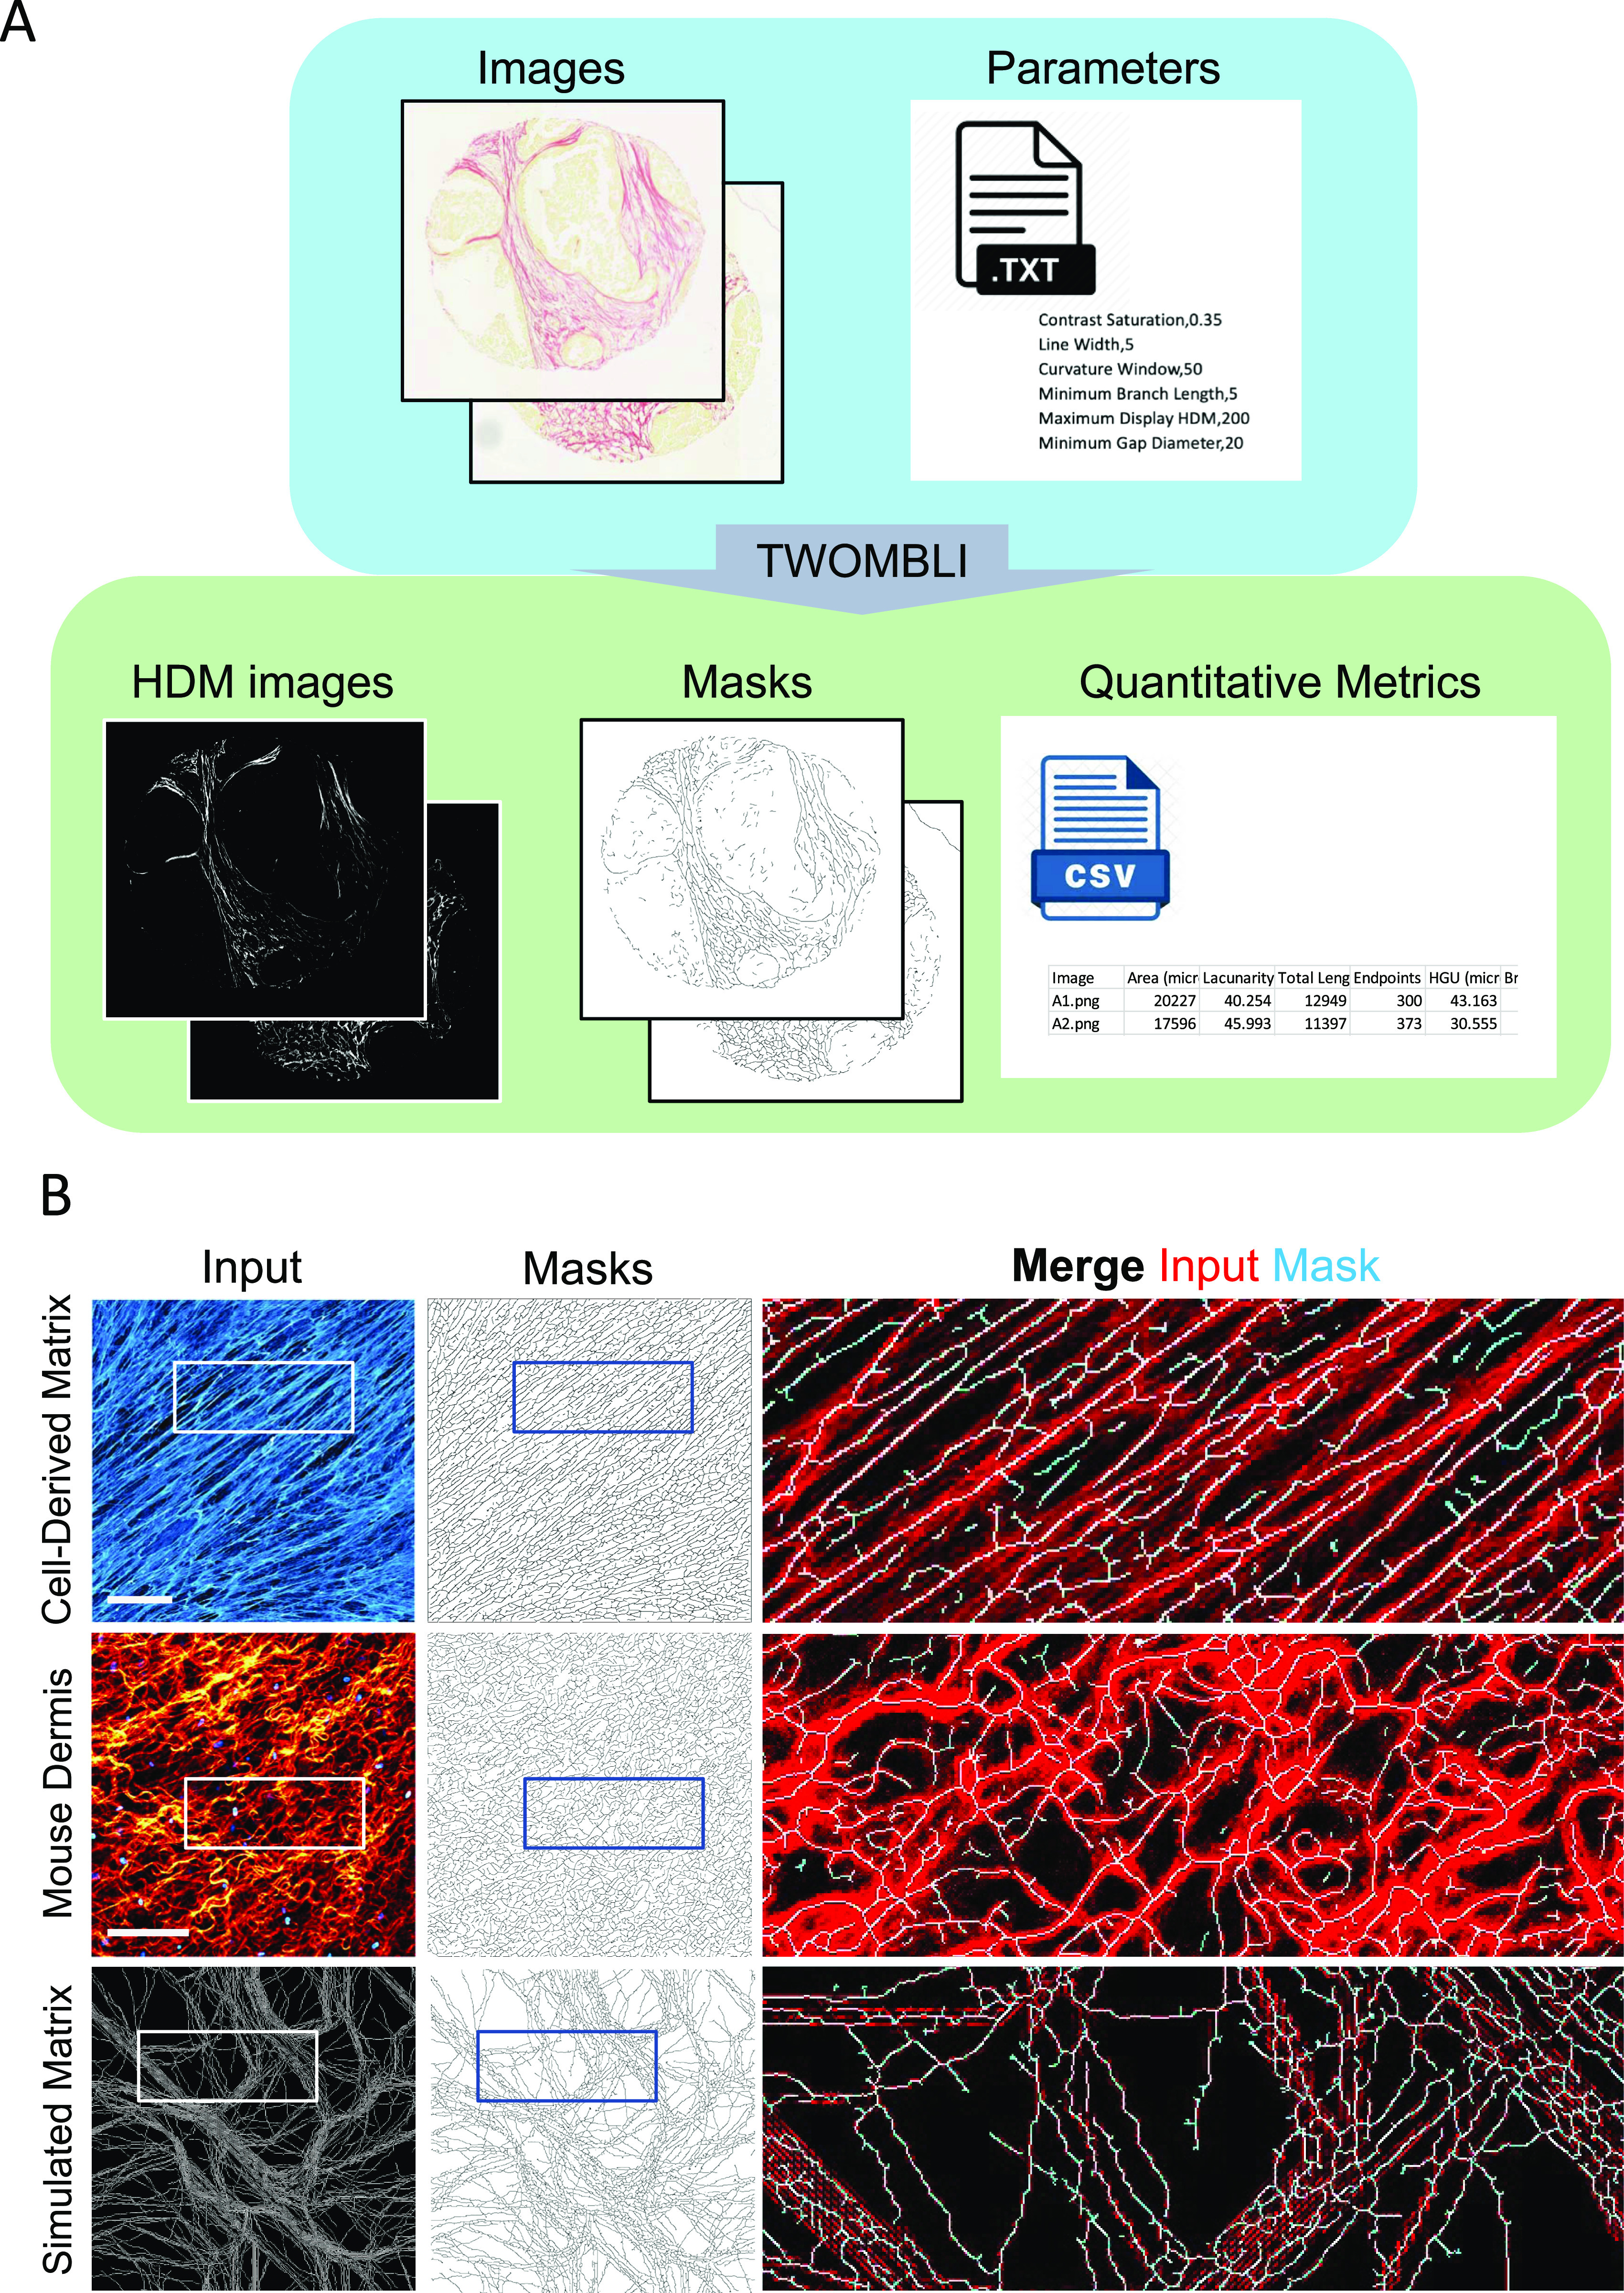
Figure 3.
Input and outputs of TWOMBLI pipeline.
(A) User inputs an image of a sample stained for ECM components (in this case, collagen is stained with Picrosirius red). Outputs consist of a mask, a csv file containing matrix metrics based on the m...
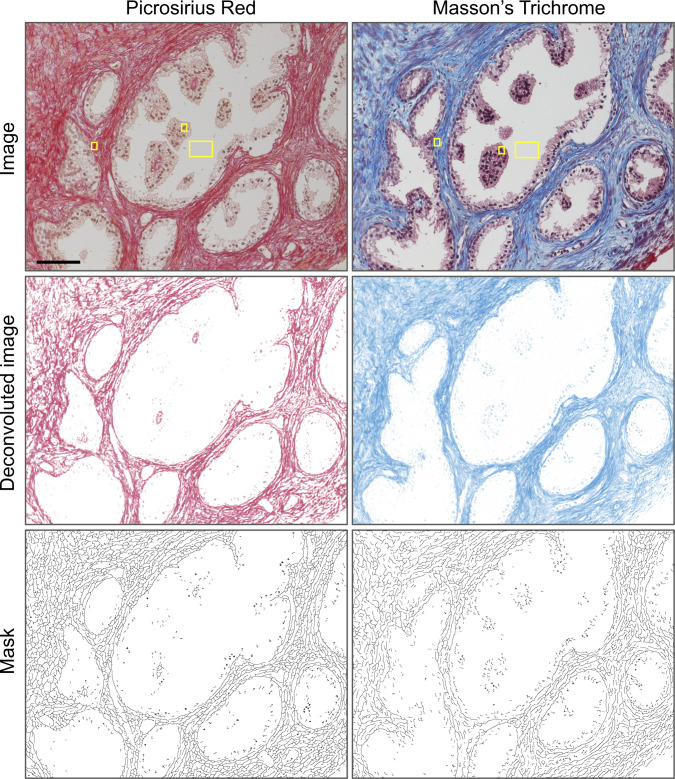
Figure S1.
Use of colour deconvolution on histochemical matrix staining.
Upper panels show matrix staining using Picrosirius red (PSR) or Massonu2019s trichrome (MTR). Yellow boxes indicate the regions of interest (ROIs) specified for deconvolution ROIs were selected corre...
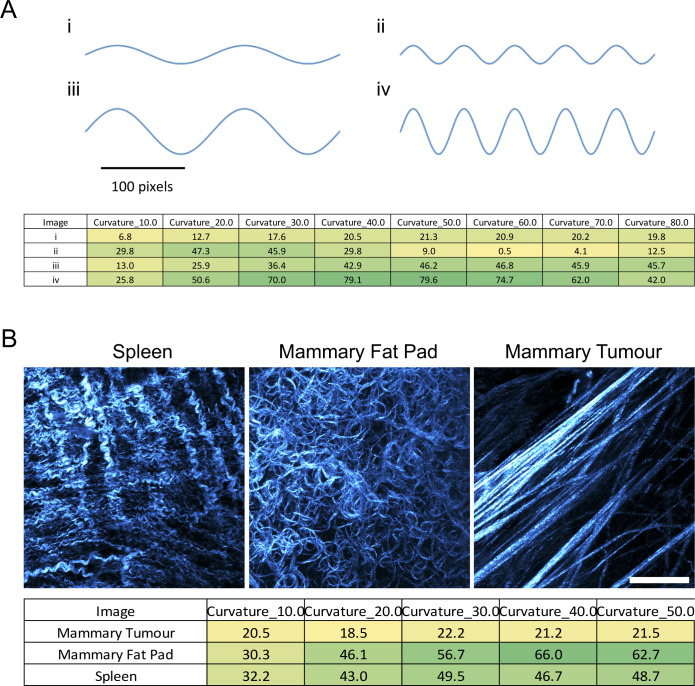
Figure S2.
Analysing curvature for different curvature windows. (A)
Table shows outputs of the curvature tool using exemplar sine waves (shown in the upper part of the panel). (B) Table shows outputs of the curvature tool using matrix images of mouse spleen, mammary f...
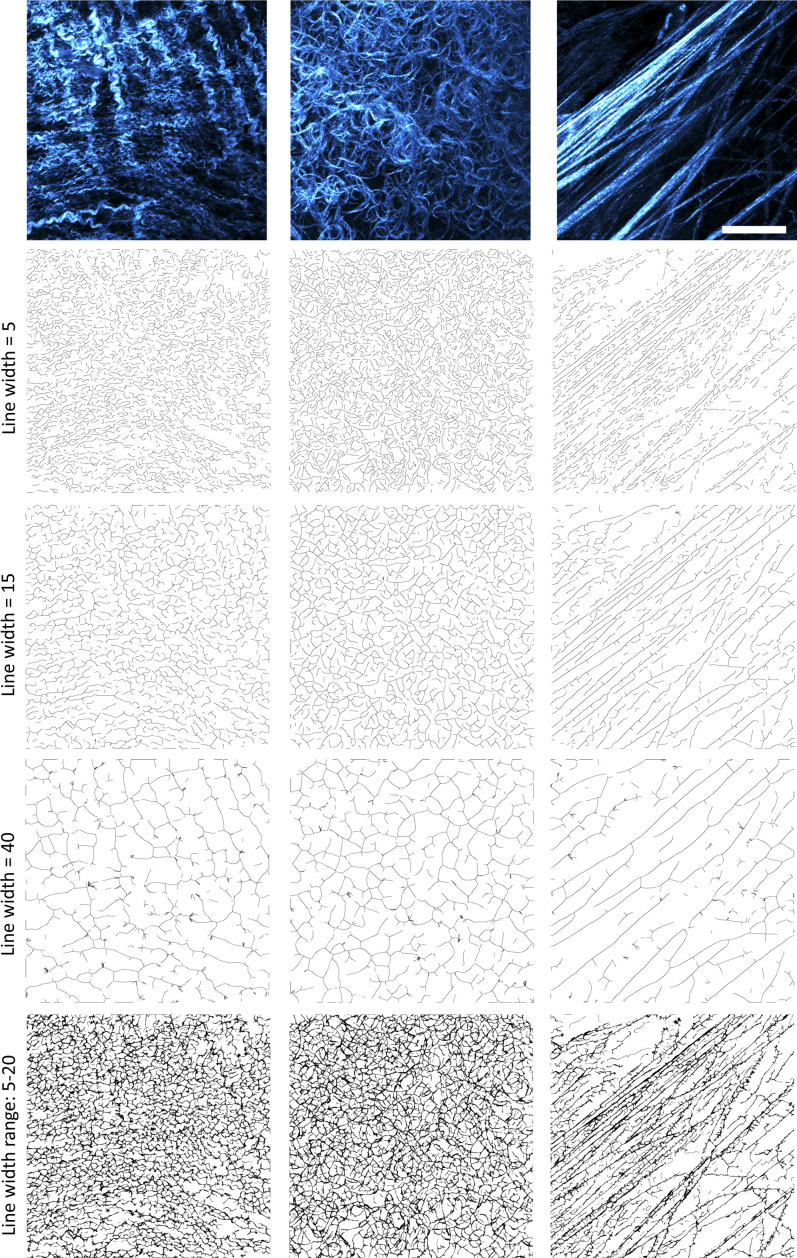
Figure S3.
Images show outputs of TWOMBLI using different line width parameters on images of mouse spleen (left), mammary fat pad (middle), and mammary tumour (right) (shown in the upper part of the panel).
These images are the same as those used in Fig S2 to demonstrate how the same images are handled by different aspects of TWOMBLI. Line width parameter values are indicated on the left. Lower panels ar...
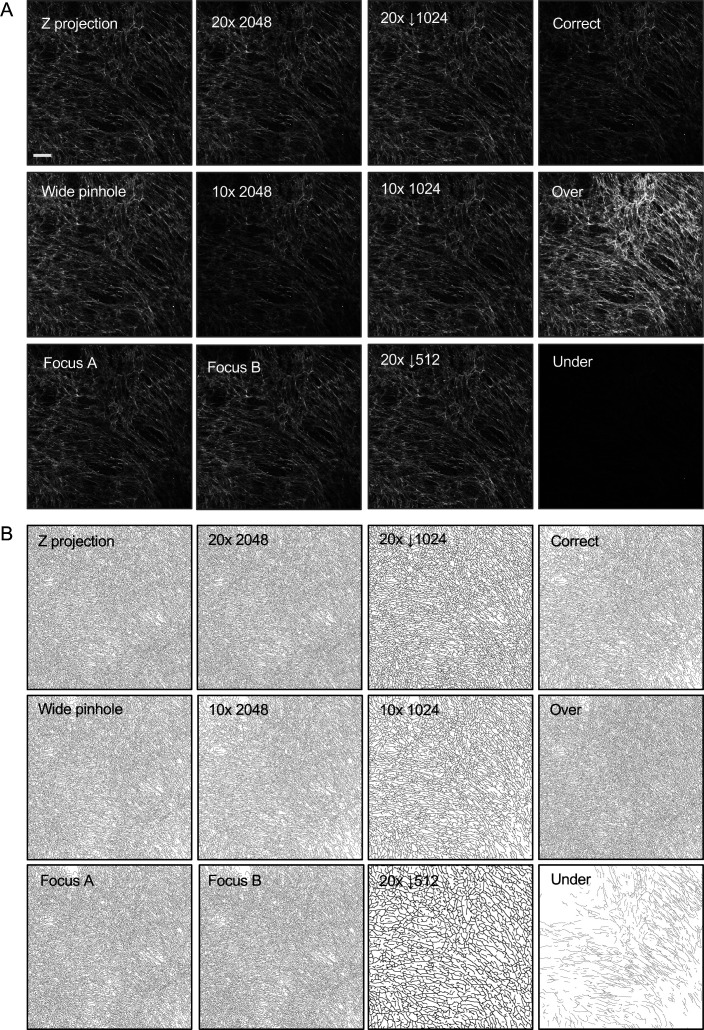
Figure S4.
Robustness of TWOMBLI to perturbations. (A)
Examples of the images of the isotropic and anisotropic matrices used for robustness testing. Images are a single confocal section captured with a 20u00d7 0.75 NA objective containing 2,048 u00d7 2,04...
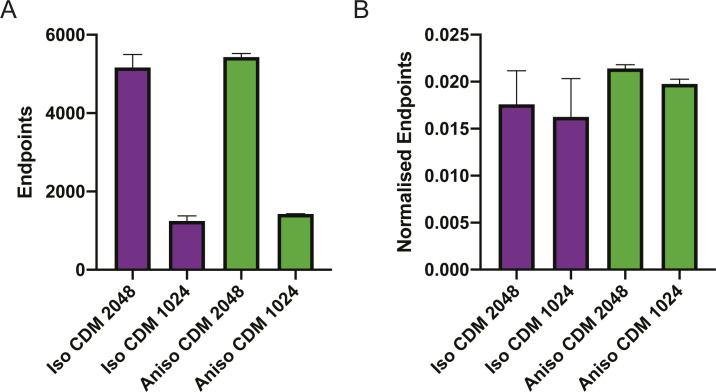
Figure S5.
Effect of normalisation.
(A) Shows quantification of end points from two images with 2,048 pixels spanning 850 u03bcm and two images with 1,024 pixels spanning the same distance. Purple indicates Isotropic cell-derived matrix...
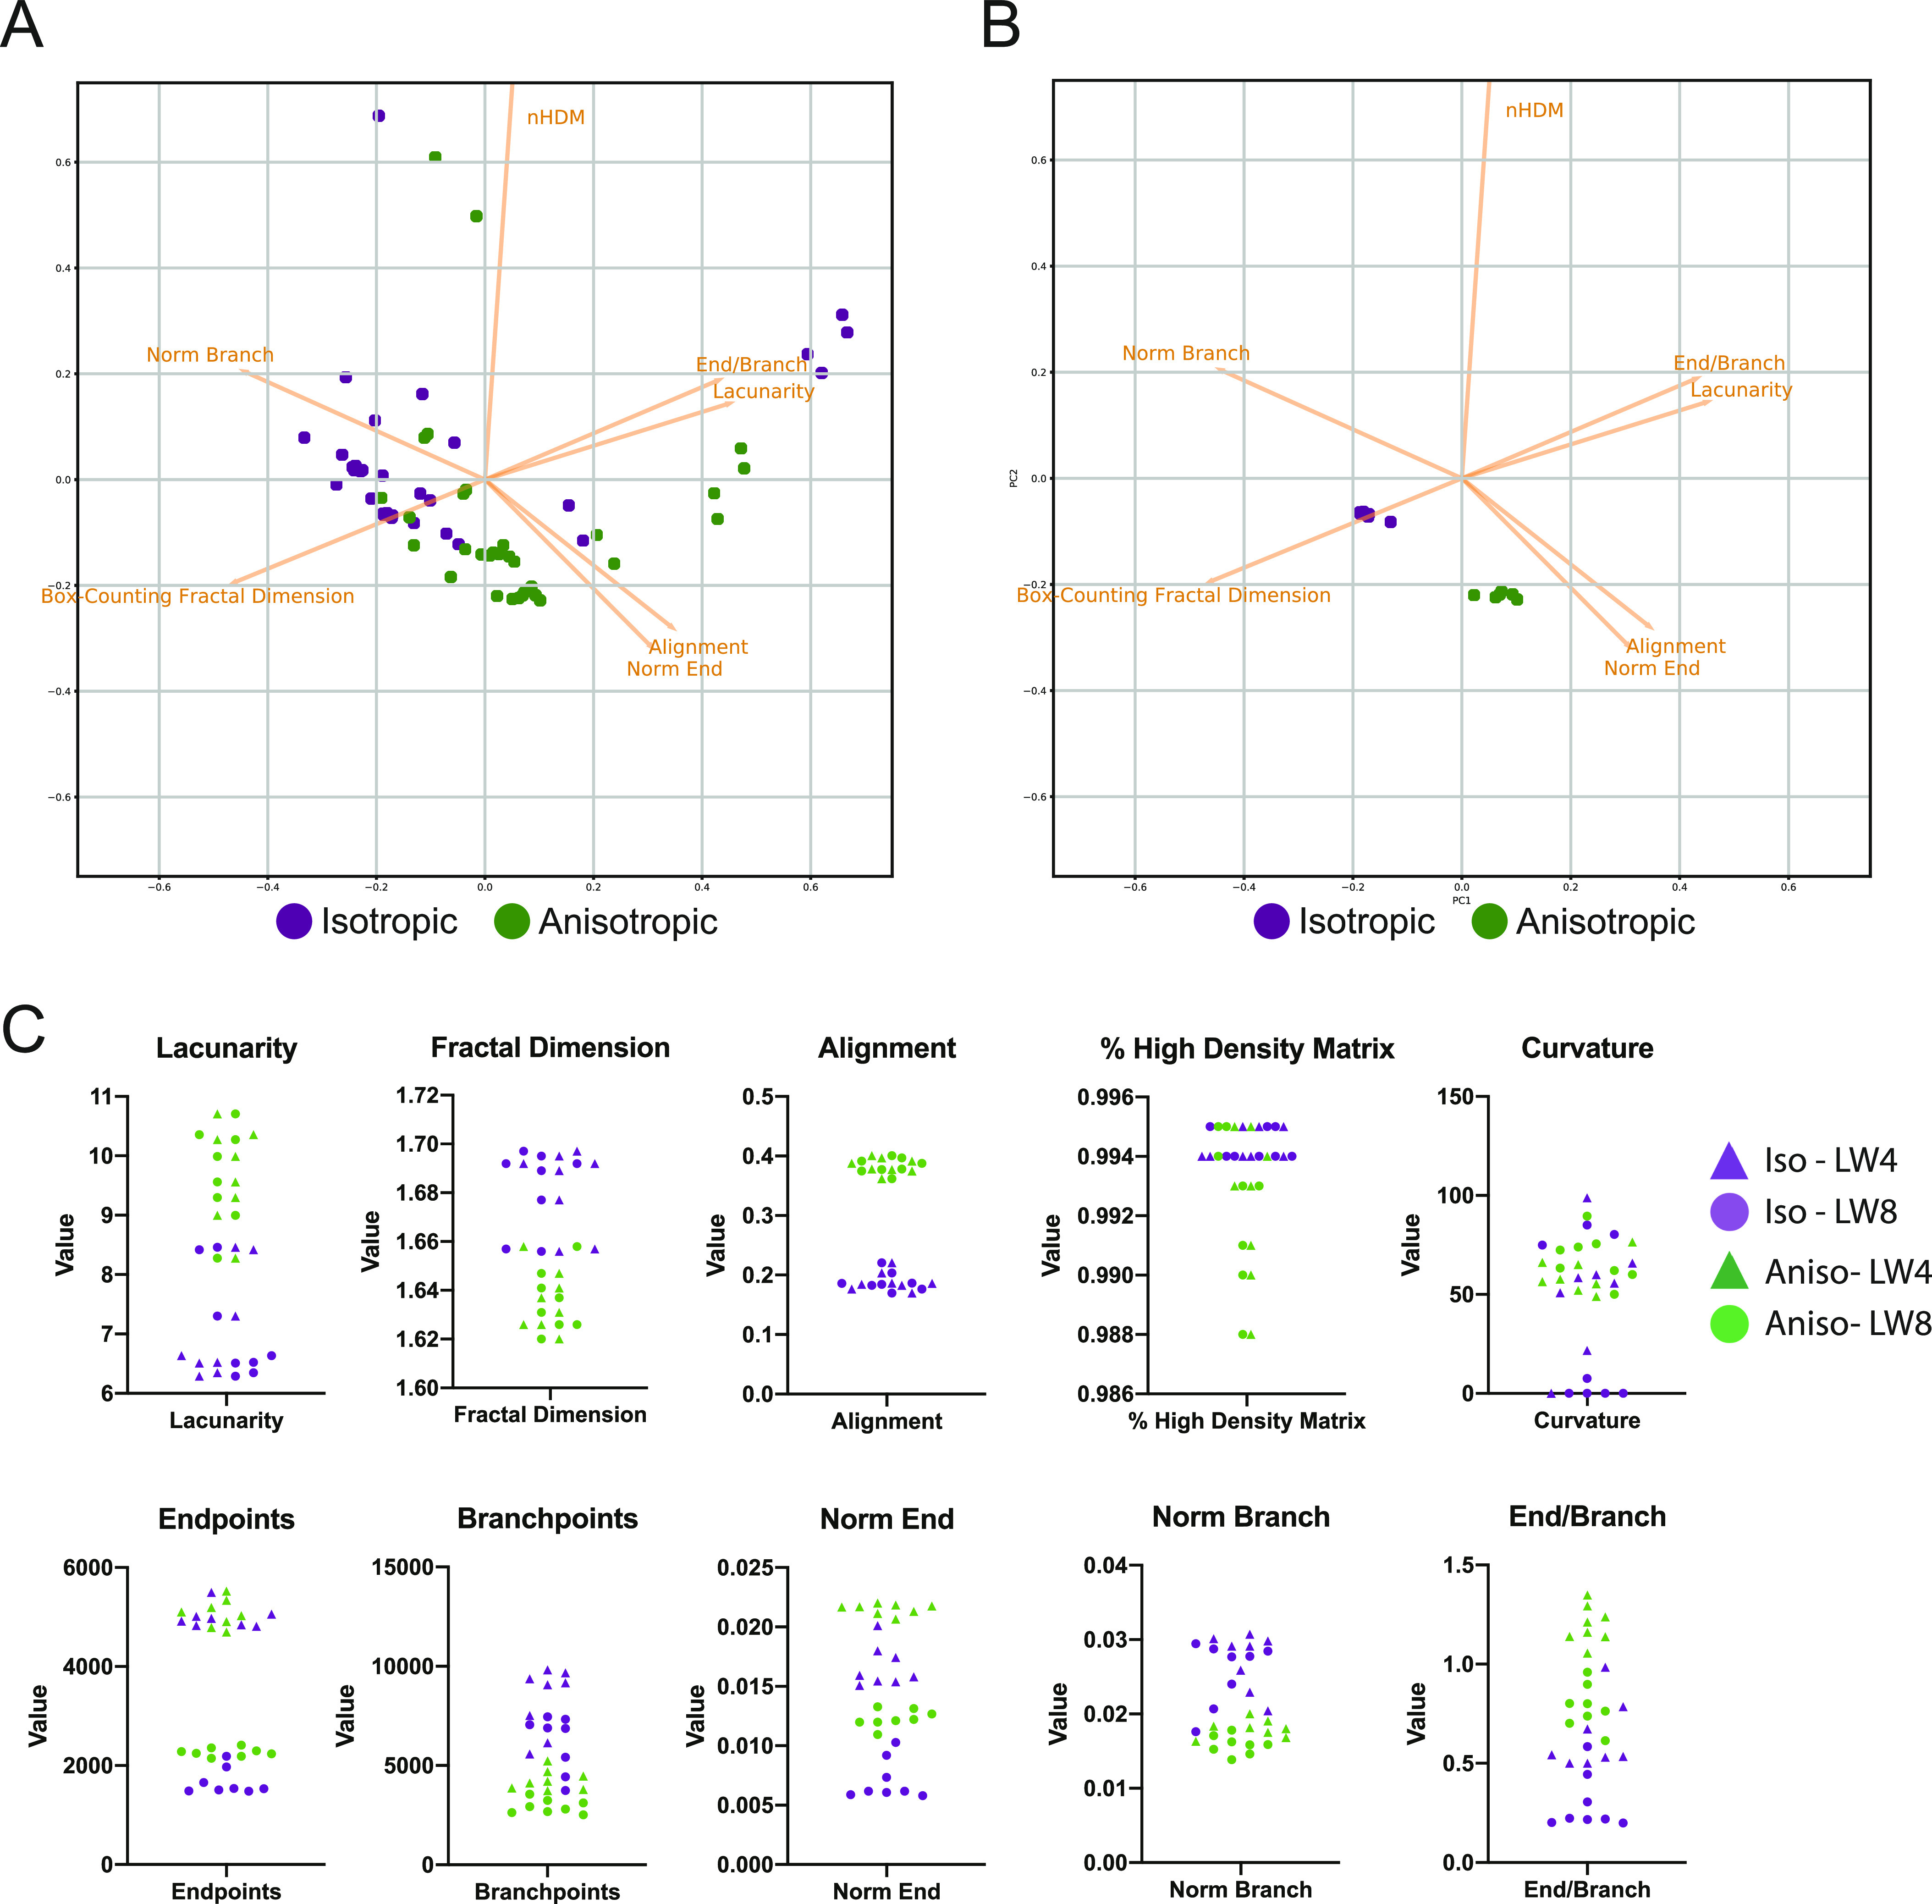
Figure 4.
Robustness of matrix metrics.
(A) Image shows a PCA plot of both experimental and artificial variations in images of the same region of isotropic cell-derived matrix (CDM) (purple dots) and anisotropic CDM (green dots). (B) Image ...
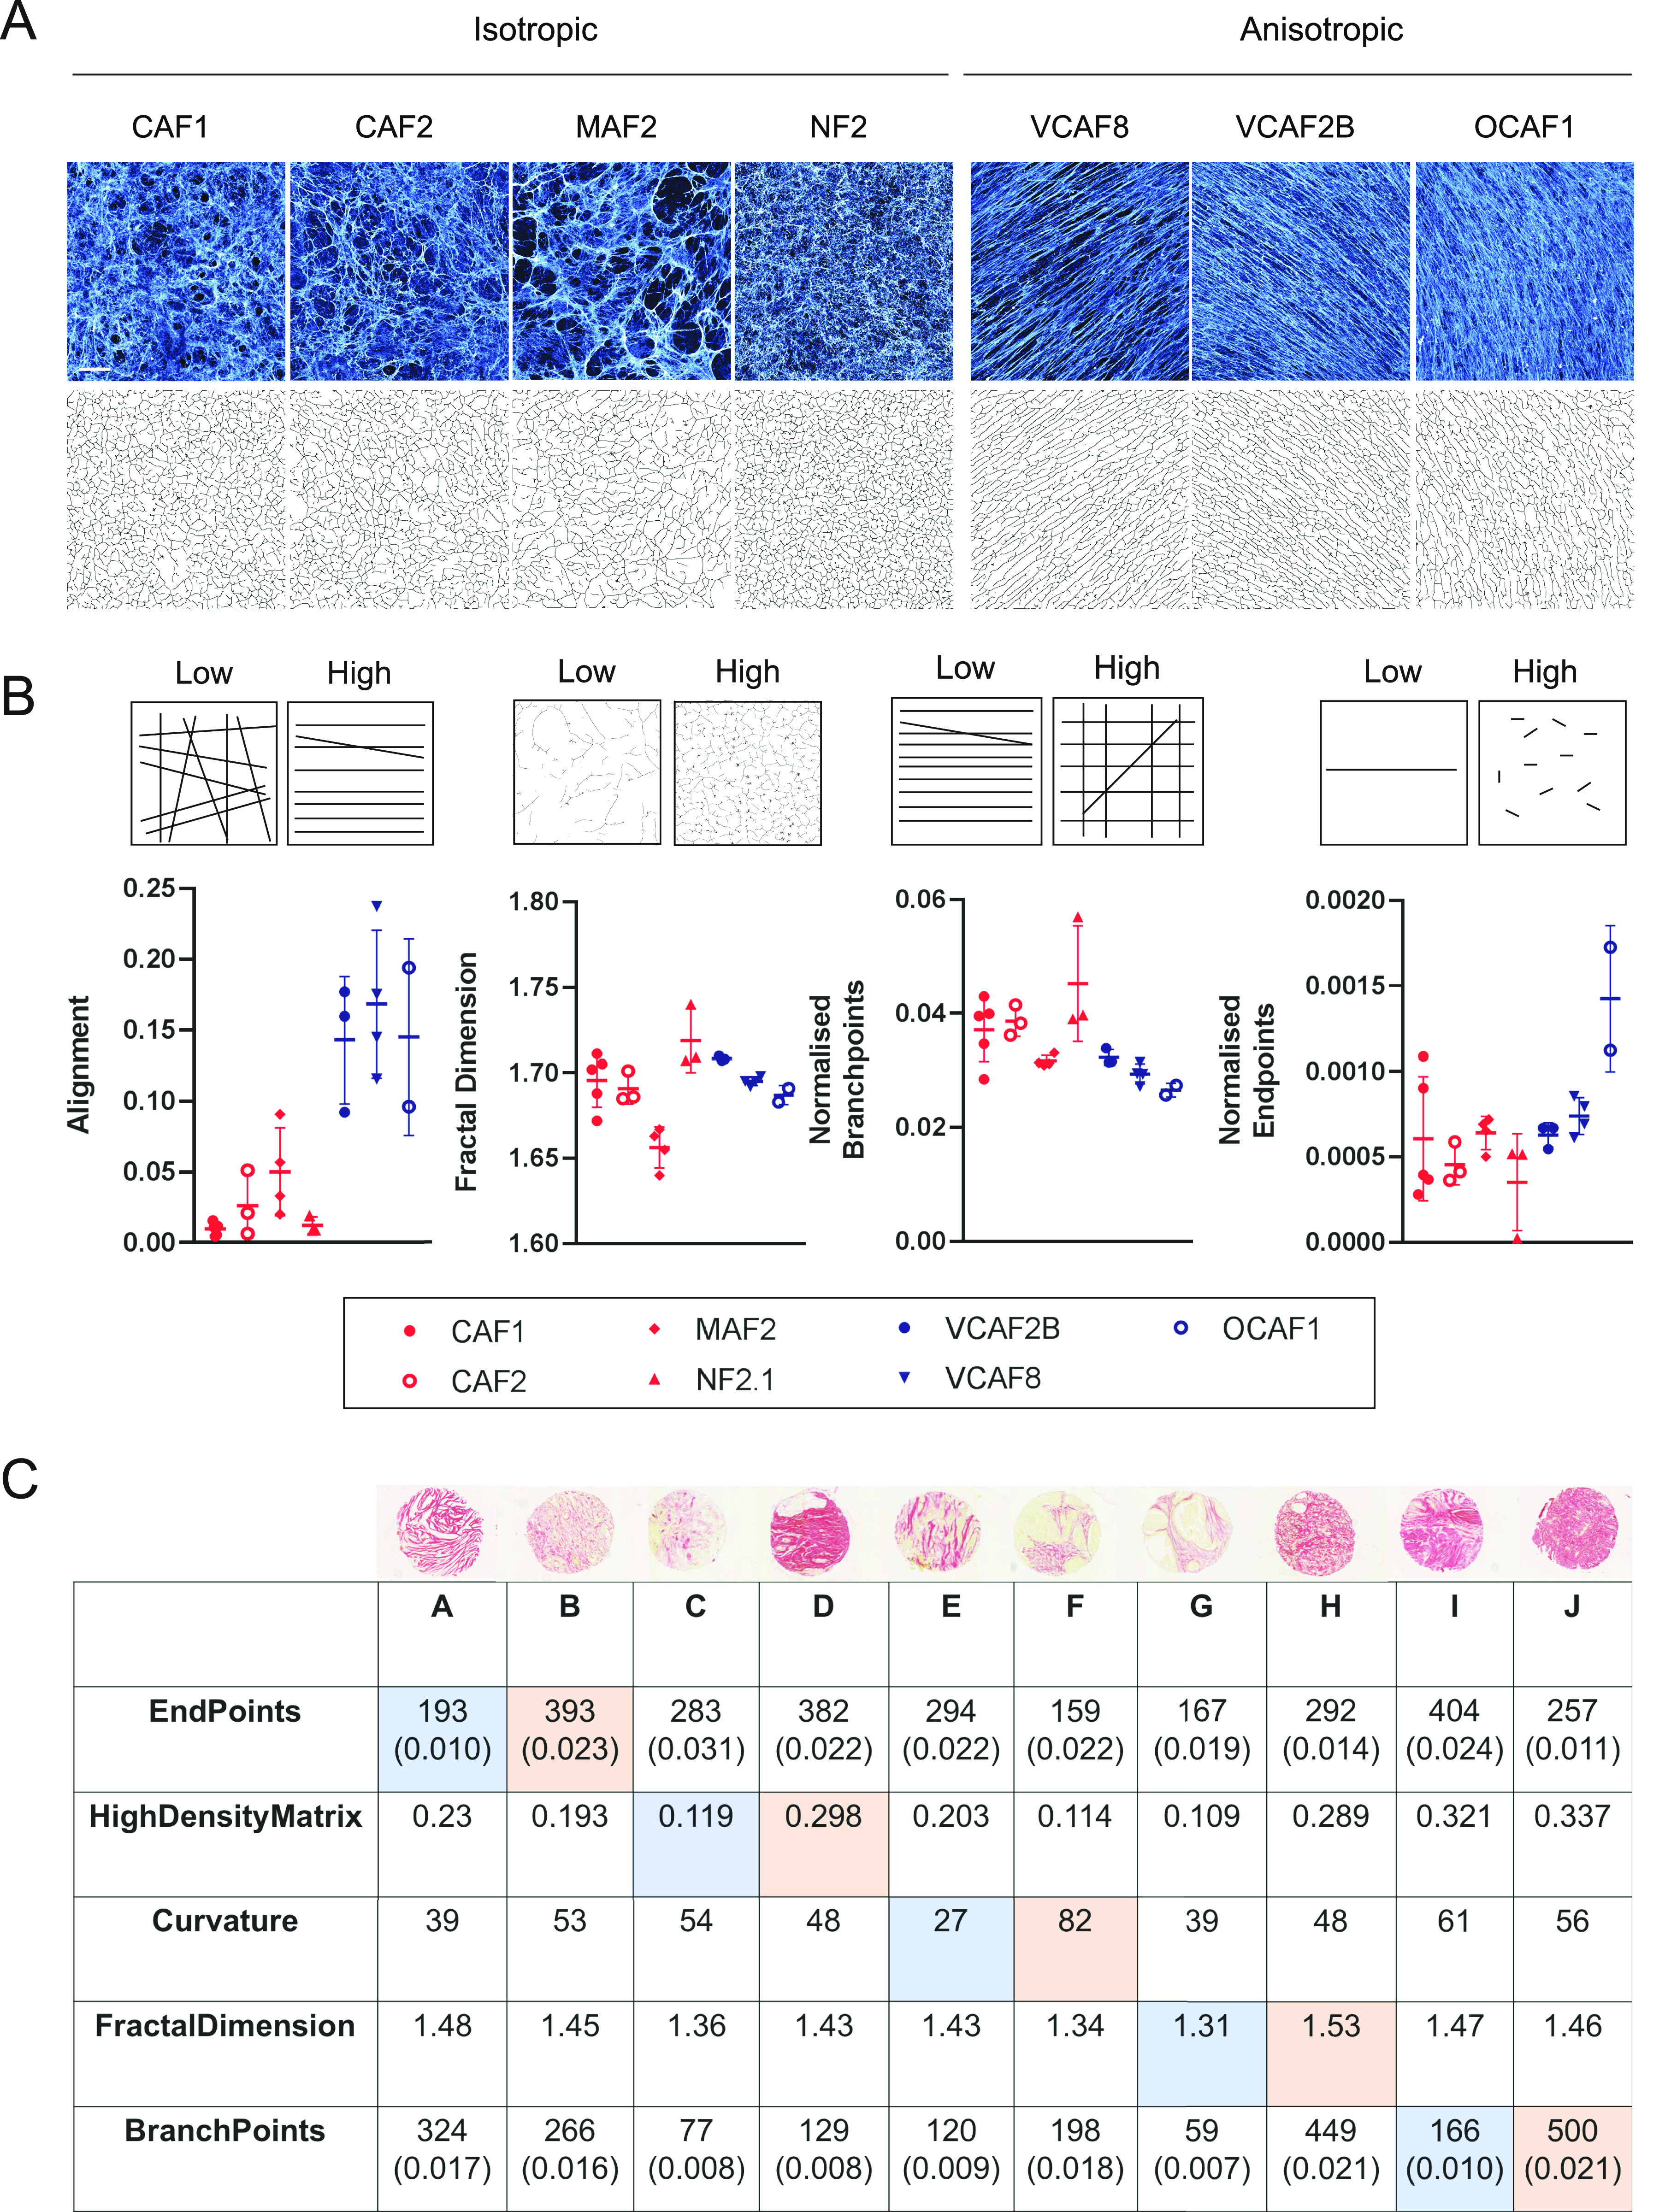
Figure 5.
Using TWOMBLI for quantification of ECM patterns.
(A) CDM imaging of fibronectin produced by seven different fibroblast lines in vitro ( 4 ). Four patterns are isotropic (left) and three patterns are anisotropic (right). Images are 500 u00d7 500 u03b...
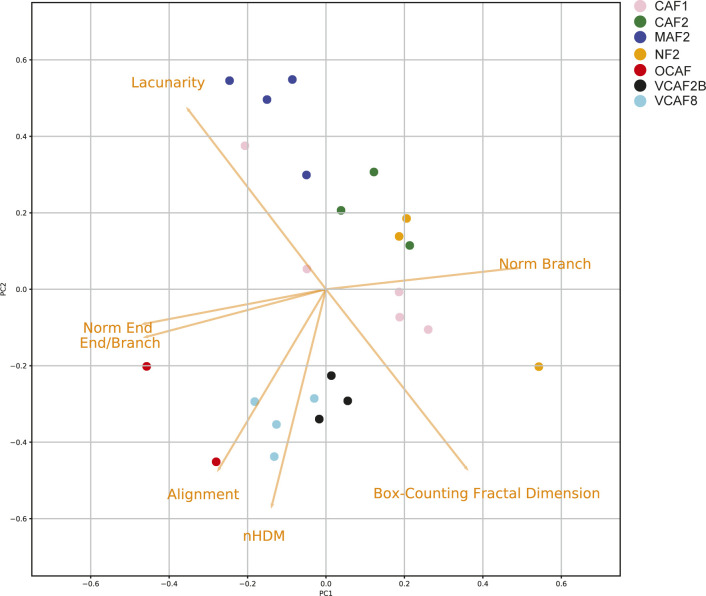
Figure S6.
Discrimination of different cell-derived matrices.
Image shows a PCA plot of the metrics of cell-derived matrices generated by seven different fibroblasts.
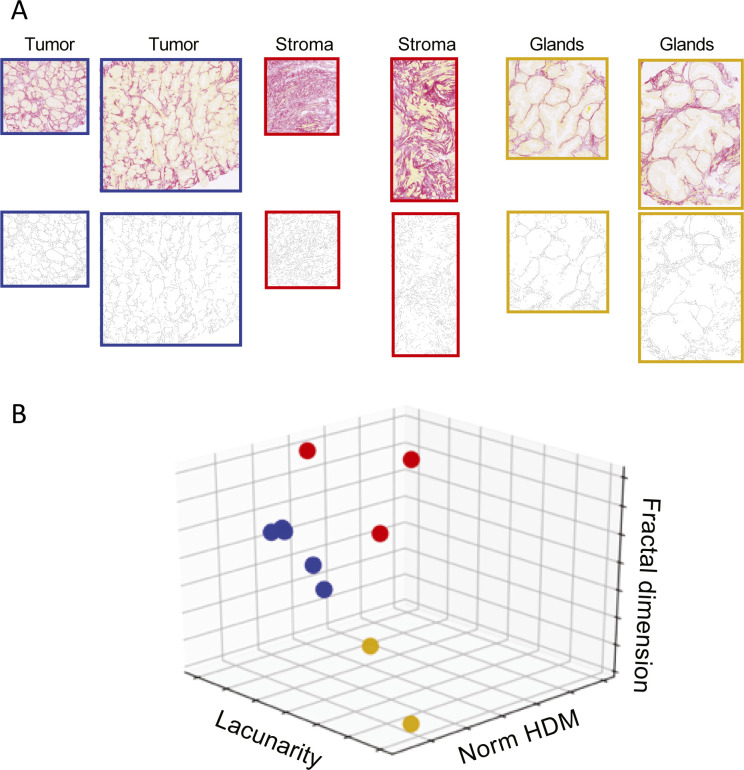
Figure S7.
Quantifying prostate cancer images.
(A) Normal prostate and tumour biopsies stained with Picrosirius red are shown above their corresponding mask. Scale bar is 250 u03bcm. Normal prostate images are sub-divided into glandular or stromal...
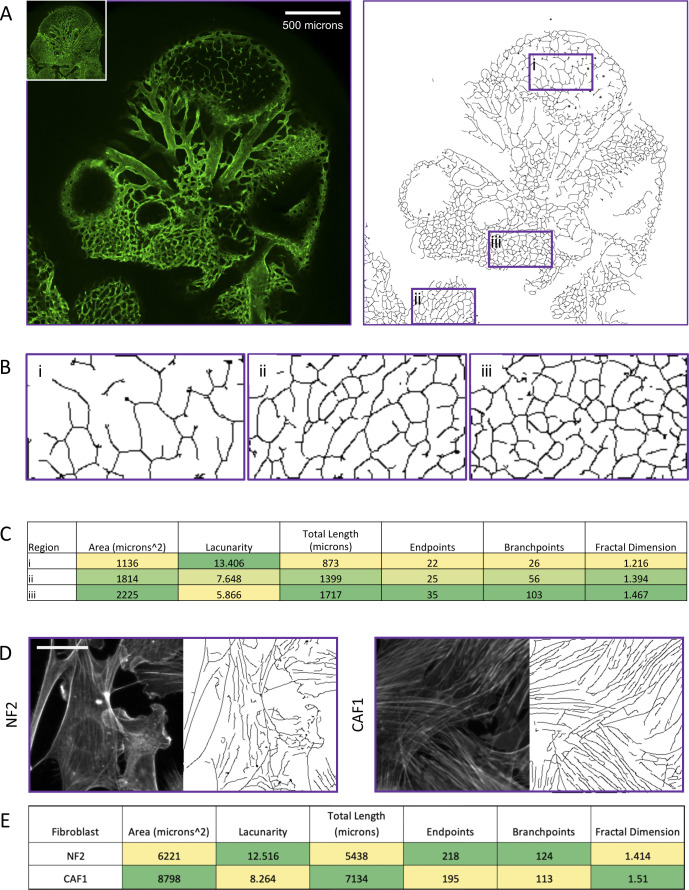
Figure S8.
Applications of TWOMBLI to actin cytoskeleton.
(A) Left-hand image shows a cross-section of endomucin staining of an E10.5 mouse embryo (inset panel shows maximum intensity projection). Right-hand image shows the TWOMBLI mask derived from the main...
Figure images are served from the NIH/NLM PubMed Central Open Access Subset or Europe PMC; copyright remains with the publishers and authors.
💬 Discussion
0 commentsNo comments yet. Be the first to start a discussion!
Leave a Comment