Abstract
The formation of misfolded protein aggregates is a hallmark of neurodegenerative diseases. The aggregate formation process exhibits an initial lag phase when precursor clusters spontaneously assemble. However, most experimental assays are blind to this lag phase. We develop a quantitative assay based on super-resolution imaging in fixed cells and light sheet imaging of living cells to study the early steps of aggregation in mammalian cells. We find that even under normal growth conditions mammalian cells have precursor clusters. The cluster size distribution is precisely that expected for a so-called super-saturated system in first order phase transition. This means there exists a nucleation barrier, and a critical size above which clusters grow and mature. Homeostasis is maintained through a Szilard model entailing the preferential clearance of super-critical clusters. We uncover a role for a putative chaperone (RuvBL) in this disassembly of large clusters. The results indicate early aggregates behave like condensates. Editorial note: This article has been through an editorial process in which the authors decide how to respond to the issues raised during peer review. The Reviewing Editor's assessment is that all the issues have been addressed (<xref ref-type="decision-letter" rid="SA1">see decision letter</xref>).
🔬 Techniques
🔭 Microscopes
🧬 Organisms
💻 Software
✨ Fluorophores
🧪 Sample Preparation
🔬 Cell Lines
🏭 Microscope Brands
🧪 Reagent Suppliers
📷 Detectors
💻 Software Details
💻 Code & Software
💾 Data Repositories
🏷️ Research Resource Identifiers (RRIDs)
Verified research resources used in this paper:
🏛️ Research Organizations (ROR)
Affiliated research institutions:
📋 Methods
Key resources table
Reagent type (species) or resource Designation Source or reference Identifiers Additional information Cell line ( H. sapiens ) MCF10A ATCC ATCC: CRL10317 RRID: CVCL_0598 Cell line ( H. sapiens ) Neuro2A ATCC ATCC:CCL131 RRID: CVCL_0470 Transfected construct Synphilin-GFP Zaarur et al., 2008 n/a Generated by Sherman lab - published Zaarur et al., 2008 , backbone pCXsbr Transfected construct Human Alpha Synuclein Addgene 51437 Transfected construct Dendra 2 Clonetech USA PDendra2C Transfected construct Synphilin-Dendra2 This Paper n/a Generated from synphilin-gfp and dendra two plasmid above. Available from Cisse lab Transfected construct alpha Synuclein Dendra2 This paper n/a Generated from human alpha Synuclein and Dendra two plasmid above. Available from Cisse lab Sequence- based reagent siGENOME Non-Targeting siRNA #5 Dharmacon D-001210–05 Sequence- based reagent siGENOME RUVBL1 siRNA Dharmacon (D-008977–04) Chemical compound, drug Chemical compound, drug MG132 Sigma Aldrich M8699 Chemical compound, drug Rapamycin Sigma Aldrich R8781 Chemical compound, drug Cycloheximide Sigma Aldrich C7698 Chemical compound, drug Azetidine-2-Carboxylic acid Sigma Aldrich A0760 Chemical compound, drug Cholera Toxin Sigma Aldrich C8052 Chemical compound, drug Human Insulin Sigma Aldrich I9278 Chemical compound, drug Leboqitz L15 medium Sigma Aldrich 11415064 Chemical compound, drug Hydrocortisone Sigma Aldrich H0888 Chemical compound, drug dbCAMP Sigma Aldrich D0627 Chemical compound, drug Ver155008 Sigma Aldrich SML0271 Chemical compound, drug Lipofectamine RNAiMAX Thermo Fisher 13778030 Chemical compound, drug Xtremegene 9 Sigma Aldrich 6365779001 Software, algorithm qSR Andrews et al. (2018) Software made available on repository - http://github.com/cisselab/qSR/ Software, algorithm Lattice Light sheet processing code Chen et al., 2014 Software, algorithm Multiple Target tracking(MTT) Sergé et al., 2008 Contact for reagent and resource sharing 'Further information and requests for resources and reagents should be directed to and will be fulfilled by the Lead Contact, Ibrahim Cisse ( icisse@mit.edu ) Experimental model and subject details Cell lines were generated from MCF-10A (human breast epithelial) cells grown in 50:50 DMEM/F-12 medium supplemented with 5% horse serum, 20 ng/ml epidermal growth factor, 0.5 μg/ml hydrocortisone (Sigma Aldrich), 10 μg/ml human insulin (Sigma Aldrich), and 100 ng/ml cholera toxin (Sigma Aldrich). In all cases, medium was supplemented with Penicillin-Streptomycin and incubated at 37°C in an atmosphere of 5% CO 2 in a water-saturated atmosphere. For the Synphilin-Dendra2 cell line – The retroviral expression construct with C-terminally tagged Synphilin one sub cloned into pCXbsr vector described previously ( Zaarur et al., 2008 ) was used with EGFP at the C-terminus of the construct replaced with Dendra2, PCR cloned from the P-Dendra2C plasmid purchased from Clontech, USA. For the alpha Synuclein–Dendra2 cell lines – alpha Synuclein gene was copied by PCR from Addgene plasmid #51437 and cloned into P-Dendra2C plasmid purchased from Clonetech, USA. For MCF10A –alpha Synuclein cell line – alpha Synuclein-Dendra2 plasmid, was transiently transfected using extremegene9 and selected using Kanamycin resistance cassette in MCF10A (ATCC, USA) cells. The cell line was tested for mycoplasma contamination by the high-throughput sequencing facility at the Koch Institute using the Lonza MycoAlert Plus kit. The cell line tested negative for mycoplasma contamination. Cell line identity was authenticated by ATCC using STR profiling, and gave a 94% match to ATCC cell line CRL-10317(MCF10A). For Neuro2A- alpha Synuclein-Dendra2 control – alpha Synuclein-dendra2 plasmid, described above was transiently transfected using extremegene9 and selected using Kanamycin resistance cassette in Mouse neuroblastoma cell line - Neuro2A (CCL-131, ATCC, USA) Neuro2A was maintained in culture in growth medium consisting of 45% of DMEM high glucose medium w/L-Glutamine (GIBCO, USA), 45% of OptiMEM1 medium (GIBCO, USA) and 10% of Fetal bovine serum (GIBCO, USA) Supplemented by Penicillin-Streptomycin and incubated at 37C in an atmosphere of 5% CO 2 in a water saturated atmosphere. Differentiation to neuronal state was achieved by simultaneous lowering of serum content to 1% and addition of 0.5 mM dbcAMP (Sigma Aldrich, USA) as suggested in ATCC product manuals. In 2 days of growth, distinctly neuronal morphology was established in ~75% of the cells in culture and alpha Synuclein expression was observed throughout the cell but was enhanced at the tips of the finger-like processes of the cell. The neuronal state of N2A cells under dbcAMP differentiation has been established in the literature ( Tremblay et al., 2010 ) Method details Genetic and pharmacological treatments The various pharmacological and genetic stresses were applied as follows- Naïve (unstressed) growth – cells grown in the culture medium described above were imaged without any stress. This condition was measured as control along with every other stress and on its own on three separate occasions (independently cultured and plated imaging dishes). Proteasome inhibition – cells were incubated for 0 to 4 hr using 2 μM MG132 (Sigma Aldrich, USA) in normal growth medium. Additional tests were done with lower concentrations and slightly longer incubation times, 500 nM MG132 was the lowest attempted concentration that allowed aggresome formation. This stress was measured on three separate occasions (independently cultured and plated imaging dishes). Rapamycin incubation: Cells were incubated for 12 hr in normal growth medium supplemented with 100 nM rapamycin (Sigma Aldrich, USA) after being plated on the imaging coverslip. This stress was measured on two separate occasions (independently cultured and plated imaging dishes). Cycloheximide incubation: Cells were incubated in normal growth medium supplemented by 500 μg/ml of Cycloheximide for 3 hr. This experiment was repeated on two occasions (independently cultured and plated imaging dishes) Ver155008 incubation: Cells were incubated in normal growth medium supplemented by concentrations up to 50 μM in DMSO alongside DMSO control. Incubation was done for 3 hr and 9 hr. Amino acid substitution: Cells were incubated for 3 hr in normal growth medium containing 5 mM Azetidine-2-carboxylic acid (Sigma Aldrich, USA). This stress was measured on its own on two separate occasions separate occasions (independently cultured and plated imaging dishes), and also as control dish for combination of amino acid substitution and proteasome inhibition on two separate occasions (independently cultured and plated imaging dishes). RUVBL depletion: For siRNA transfection, we used Lipofectamine RNAiMAX (Invitrogen) and followed the manufacturer’s reverse-transfection protocol. For a well on a 24-well plate, we mixed 0.4 μl of the reagent with 2 μl of 10 μM siRNA in 100 μl of OptiMEM and added the mixture to 400 μl of a cell suspension in the well. 24–28 hr later the transfection was stopped and the cells were plated for an experiment conducted the next day. We used the following siRNAs purchased from Dharmacon: siGENOME Non-Targeting siRNA #5 and siGENOME RUVBL1 siRNA (D-008977–04) this stress was measured on two separate occasions (independently cultured and plated imaging dishes).
Show full methods section
Key resources table
Reagent type (species) or resource Designation Source or reference Identifiers Additional information Cell line ( H. sapiens ) MCF10A ATCC ATCC: CRL10317 RRID: CVCL_0598 Cell line ( H. sapiens ) Neuro2A ATCC ATCC:CCL131 RRID: CVCL_0470 Transfected construct Synphilin-GFP Zaarur et al., 2008 n/a Generated by Sherman lab - published Zaarur et al., 2008 , backbone pCXsbr Transfected construct Human Alpha Synuclein Addgene 51437 Transfected construct Dendra 2 Clonetech USA PDendra2C Transfected construct Synphilin-Dendra2 This Paper n/a Generated from synphilin-gfp and dendra two plasmid above. Available from Cisse lab Transfected construct alpha Synuclein Dendra2 This paper n/a Generated from human alpha Synuclein and Dendra two plasmid above. Available from Cisse lab Sequence- based reagent siGENOME Non-Targeting siRNA #5 Dharmacon D-001210–05 Sequence- based reagent siGENOME RUVBL1 siRNA Dharmacon (D-008977–04) Chemical compound, drug Chemical compound, drug MG132 Sigma Aldrich M8699 Chemical compound, drug Rapamycin Sigma Aldrich R8781 Chemical compound, drug Cycloheximide Sigma Aldrich C7698 Chemical compound, drug Azetidine-2-Carboxylic acid Sigma Aldrich A0760 Chemical compound, drug Cholera Toxin Sigma Aldrich C8052 Chemical compound, drug Human Insulin Sigma Aldrich I9278 Chemical compound, drug Leboqitz L15 medium Sigma Aldrich 11415064 Chemical compound, drug Hydrocortisone Sigma Aldrich H0888 Chemical compound, drug dbCAMP Sigma Aldrich D0627 Chemical compound, drug Ver155008 Sigma Aldrich SML0271 Chemical compound, drug Lipofectamine RNAiMAX Thermo Fisher 13778030 Chemical compound, drug Xtremegene 9 Sigma Aldrich 6365779001 Software, algorithm qSR Andrews et al. (2018) Software made available on repository - http://github.com/cisselab/qSR/ Software, algorithm Lattice Light sheet processing code Chen et al., 2014 Software, algorithm Multiple Target tracking(MTT) Sergé et al., 2008 Contact for reagent and resource sharing 'Further information and requests for resources and reagents should be directed to and will be fulfilled by the Lead Contact, Ibrahim Cisse ( icisse@mit.edu ) Experimental model and subject details Cell lines were generated from MCF-10A (human breast epithelial) cells grown in 50:50 DMEM/F-12 medium supplemented with 5% horse serum, 20 ng/ml epidermal growth factor, 0.5 μg/ml hydrocortisone (Sigma Aldrich), 10 μg/ml human insulin (Sigma Aldrich), and 100 ng/ml cholera toxin (Sigma Aldrich). In all cases, medium was supplemented with Penicillin-Streptomycin and incubated at 37°C in an atmosphere of 5% CO 2 in a water-saturated atmosphere. For the Synphilin-Dendra2 cell line – The retroviral expression construct with C-terminally tagged Synphilin one sub cloned into pCXbsr vector described previously ( Zaarur et al., 2008 ) was used with EGFP at the C-terminus of the construct replaced with Dendra2, PCR cloned from the P-Dendra2C plasmid purchased from Clontech, USA. For the alpha Synuclein–Dendra2 cell lines – alpha Synuclein gene was copied by PCR from Addgene plasmid #51437 and cloned into P-Dendra2C plasmid purchased from Clonetech, USA. For MCF10A –alpha Synuclein cell line – alpha Synuclein-Dendra2 plasmid, was transiently transfected using extremegene9 and selected using Kanamycin resistance cassette in MCF10A (ATCC, USA) cells. The cell line was tested for mycoplasma contamination by the high-throughput sequencing facility at the Koch Institute using the Lonza MycoAlert Plus kit. The cell line tested negative for mycoplasma contamination. Cell line identity was authenticated by ATCC using STR profiling, and gave a 94% match to ATCC cell line CRL-10317(MCF10A). For Neuro2A- alpha Synuclein-Dendra2 control – alpha Synuclein-dendra2 plasmid, described above was transiently transfected using extremegene9 and selected using Kanamycin resistance cassette in Mouse neuroblastoma cell line - Neuro2A (CCL-131, ATCC, USA) Neuro2A was maintained in culture in growth medium consisting of 45% of DMEM high glucose medium w/L-Glutamine (GIBCO, USA), 45% of OptiMEM1 medium (GIBCO, USA) and 10% of Fetal bovine serum (GIBCO, USA) Supplemented by Penicillin-Streptomycin and incubated at 37C in an atmosphere of 5% CO 2 in a water saturated atmosphere. Differentiation to neuronal state was achieved by simultaneous lowering of serum content to 1% and addition of 0.5 mM dbcAMP (Sigma Aldrich, USA) as suggested in ATCC product manuals. In 2 days of growth, distinctly neuronal morphology was established in ~75% of the cells in culture and alpha Synuclein expression was observed throughout the cell but was enhanced at the tips of the finger-like processes of the cell. The neuronal state of N2A cells under dbcAMP differentiation has been established in the literature ( Tremblay et al., 2010 ) Method details Genetic and pharmacological treatments The various pharmacological and genetic stresses were applied as follows- Naïve (unstressed) growth – cells grown in the culture medium described above were imaged without any stress. This condition was measured as control along with every other stress and on its own on three separate occasions (independently cultured and plated imaging dishes). Proteasome inhibition – cells were incubated for 0 to 4 hr using 2 μM MG132 (Sigma Aldrich, USA) in normal growth medium. Additional tests were done with lower concentrations and slightly longer incubation times, 500 nM MG132 was the lowest attempted concentration that allowed aggresome formation. This stress was measured on three separate occasions (independently cultured and plated imaging dishes). Rapamycin incubation: Cells were incubated for 12 hr in normal growth medium supplemented with 100 nM rapamycin (Sigma Aldrich, USA) after being plated on the imaging coverslip. This stress was measured on two separate occasions (independently cultured and plated imaging dishes). Cycloheximide incubation: Cells were incubated in normal growth medium supplemented by 500 μg/ml of Cycloheximide for 3 hr. This experiment was repeated on two occasions (independently cultured and plated imaging dishes) Ver155008 incubation: Cells were incubated in normal growth medium supplemented by concentrations up to 50 μM in DMSO alongside DMSO control. Incubation was done for 3 hr and 9 hr. Amino acid substitution: Cells were incubated for 3 hr in normal growth medium containing 5 mM Azetidine-2-carboxylic acid (Sigma Aldrich, USA). This stress was measured on its own on two separate occasions separate occasions (independently cultured and plated imaging dishes), and also as control dish for combination of amino acid substitution and proteasome inhibition on two separate occasions (independently cultured and plated imaging dishes). RUVBL depletion: For siRNA transfection, we used Lipofectamine RNAiMAX (Invitrogen) and followed the manufacturer’s reverse-transfection protocol. For a well on a 24-well plate, we mixed 0.4 μl of the reagent with 2 μl of 10 μM siRNA in 100 μl of OptiMEM and added the mixture to 400 μl of a cell suspension in the well. 24–28 hr later the transfection was stopped and the cells were plated for an experiment conducted the next day. We used the following siRNAs purchased from Dharmacon: siGENOME Non-Targeting siRNA #5 and siGENOME RUVBL1 siRNA (D-008977–04) this stress was measured on two separate occasions (independently cultured and plated imaging dishes).
Cellular fixation
Fixation was carried out by 4% Paraformaldehyde (Electron Microscopy Sciences, USA) for 15 min at room temperature. In tests to investigate possible fixation artefacts we varied fixation Paraformaldehyde concentrations and temperatures including a variety of fixation timescales from fixation in. 05% paraformaldehyde at 4C for 16 hr to the conventional fixation for 15 min. Cells were then mostly imaged immediately after fixation but were never stored longer than 5 days before imaging. The storage was at 4C under Phosphate buffered saline in dark conditions. There was no noticeable difference between cells imaged immediately after fixation and a few days after. Different fixation rates showed no difference in the resulting cluster size distributions: Imaging Super-resolution imaging For imaging, Cells were plated on 25 mm round glass coverslips (CS-25R) from Warner Instruments (Hamden, CT) for 12–24 hr in the specified growth conditions. Cells were either fixed and imaged or imaged live after reaching 50–75% confluence. All imaging was carried out in Leibowitz’s L-15 medium. To conduct PALM Super resolution imaging, we used an optical system built using a Nikon Eclipse Ti microscope with a 100 × oil immersion objective (NA 1.40). Pre-converted Dendra2 was excited by a 488 nm laser line. Photo-activation of Dendra2 was carried out with a 405 nm laser line and in the post-converted state Dendra2 was excited by a 561 nm laser line. These laser lines were, expanded, re-collimated and focussed on the back focal plane of the Microscope in an external optical path using an achromatic beam expander (AC254-040-A and AC508-300-A, from THORLABS, Newton, NJ) and an achromatic converging lens (#45–354, from Edmund Optics, Barrington, NJ). Image data was collected using an Andor iXon Ultra 897 EMCCD camera. The laser power densities used for post-converted Dendra2 were 0.5 W/cm2 (405 nm) and 3.2 kW/cm2 (561 nm) on the image plane. For live cell imaging the L15 media was supplemented with 10% Fetal Bovine Serum (Thermo Fisher). For both live and fixed cell imaging, the cells were maintained at 37°C in a temperature controlled platform (InVivo Scientific) on the microscope stage during image acquisition. Z-position of the microscope stage was maintained during acquisition using the Perfect Focus System (PFS) on the Nikon Ti Eclipse. For fixed cell super-resolution imaging, movies with 10,000 frames, each averaged over 50 ms of exposure time, were acquired with both the excitation and photo-converting lasers on continuously. Lattice light sheet imaging For Lattice Light Sheet Microscopy ( Chen et al., 2014 ), cells were plated on gelatine-coated coverslips 24–48 hr before imaging and grown as described above. Imaging took place in L15 medium supplemented with 10% FBS. A lattice light sheet consisting of 61 Bessel beams was generated with an annulus of inner/outer numerical aperture NA 0.44/0.55. Illumination power was 1.3 mW measured before the illumination objective. Volumetric image data with a temporal resolution of 15 s/volume (300 frames) was acquired by stepping cells through the light sheet in intervals of 0.3 µm with 50 ms exposure time using a sCMOS camera (Orca Flash v4.2, Hamamatsu). Images were processed (deskewed) using a modified version of MATLAB (The Mathworks) code supplied by Chen et al. (2014) . Analysis was performed on maximum intensity projections of images stacks.
Super-resolution reconstruction
To identify single molecules in raw images of photo-converted Dendra2 fluorescence, the intensity signals were analysed using an adapted version of the multiple-target tracking algorithm (MTT) ( Sergé et al., 2008 ) then we used our open software qSR for visualization, super-resolution reconstruction and DBSCAN. Briefly, for each frame, the point-spread function (PSF) of spatially separated individual fluorophores was detected and fitted to a two-dimensional Gaussian distribution. The centre of the fit yielded the position of single molecules with nanometre accuracy. Super-resolution reconstruction images were generated by superimposing a 2D Gaussian curve with the same intensity value central position and standard deviation as found by the fitting procedure. Finally, the positions of single molecules were fed into the DBSCAN ( Ester et al., 1996 ) implementation custom written to extract meaningful distribution functions from the resulting data. Representative super resolved reconstructions along with zoom-ins showing DBSCAN efficacy in all measured conditions are shown in Figure 1—figure supplement 1 .
Quantification and analysis DBSCAN image analysis
DBSCAN, density-based scanning is a powerful computational technique for identifying correlations in a variety of data ( Ester et al., 1996 ). Using two user chosen parameters, m and r , the algorithm combs through a data set of spatial coordinates – corresponding here to the super resolved localizations from Dendra2 – classifying the points as belonging to clusters if there are at least m points from that cluster within a radius r of the point. Our implementation was included in Andrews et al. (2018) and Andrews et al. (2017) . Parameter choice will depend on the total density of localizations and the relative strength of local density fluctuations constituting clusters, both of these are influenced by imaging conditions. Therefore, parameters must be chosen by careful comparison to an unclustered control dataset acquired keeping total density of localizations as close to constant as possible. Across all data sets we consider the first 10,000 frames (50 ms integration time) for each cell in all experimental treatments and with constant imaging conditions. We chose r as 40 nm and m as 10. Our choice of parameters was based on running the algorithm on cells transfected with plain Dendra2 as our unclustered control. While super-resolution maps with ~50000 localizations in ~ ( 25 μ m ) 2 area for Dendra2 cells gave between 50 and 150 clusters/cell, with the same localization density in Synphilin-Dendra2 cells we found of the order of 1000 clusters per cell. Changing r and m by a factor of 2 did not significantly affect the number of clusters found. Thus our parameter choice (and factors of two on either side of our parameter choice) was effectively eliminating noise and not missing clusters. Lastly, we visually inspected the localization maps and DBSCAN cluster allocations and never encountered a problem. Representative super resolved reconstructions along with zoom-ins showing DBSCAN efficacy in all measured conditions are shown in Figure 1—figure supplement 1 . Analysis of cluster size distributions (Super-resolution) Computation of the cluster size distribution functions was carried out in the following steps: DBSCAN was run on 10,000 frames for each cell in a given experimental condition. For each cluster identified by DBSCAN, the number of localizations making up the cluster and their spatial spread as estimated by drawing a convex hull around the points (Radius R ) were tabulated. Data from all cells in similar conditions were collated. Since our uncertainty in super-resolved molecular positions is ~20 nm we discarded all clusters (collections of points with at least m = 10 neighbours) with diameter spanning less than 50 nm. Next for each cluster we calculated the quantity n = ( R i n n m / 1 n m ) 3 . In each experimental condition, we have ~ 10000 clusters collated from ~ 10 cells. In data from untreated cells, > 90% of these clusters had n values less than n = 2 × 10 6 . In highly clustered experimental data sets such as 180 minutes post proteasome inhibition, the proportion of large clusters increased. However, the majority of clusters were still less than n = 2 × 10 6 . The value of n corresponding to a critical size was always less than n = 2 × 10 6 depending on the experimental condition. The cluster size distribution functions in the main text and this supplement were fit to the theoretical form solely in the sub-critical range where the theory is valid (which is also where the majority of our cluster data lay). The cluster size distribution functions in each experimental condition were computed from normalized histograms of the collated cluster n values from that experimental condition with a constant bin size across all data sets ( Δ n = 3 × 10 4 ). The main concern is to have enough data to be able to choose sufficiently small bins to effectively sample the fastest variations in the underlying distribution function without hitting a noise floor. This is the Nyquist criterion for binning. With more than 5000 clusters ranging for each condition from n = 1.5 × 10 4 to n = 2 × 10 6 (the sub-critical regime) we had sufficient data that even bins of size Δ n = 5000 – dividing the sub-critical regime into ~400 bins – resulted in histograms that were noiseless enough to fit and sampling the distribution very accurately. Data reported is with Δ n = 3 × 10 4 the results of fitting the distribution function are insensitive to changing the bin size down to Δ n = 5000 ( < 2 % change in estimated R c ). For ease of presentation, we note that the probability distribution function is P r o b n = A e - ∆ G ( n ) where A enforces normalization. However A is determined by the fit parameters a and b since ∫ 0 n c P r o b n = 1 implies = 1 / ∫ 0 n c e - ∆ G ( n ) . Then - L o g ( P r o b n = ∆ G n - L o g ( A ) , where Log refers to the natural log (base ‘e’). Therefore, in order to read the nucleation barrier directly from the –Log(P(n) curve, we must add an offset L o g ( A ) . Equivalently this amounts to a self-consistent normalization of our experimentally measured distribution function such that A is 1. This procedure just contributes an offset to the –Log(P(n)) curves without affecting critical radius and permits ease of presentation as it allows direct reading of the barrier height from the – Log(P(n)) graphs. Fitting of the experimentally measured cluster size distribution functions to the theoretical functional form was carried out using the Mathematica implementation of least squares linear regression routine included in the LinearModelFit command. Errors in values of R c reported standard error of the mean from the best fit (computed, for instance using the MeanConfidenceBand object property of the LinearModelFit package in Mathematica ). The range of n values for fitting data is important to determine. The theoretical form is only expected to hold below the critical size and diverges above the critical size. This sets an upper bound on range of data to use. However, the more data points you include the tighter the error bars on the fit parameters. The fitting range was determined self consistently by fitting data up to that value of n which was 80% of the critical radius predicted by the fit. In practice, this amounted to fitting up to n ∼ 8 × 10 5 for the case of 180 min of proteasome inhibition (when the predicted critical size was n ~ 1 × 10 6 ) and fitting up to n ~ 1.5 × 10 6 for the case of untreated cells where the critical size corresponded to n ~ 2 × 10 6 . The larger error bars in the 3 hour proteasome inhibited case than in the untreated cell reflect both the greater spread in the data (fewer total clusters) and smaller available fitting range. The residuals in Fig. 1 depend slightly on the data range used to fit and subtract the n 2/3 term and consequently only qualitative conclusions (such as the sign of slope) should be drawn from relative comparisons between data sets fit identically. Our procedure was to always fit the range n < 2 × 10 5 in all data sets and using bin size 5000 in this range. The distribution of sub-critical cluster sizes P(n) is a Boltzmann distribution only in terms of the extensive variable n t o t , the total number of polypetides in the cluster. Our analysis has been in terms of the defined parameter n = ( R 1 n m ) 3 . As defined, n should be proportional to the total number of molecules in the cluster as we image only a fraction of fluorescently detected molecules which constitute only one species in our aggregates ( Figure 1—figure supplement 3 ). However, the critical radius and nucleation barrier may be computed immune to a multiplicative constant in the definition of n = ( R 1 n m ) 3 . This can be seen by asking what would happen were we to misrepresent the cluster size n t o t by an arbitrary multiplicative factor k. Then n t o t , the real cluster size would be replaced by n ' = k n t o t . The free energy measured in terms of n ' would be Δ G ( n ′ ) = − b ′ n ′ + a ′ n ′ 2 / 3 . The relation between primed parameters and the unprimed – true – parameters would be b = b ' k and a = a ' k 2 / 3 . Now the true value of the barrier height is Δ G ( n t o t c ) = − b n t o t c + a n t o t c 2 / 3 with n t o t c = 2 a 3 b 3 the critical size. If we used the scaled variables b’ and a’ we would get Δ G ( n c ′ ) = − b ′ n c ′ + a ′ n c ′ 2 / 3 = - b ' 2 a ' 3 b ' 3 + a ' ( 2 a ' 3 b ' 3 ) 2 / 3 On substitution, the factor k cancels out to yield Δ G ( n c ′ ) = − b n c + a n c 2 3 = Δ G ( n c ) . That is, even if we had cluster size parameter n incorrect by a multiplicative factor, we can measure the barrier height (in terms of KT assuming ambient temperature as the relevant factor for thermalization). Similarly any multiplicative error made in converting R to n’ can be shown to cancel when converting n ' c back to Rc. For estimation of critical radius, we used the turning point of the fit function Δ G (n) to estimate critical size and then converted from n c to R c This procedure makes the determination of R c independent of any multiplicative factor in the definition of n as this same factor appears in n c and is cancelled out on going back from n c to R c . Analysis of live cell (light sheet) data Light sheet data was analyzed to extract both distribution of cluster intensity and time evolution. To calculate the intensity of the clusters in living cells, a three-dimension segmentation was performed using standard Mathematica functions (using the MorphologicalComponents and ComponentsMeasurements commands). For the instantaneous estimation of clusters sizes, only the first time point of each time series was analysed as this corresponds to the least photobleaching at this stage. To aid the segmentation, a 20-pixel background subtraction was performed on each image plane, however the actual intensity was calculated from the original unprocessed 3D stack using the total intensity within the segmented domain coordinates. Approximately 100–200 clusters were found in each cell. A control experiment was conducted by bleaching cells for 20 min when only single molecules (with single steps blinking and photo-bleaching) were visible – a 20 pixel background subtraction was used and the intensity of ~100 single molecules were measured. The resulting average single molecule intensity (24 counts) was used to convert the cluster intensities into estimated number of fluorescent molecules. The calculated cluster size converted into estimated number of fluorescent molecules was binned in bins of 10 (binsize = 20 did not change the shape of the curve but at binsize = 5 there was noticeably more noise) and plotted as in Figure 4 in the main text and fit to the same functional form as for the fixed cell super-resolution data. To obtain the time trace of clusters sizes two challenges were considered: photo bleaching by the light sheet illumination, and large scale motion of clusters during the measurement interval. While the intensities in the first frame – used for the cluster size distribution of Figure 4 - are unaffected by bleaching, the intensity values in subsequent frames – used in Figure 5 – are affected. In order to correct for photo bleaching the average intensity of an imaging plane was measured as a function of time, and fit to an exponential. The exponential fit was used to correct the intensities at each time point. The data was acquired with very fine Z- steps (300 nm step size); larger step sizes caused the bleaching rate to be bi-exponential, putatively due to leaving Z-sections differentially bleached. We can see that our bleach correction is largely effective by noting that that different clusters in the same region of the same cell had different kinetics, some rising and some falling in intensity over the period of imaging. The motion of clusters during the measurement interval and in between time steps (15 s per cell stack) necessitated that we go through the bleach corrected light sheet movies, following individual clusters manually and using Mathematica (using the MorphologicalComponents and ComponentsMeasurements commands) based segmentation to identify coordinates for intensity calculations in ImageJ. The results from 30 such clusters are plotted in Figure 5A,B of the main text. This procedure resulted in studying clusters that were trackable for the whole movie. 10.7554/eLife.39695.015 Box 1. Determining the free energy from distribution of cluster sizes. Here we briefly describe how the free energy change in assembling a cluster of n molecules from the disperse phase - introduced in the main text as consisting of a surface and a bulk term – depends on system composition, how it describes behavior above and below the saturation concentration and how we can directly compute this function from experimental measurements. The equation Δ G = a n 2 / 3 ± b n presented in the main text, is a simplified equation that can be derived exactly– it consists of two terms. 1) The Surface term Δ G s u r f a c e = a n 2 / 3 represents the energetic cost of setting up an interface between the clusters and ambient solution (or equivalently the interface between two liquid phases of de-mixed components in phase separation). The prefactor a is related to the composition of the system. Consider a cluster of n molecules of volume v n = n v 1 where v 1 is the average volume taken by 1 molecule in the clustered phase. For spherical clusters of constant density v 1 = M / ρ N A (M is molar mass, ρ is density and N A is Avogadro’s number) and thus: 4 3 π R n 3 = v n a n d 4 π R n 2 = A n Therefore, R n = 3 v 1 4 π 1 / 3 n 1 / 3 a n d A n = 36 π 1 / 3 v 1 2 / 3 n 2 / 3 If the energy per unit area of the interface is σ – then the surface energy term is Δ G s u r f a c e = σ A n = σ ( 36 π ) 1 / 3 v 1 2 / 3 n 2 / 3 So that we recover the form Δ G s u r f a c e = a n 2 / 3 . The prefactor a = σ 36 π 1 / 3 v 1 2 / 3 depends on the specific interactions and geometric details of the interface between the two phases. 2) The bulk term, Δ G b u l k = ± b n represents the difference in free energy between a system with all molecules in the ambient phase, and a system with n molecules in the clustered phase. In this case, it can be shown ( Abraham, 1974 ) that for a cluster of n molecules Δ G b u l k = − Δ μ n with Δ μ = k B T L o g ( c a m b c s a t ) . Where c a m b is the ambient monomer concentration and c s a t is the saturation concentration - the concentration that would be at equilibrium with the clustered phase. Log refers to the natural logarithm (base ‘e’). Δ μ depends on both the ambient concentration of monomers and the interactions of the monomers in the two phases and changes sign at c a m b = c s a t . Δ G b u l k = ± b n with the sign depending on whether c a m b < c s a t (positive sign) or c a m b > c s a t (negative sign) Therefore, for a given set of interactions, the ambient concentration alone can control which of the two phases is favoured and by how much. The system is referred to as sub-saturated when c a m b < c s a t , and thus the bulk term Δ G b u l k = + b n . On the other hand super-saturated systems, c a m b > c s a t , result in a bulk term Δ G b u l k = − b n . Therefore, if the system is sub-saturated Δ G = a n 2 / 3 + b n , both the terms add so that the free energy continuously increases with increasing cluster size n. This energy function has no maximum, and therefore there is no nucleation barrier beyond which clusters stably grow. Any cluster formed is energetically costly, and bigger clusters are increasingly more costly. Clusters that form in sub-saturated state will be driven to dissipate. In a sub-saturated system, the distribution of cluster sizes is given by P n = A e - ∆ G / k B T (where A is a factor that normalizes the probability distribution), and the free energy Δ G ( n ) = − k B T L o g ( P ( n ) ) (offset by a constant due to the normalization factor A, see Materials and methods). On the other hand, if the system is super-saturated, Δ G = a n 2 / 3 − b n with the two terms in Δ G having opposite signs. This balance between a positive surface energy and a negative bulk contribution leads to a maximum in the free energy. An energy barrier and the critical cluster size for the system are at that point where the free energy function is maximal: n C = 2 a 3 b 3 Below this critical size, clusters formation and growth is energetically costly (positive slope Δ G ), and such 'sub-critical' clusters are thermodynamically driven to dissolve. Above this critical size, cluster growth is energetically favoured (negative slope Δ G ; if a cluster grows to a size greater than the critical size, it will grow at the cost of the monomer pool (and hence reduce the ambient concentration). For the duration while a super-saturated concentration is maintained, the theory has a simple prediction for the size distribution of sub-critical clusters. The sub-critical cluster size distribution is a Boltzmann distribution ( Slezov, 2009 ) (but with the negative sign of the bulk term in Δ G in contrast to the sub-saturation distribution). P ( n ) = A e − Δ G / k B T (where A is a factor that normalizes the probability distribution) and Δ G ( n ) = − k B T L o g ( P ( n ) ) (offset by a constant due to the normalization factor A, see Materials and methods). Such super-saturated states are normally transient. Given the interactions and the ambient concentrations, the free energy change favors the addition of each molecule to a super-critical cluster, thereby continuously decreasing the ambient concentration until it reaches the saturation level. Therefore in unusual cases the super-saturated state could be maintained if super-saturated clusters were removed from the system, this is the principle behind the so-called Szilard model.
Experimental model and subject details
Cell lines were generated from MCF-10A (human breast epithelial) cells grown in 50:50 DMEM/F-12 medium supplemented with 5% horse serum, 20 ng/ml epidermal growth factor, 0.5 μg/ml hydrocortisone (Sigma Aldrich), 10 μg/ml human insulin (Sigma Aldrich), and 100 ng/ml cholera toxin (Sigma Aldrich). In all cases, medium was supplemented with Penicillin-Streptomycin and incubated at 37°C in an atmosphere of 5% CO 2 in a water-saturated atmosphere. For the Synphilin-Dendra2 cell line – The retroviral expression construct with C-terminally tagged Synphilin one sub cloned into pCXbsr vector described previously ( Zaarur et al., 2008 ) was used with EGFP at the C-terminus of the construct replaced with Dendra2, PCR cloned from the P-Dendra2C plasmid purchased from Clontech, USA. For the alpha Synuclein–Dendra2 cell lines – alpha Synuclein gene was copied by PCR from Addgene plasmid #51437 and cloned into P-Dendra2C plasmid purchased from Clonetech, USA. For MCF10A –alpha Synuclein cell line – alpha Synuclein-Dendra2 plasmid, was transiently transfected using extremegene9 and selected using Kanamycin resistance cassette in MCF10A (ATCC, USA) cells. The cell line was tested for mycoplasma contamination by the high-throughput sequencing facility at the Koch Institute using the Lonza MycoAlert Plus kit. The cell line tested negative for mycoplasma contamination. Cell line identity was authenticated by ATCC using STR profiling, and gave a 94% match to ATCC cell line CRL-10317(MCF10A). For Neuro2A- alpha Synuclein-Dendra2 control – alpha Synuclein-dendra2 plasmid, described above was transiently transfected using extremegene9 and selected using Kanamycin resistance cassette in Mouse neuroblastoma cell line - Neuro2A (CCL-131, ATCC, USA) Neuro2A was maintained in culture in growth medium consisting of 45% of DMEM high glucose medium w/L-Glutamine (GIBCO, USA), 45% of OptiMEM1 medium (GIBCO, USA) and 10% of Fetal bovine serum (GIBCO, USA) Supplemented by Penicillin-Streptomycin and incubated at 37C in an atmosphere of 5% CO 2 in a water saturated atmosphere. Differentiation to neuronal state was achieved by simultaneous lowering of serum content to 1% and addition of 0.5 mM dbcAMP (Sigma Aldrich, USA) as suggested in ATCC product manuals. In 2 days of growth, distinctly neuronal morphology was established in ~75% of the cells in culture and alpha Synuclein expression was observed throughout the cell but was enhanced at the tips of the finger-like processes of the cell. The neuronal state of N2A cells under dbcAMP differentiation has been established in the literature ( Tremblay et al., 2010 )
Method details Genetic and pharmacological treatments
The various pharmacological and genetic stresses were applied as follows- Naïve (unstressed) growth – cells grown in the culture medium described above were imaged without any stress. This condition was measured as control along with every other stress and on its own on three separate occasions (independently cultured and plated imaging dishes). Proteasome inhibition – cells were incubated for 0 to 4 hr using 2 μM MG132 (Sigma Aldrich, USA) in normal growth medium. Additional tests were done with lower concentrations and slightly longer incubation times, 500 nM MG132 was the lowest attempted concentration that allowed aggresome formation. This stress was measured on three separate occasions (independently cultured and plated imaging dishes). Rapamycin incubation: Cells were incubated for 12 hr in normal growth medium supplemented with 100 nM rapamycin (Sigma Aldrich, USA) after being plated on the imaging coverslip. This stress was measured on two separate occasions (independently cultured and plated imaging dishes). Cycloheximide incubation: Cells were incubated in normal growth medium supplemented by 500 μg/ml of Cycloheximide for 3 hr. This experiment was repeated on two occasions (independently cultured and plated imaging dishes) Ver155008 incubation: Cells were incubated in normal growth medium supplemented by concentrations up to 50 μM in DMSO alongside DMSO control. Incubation was done for 3 hr and 9 hr. Amino acid substitution: Cells were incubated for 3 hr in normal growth medium containing 5 mM Azetidine-2-carboxylic acid (Sigma Aldrich, USA). This stress was measured on its own on two separate occasions separate occasions (independently cultured and plated imaging dishes), and also as control dish for combination of amino acid substitution and proteasome inhibition on two separate occasions (independently cultured and plated imaging dishes). RUVBL depletion: For siRNA transfection, we used Lipofectamine RNAiMAX (Invitrogen) and followed the manufacturer’s reverse-transfection protocol. For a well on a 24-well plate, we mixed 0.4 μl of the reagent with 2 μl of 10 μM siRNA in 100 μl of OptiMEM and added the mixture to 400 μl of a cell suspension in the well. 24–28 hr later the transfection was stopped and the cells were plated for an experiment conducted the next day. We used the following siRNAs purchased from Dharmacon: siGENOME Non-Targeting siRNA #5 and siGENOME RUVBL1 siRNA (D-008977–04) this stress was measured on two separate occasions (independently cultured and plated imaging dishes).
Additional files 10.7554/eLife.39695.016 Transparent reporting form Data availability All data generated or analyzed during this study are included in the manuscript and supporting files. Source data files have been provided for Figures 1, 2, 3 and 4.
📊 Figures
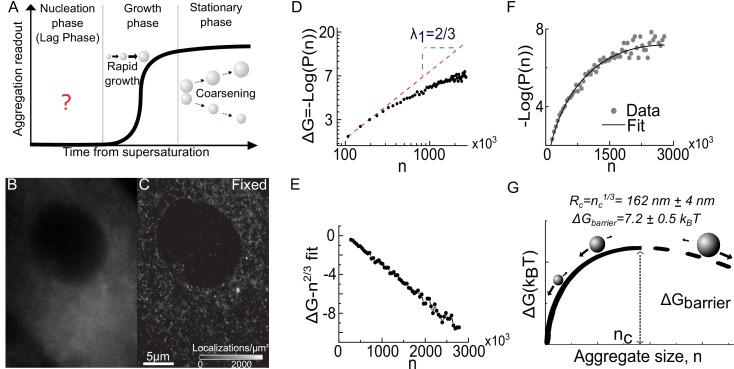
Figure 1.
Super resolution imaging of fixed cells suggests thatu00a0a condensation transition underlies aggregate formation.
( A ) Schematic of traditional experimental readouts of protein aggregation.u00a0Such measurements are blind to the nucleation phase but begin to show signal during the growth phase and stationary pha...
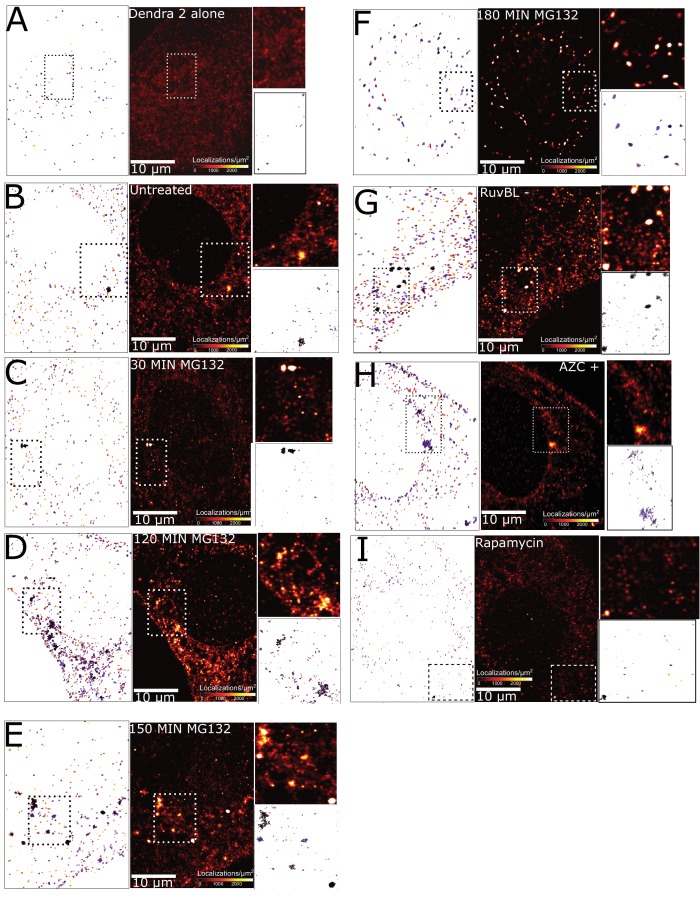
Figure 1u2014figure supplement 1.
Super-resolution imaging and cluster identification using DBSCAN.
Each subfigure contains - super-resolved reconstruction (centre) a pointillist image of clusters identified by the DBSCAN algorithm (left) and a zoomed in region with super-resolution (top right) and ...
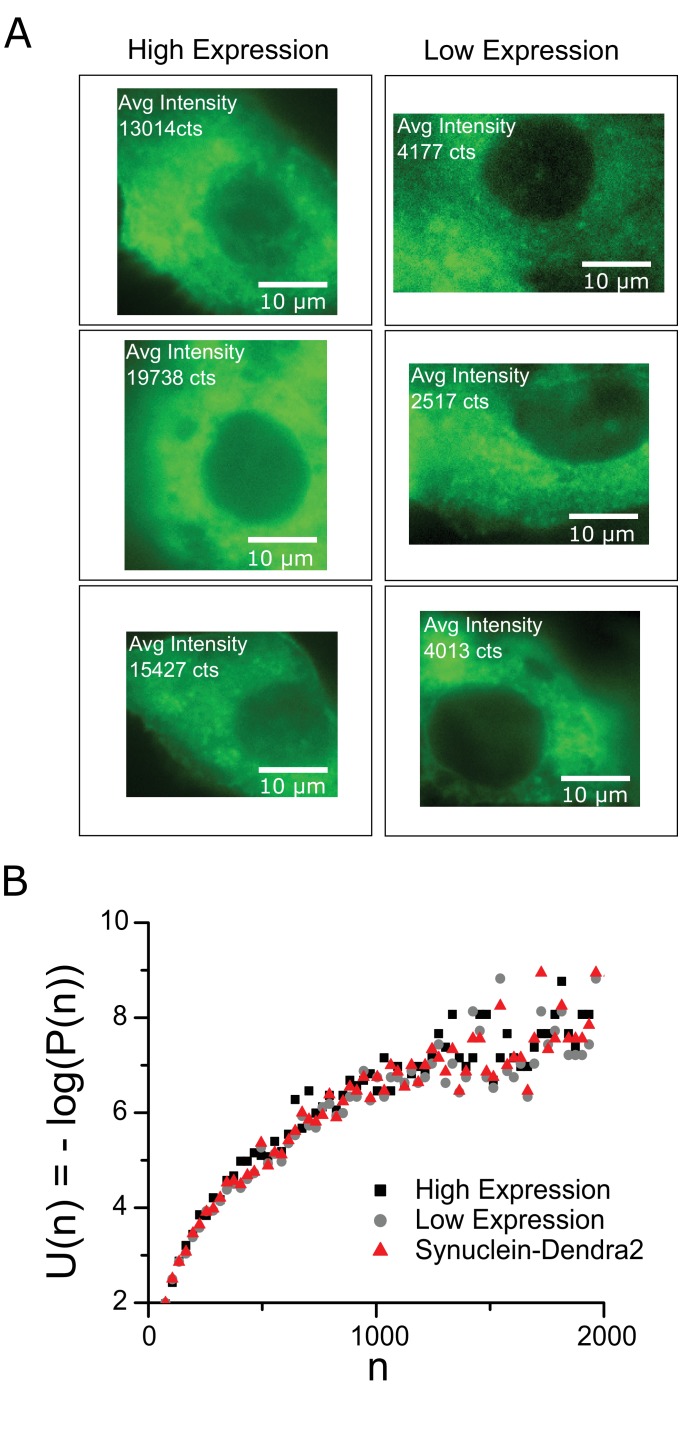
Figure 1u2014figure supplement 2.
The effect of expression level, alternative protein markers.
A Representative cells with different Synphilin expression levels u2013 Left panels, high expression level cells with average fluorescence intensityu00a0~15,000 counts (arbitrary units).u00a0Right pan...
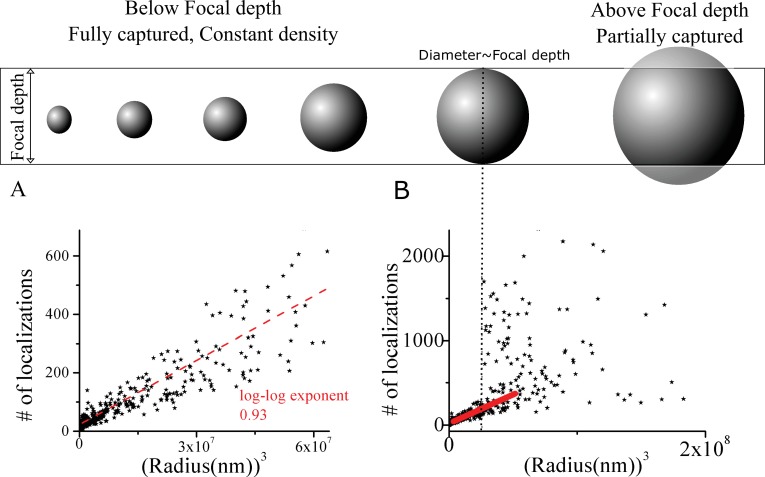
Figure 1u2014figure supplement 3.
The clusters have a well defined density.
The number of localizations assigned to individual clusters by DBSCAN versus the volume (cube of radius) over which these localizations were spread out. ( A ) For small clusters there is a distinct li...
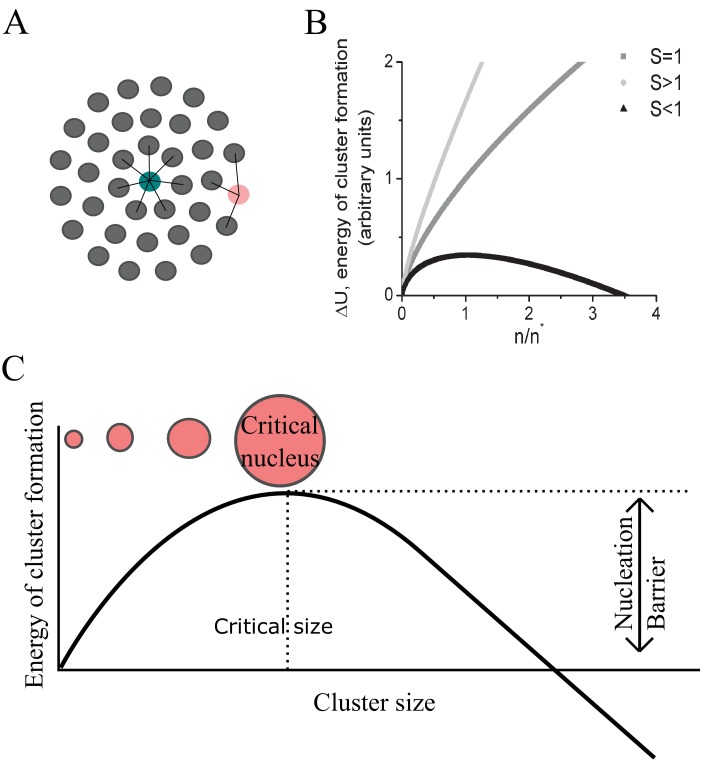
Figure 1u2014figure supplement 4.
Definition of terms in condensation theory.
( A ) Schematic showing the difference between bulk and surface interactions in the formation of a condensate.u00a0Molecules buried in the centre of a cluster contribute the full free energy differenc...
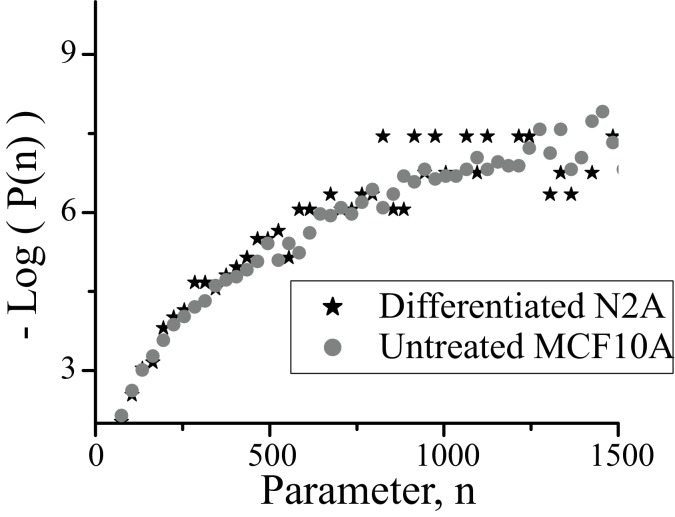
Figure 1u2014figure supplement 5.
Comparison between cluster size distributions in MCF10A and Neuro2A cell lines.
Plotted is the energy of cluster formation ( - L o g ( P ( n ) as described in Box 1 versus n for clusters in normal growth conditions for (i) MCF10A cells with clusters marked with Synphilin (circles...
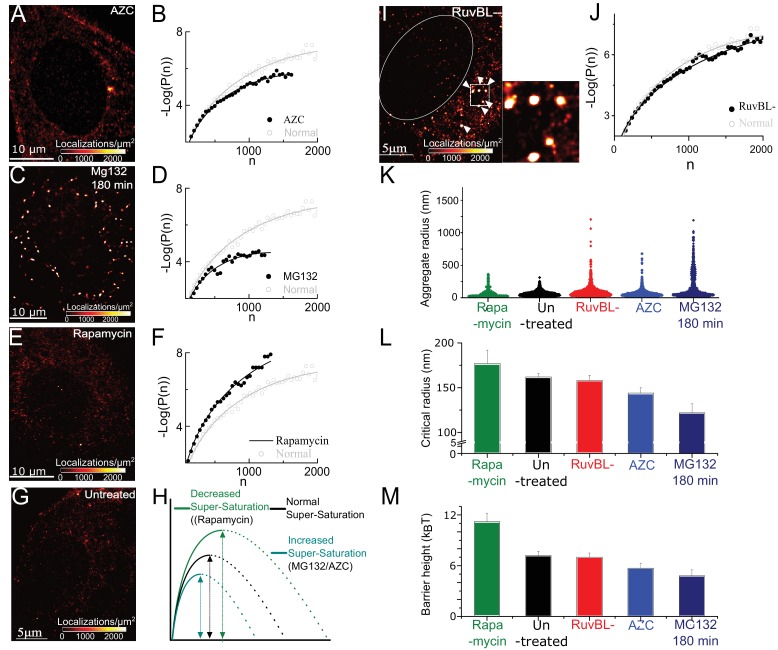
Figure 2.
Super-saturation can be tuned by the levels of endogenous aggregative polypeptides
and RuvBL-dependent mechanism clears super-critical clusters: ( Au2013F ) Representative super-resolved reconstruction and free energy functional fit for AZC- ( A and B ), MG132-( C and D ), and Rapam...
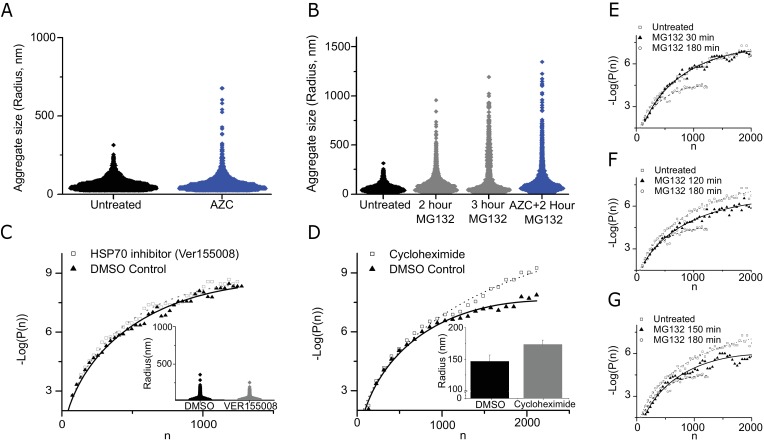
Figure 2u2014figure supplement 1.
The effect of aggregation promoting amino acid substitute (AZC), proteasome inhibitor (MG132), translation inhibitor cycloheximide and the HSP70 inhibitor (Ver155008):
( A ) Violin plots of data from untreated (Black) and amino acid substitute AZC treated (Blue) cells.u00a0Data is from 10,000 untreated clusters (10 cells) and 4000 AZC clusters (seven cells). ( B ) V...
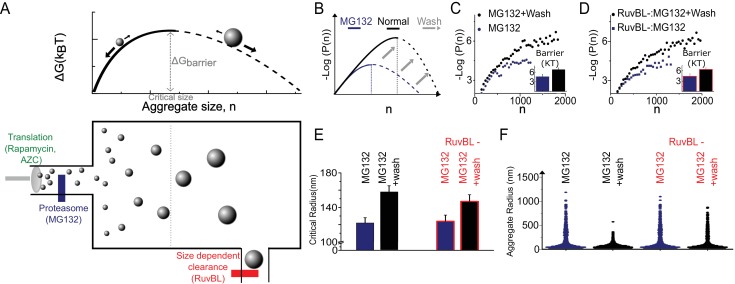
Figure 3.
The Szilard non-equilibrium steady state accounts for all genetic and pharmacological and genetic stresses.
( A ) Schematic depiction of Szilard mechanism for maintenance of super-saturated steady state by simultaneous regulation of monomer creation and super-critical elimination. The suggested mode of acti...
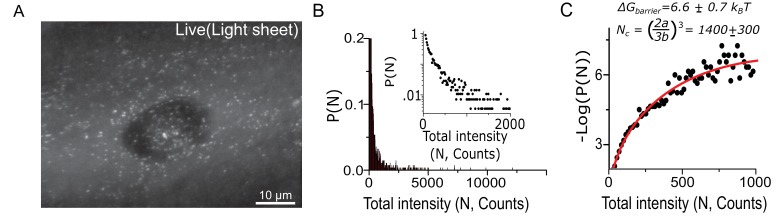
Figure 4.
Cluster size quantification in living cells corroborates fixed cell data and the estimation of surface tension at the condensate-cytoplasm interface.
( A ) 2D maximum intensity projection of 3D direct imaging of Dendra2-Synphilin1 traced aggregates in a representative cell imaged with light sheet microscope. ( B ) Using the relative intensities rat...
Video 1.
Lattice light sheet imaging of Synphilin cluster mergers in live cells - example 1.
Video 2.
Lattice light sheet imaging of Synphilin cluster mergers in live cells - example 2.
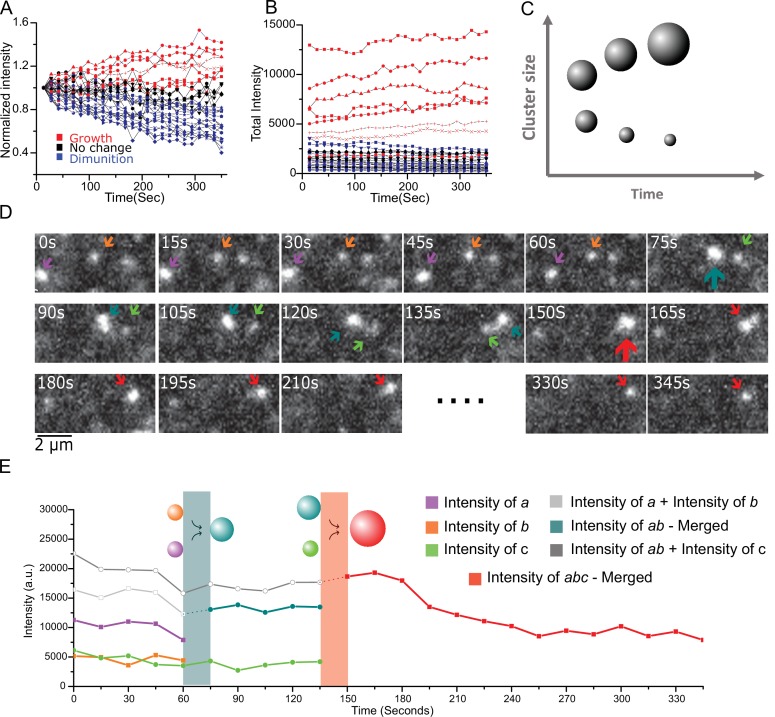
Figure 5.
Live cell imaging of single aggregates growth and shrinking dynamics show ripening and coalescence.
( A ) Aggregate growth and diminution kinetics over a period of 6 min from 30 long-lived aggregates from seven cells. Here, the intensity is normalized to the initial intensity. Color code: red are gr...
Figure images are served from the NIH/NLM PubMed Central Open Access Subset or Europe PMC; copyright remains with the publishers and authors.
💬 Discussion
0 commentsNo comments yet. Be the first to start a discussion!
Leave a Comment