Abstract
Abstract Necroptosis is a regulated form of necrosis that depends on receptor-interacting protein kinase (RIPK)3 and mixed lineage kinase domain-like (MLKL). While danger-associated molecular pattern (DAMP)s are involved in various pathological conditions and released from dead cells, the underlying mechanisms are not fully understood. Here we develop a fluorescence resonance energy transfer (FRET) biosensor, termed SMART (a sensor for MLKL activation by RIPK3 based on FRET). SMART is composed of a fragment of MLKL and monitors necroptosis, but not apoptosis or necrosis. Mechanistically, SMART monitors plasma membrane translocation of oligomerized MLKL, which is induced by RIPK3 or mutational activation. SMART in combination with imaging of the release of nuclear DAMPs and Live-Cell Imaging for Secretion activity (LCI-S) reveals two different modes of the release of High Mobility Group Box 1 from necroptotic cells. Thus, SMART and LCI-S uncover novel regulation of the release of DAMPs during necroptosis.
🔬 Techniques
💻 Software
✨ Fluorophores
🧪 Sample Preparation
🔬 Cell Lines
🏭 Microscope Brands
🧪 Reagent Suppliers
📷 Detectors
🔎 Objectives
🎨 Filters
💻 Software Details
💾 Data Repositories
🏛️ Research Organizations (ROR)
Affiliated research institutions:
📋 Methods
Reagents Murine TNF (34-8321, eBioscience), human TNF (BMS301, eBioscience), poly(I:C) (ALX-746-021, Enzo Life Sciences), Birinapant (CT-BIRI, Tetralogic Pharmaceuticals), BV6 (B4653, ApexBio), CCCP (CAS 555-60-2, Calbiochem), GSK’872 (530389, Merck), Hoechst 33342 (H3570, ThermoFisher Scientific), Nec-1 (N9037, Sigma-Aldrich), Necrosulfonamide (NSA) (ab143839, Abcam), SYTOX Green (S34860, ThermoFisher Scientific), SYTOX Orange (S34861, ThermoFisher Scientific), and zVAD (3188-v, Peptide Institute) were purchased from the indicated sources. The following antibodies used in this study were obtained from the indicated sources: anti-phospho-RIPK1 (31122, Cell Signaling, 1:1000), anti-RIPK1 (610459, BD Biosciences, 1:1000), anti-phospho-RIPK3 (57220, Cell Signaling, 1:1000), anti-RIPK3 (IMG-5523-2, Immugenex, 1:3000), anti-phospho-MLKL (62233, Cell Signaling, 1:1000), anti-MLKL (3H1, made in house, 1:1000), anti-human MLKL (ab184718, Abcam, 1:1000), anti-cleaved caspase 3 (9661, Cell Signaling, 1:1000), anti-caspase-3 (9662, Cell Signaling, 1:1000), anti-actin (A2066, Sigma-Aldrich, 1:1000), anti-cytochrome c oxygenase subunit (COX) IV (Ab16056, Abcam, 1:1000), anti-tubulin (Sigma, T-5168, 1:40,000), anti-FLAG (M2, Sigma-Aldrich, 1:1000), anti-Myc (9E10, Sigma-Aldrich, 1:1000), anti-GFP (sc-8334, Santa Cruz, 1:5000), anti-GFP (66002-1-Ig, Proteintech, 1:5000), anti-mCherry (600-401-379, Rockland Immunochemicals, 1:10), anti-HMGB1 (ab18256, Abcam, 1:1000), anti-histone H3 (ab1791, Abcam, 1:1000), and HRP-conjugated donkey anti-rat IgG (712-035-153, Jackson ImmunoResearch, 1:10,000) antibodies. HRP-conjugated sheep anti-mouse IgG (NA934, 1:10,000) and HRP-conjugated donkey anti-rabbit IgG (NA934, 1:10,000) antibodies were from GE Healthcare.
Show full methods section
Reagents Murine TNF (34-8321, eBioscience), human TNF (BMS301, eBioscience), poly(I:C) (ALX-746-021, Enzo Life Sciences), Birinapant (CT-BIRI, Tetralogic Pharmaceuticals), BV6 (B4653, ApexBio), CCCP (CAS 555-60-2, Calbiochem), GSK’872 (530389, Merck), Hoechst 33342 (H3570, ThermoFisher Scientific), Nec-1 (N9037, Sigma-Aldrich), Necrosulfonamide (NSA) (ab143839, Abcam), SYTOX Green (S34860, ThermoFisher Scientific), SYTOX Orange (S34861, ThermoFisher Scientific), and zVAD (3188-v, Peptide Institute) were purchased from the indicated sources. The following antibodies used in this study were obtained from the indicated sources: anti-phospho-RIPK1 (31122, Cell Signaling, 1:1000), anti-RIPK1 (610459, BD Biosciences, 1:1000), anti-phospho-RIPK3 (57220, Cell Signaling, 1:1000), anti-RIPK3 (IMG-5523-2, Immugenex, 1:3000), anti-phospho-MLKL (62233, Cell Signaling, 1:1000), anti-MLKL (3H1, made in house, 1:1000), anti-human MLKL (ab184718, Abcam, 1:1000), anti-cleaved caspase 3 (9661, Cell Signaling, 1:1000), anti-caspase-3 (9662, Cell Signaling, 1:1000), anti-actin (A2066, Sigma-Aldrich, 1:1000), anti-cytochrome c oxygenase subunit (COX) IV (Ab16056, Abcam, 1:1000), anti-tubulin (Sigma, T-5168, 1:40,000), anti-FLAG (M2, Sigma-Aldrich, 1:1000), anti-Myc (9E10, Sigma-Aldrich, 1:1000), anti-GFP (sc-8334, Santa Cruz, 1:5000), anti-GFP (66002-1-Ig, Proteintech, 1:5000), anti-mCherry (600-401-379, Rockland Immunochemicals, 1:10), anti-HMGB1 (ab18256, Abcam, 1:1000), anti-histone H3 (ab1791, Abcam, 1:1000), and HRP-conjugated donkey anti-rat IgG (712-035-153, Jackson ImmunoResearch, 1:10,000) antibodies. HRP-conjugated sheep anti-mouse IgG (NA934, 1:10,000) and HRP-conjugated donkey anti-rabbit IgG (NA934, 1:10,000) antibodies were from GE Healthcare.
Generation of murine and human SMART
A backbone vector for a FRET biosensor, 3536NES was kindly provided by M. Matsuda ( http://www.fret.lif.kyoto-u.ac.jp/ ). To generate FRET biosensors for necroptosis, fragments of murine MLKL cDNAs were amplified by PCR using the following primers. α19: 5′-GGCTCGAGAGGCCGAAAGTGTTGGAATAGTG-3′ and 5′-TAGCGGCCGCACCTTCTTGTCCGTGGATTCTT-3′; α14: 5′-GGCTCGAGCAGGCCGAAAGTGTTGGAATAGTGAGG-3′ (675F) and 5′-TAGCGGCCGTCTTTGCTGTCCGGCT-3′ (1056R); α59: 5′-GTTCCTCGAGTCAACGATATATGTCTCCCCTGAG-3′ and 5′-ACCATGCGGCCGCCCTTCTTGTCCGTGGATTCTTC-3′. A linker sequence between Ypet and ECFP of 3536NES was replaced with respective cDNA fragments. Primers used in the study were purchased from Eurofins Genomics. Mutations of S228A, S248A, F234E, and 3ST4A were generated by introducing respective mutations into α14 by PCR-based mutagenesis using the following primers as described previously 46 . S228A: 5′-CAGGCCGAAGCTGTTGGAATAGTGAGGTTCA-3′ and 5′-CAACAGCTTCGGCCTGCTCGAGGTACA-3′; S248A: 5′-AATATTTTGCGTATATTTGGGATTTGCATTGATCA-3′ and 5′-GGGAGCATCGAATTTCTTCATGGTTTTGAT-3′; F234E: 5′-GCGAGACTTTCAATGACGAGATCAAAACCATGAAG-3′ and 5′-GAACTATTCCAACACTTTCGGCCTGGG-3′; 3ST4A: 5′-GGGCAGCAAAGGCCACTAAAGCAGAGAGAT-3′ and 5′-GGGCGATGGCATTCTGTCCGGAACCACCAG-3′. Amino acids 257–335 and 293–329 of α14 were replaced with 29 and 9 repeats of SAGG, respectively, resulting in the generation of Δα2α3 and Δα3 (Figure S2 ). Briefly, fragments corresponding to the α1 and α4 helices of murine MLKL were amplified by PCR using the following primers, respectively. α1: 675F and 5′-ATGGTACCAAATATACGCAAGATGTTGG-3′; α4: 5′-GTTGTTTCCGGATTTGAGTTAAGCAAAACA-3′ and 1056R. Amplified fragments of α1 and α4 helices were ligated into Xho I -Kpn I and Bsp EI -Not I sites of 3536NES, respectively, in which contained oligonucleotides encoding 29 repeats of SAGG, resulting in the generation of Δα2α3. To replace α3 helix (293–329) with 9 repeats of SAGG, oligonucleotides were synthesized (Supplementary Table 1a ), and ligated into the Xho I -Hin dIII sites of α14 (Δα3). To generate Δabc, we first created Sac I and Fsp I sites in α14 by generating mutant oligonucleotides, resulting in the generation of α14(+). We then synthesized oligonucleotides to replace amino acids spanning 243–279 (a), 287–293 (b), and 308–332 (c) with 9, 2, and 6 repeats of SAGG (Supplementary Table 1b ), respectively, and ligated into the Xho I -Fsp I sites of α14(+) (Δabc). The Xho I -Sac I and Xho I -Fsp I fragments of α14(+) were replaced with the corresponding fragments of Δabc, resulting in the generation of Δa and Δab, respectively. To generate hSMART, the cDNA fragments of human MLKL containing α1 to α5 helices were amplified by RT-PCR from mRNA of HeLa cells as a template using the following primers (5′-GTTCCTCGAGCAGGCTGGCAGCATTGCAATAGTGA-3′ and 5′-GTTCCTCGAGCAGGCTGGCAGCATTGCAATAGTGA-3′). Amplified fragments were ligated into 3536NES, resulting in the generation of hα15. Then, oligonucleotides where the a and b regions corresponding to murine MLKL were replaced with SAGG repeats were synthesized and ligated into Xho I and Stu I sites of hα15, resulting in the generation of hSMART (Supplementary Table 1c and Supplementary Fig. 2c ). Cell culture and transfection L929, HT29, HEK293T, and HaCaT cells were obtained from ATCC. aMoC1, murine colonic epithelial cells, were previously described 23 . Wild-type and Mlkl −/− MEFs were prepared from mice of the indicated genotype at E14.5 after coitus using as a standard method. MEFs were immortalized by transfection with a pEF321-T vector that encodes SV40 large T antigen (provided by S. Sugano) 47 . L929 cells were maintained with RPMI containing 10% fetal bovine serum (FBS). Wild-type and Mlkl −/− MEFs, HEK293T, aMoC1, HT29, and HaCaT cells were maintained with DMEM containing 10% FBS. To generate stable transfectants of murine and human SMART, we inserted murine and human SMART cDNAs into a transposon vector, pT2KXIG (provided by K. Kawakami) 48 . We then transfected murine and human cells with pT2KXIG-mSMART and pT2KXIG-hSMART along with pCAGGS-T2TP encoding a transposase by electroporation using the Gene Pulser II (Bio-Rad), respectively. After electroporation, ECFP-positive cells were sorted by BD FACSAriaTM III (BD Biosciences). Full lengths of histone H3 and HMGB1 were amplified by reverse transcriptase (RT)-PCR from mouse intestine and lung cDNAs using the following primers, respectively. Histone H3: 5′-GACGGTACCATGGCTCGTACTAAGCAGA-3′ and 5′-TTAATCCCGGGCCCTCTCCCCGCGGATGCG-3′; HMGB1: 5′- TTGGTACCATGGGCAAAGGAGATCCTAAAAAGCCG-3′ and 5′- CGACCGGTTCATCATCATCATCTTCTTCTTCATCT-3′. These cDNAs were subcloned into a pmCherry-N1 vector (Clontech), resulting in the generation of expression vectors for histone H3-mCherry and HMGB1-mCherry. H3-mCherry and HMGB1-mCherry cDNAs were transferred to a PiggyBac transposon vector, pPB-hCMV*1-IRES-mCherry (provided by H. Niwa) 49 . L929 and L929-SMART cells were transfected with pPB-hCMV*1-histone H3-mCherry or pPB-hCMV*1-HMGB1-mCherry along with pCAGGS-PBase encoding a transposase (provided by H. Niwa) 50 . Then, mCherry-positive cells were sorted by BD FACSAria TM III (BD Biosciences). Knockdown by siRNAs L929-SMART/HMGB1-mCherry cells were transfected with control (D-001810-10-05), Ripk3 (L-049919-00-0005), Mlkl (LQ-061420-00-0002, pools of J-061420-05 and -07), Chmp4b (L-041531-01-0020) siRNAs by lipofectamine 2000 (Invitrogen). siRNAs were purchased from Dharmacon. Knockdown of the expression of RIPK3 and MLKL was analyzed by immunoblotting with the indicated antibodies at 24 h after transfection. After transfection, cells were stimulated with TZ and subjected to LDH release assay or FRET analysis. Since anti-CHMP4B antibody did not work well in L929 cells, knockdown of the expression of Chmp4b was determined by quantitative polymerase chain reaction (qPCR) using the following primers. Chmp4b -F: 5′-GGAGAAGAGTTCGACGAGGAT-3′ and Chmp4b -R: 5′-TGGTAGAGGGACTGTTTCGGG-3′. qPCR analysis was performed with the 7500 Real-Time PCR detection system with SYBR green method of the target genes together with an endogenous control, murine Hprt with 7500 SDS software (Applied Biosystems). The amounts of Chmp4b were calculated relative to those of murine Hprt with 7500 SDS software (Applied Biosystems), and relative expression of Chmp4b in cells treated with Chmp4b siRNA vs control siRNA to be 1.0.
Inducible expression of MLKL mutants by lentiviral vectors
Dox-inducible lentiviral expression vectors, pF-TRE3G-PGK-puro encoding MLKL Q343A and MLKL L280P were previously described 24 . To produce lentivirus encoding MLKL mutants, we transfected HEK293T cells with pF-TRE3G-PGK-puro encoding wild-type or the indicated MLKL mutants along with packaging plasmids including pCAG-HIVgp and pCMV-VSV-G-RSV-Rev (provided by H. Miyoshi) as described previoulsy 51 . After the infection of cells with culture supernatants containing viruses, cells were selected in the presence of 5 μg ml −1 of puromycin, resulting in the generation of Mlkl −/− MEFs-SMART/MLKL Q343A or MLKL L280P. To induce the expression of transfected genes, Mlkl −/− MEFs-SMART expressing the indicated mutants were incubated with 100 ng ml −1 of Dox for 12 h (for MLKL Q343A) or 24 h (for MLKL L280P). After confirming the expression of inducible genes, cells expressing MLKL L280P were stimulated with TBZ and subjected to the FRET analysis. Since the expression of MLKL Q343A resulted in cell death, Mlkl −/− MEFs-SMART/MLKL Q343A were subjected to the FRET analysis just after the addition of Dox.
Coimmunoprecipitation and Western blotting
HEK293T cells (1 × 10 6 ) were plated on 60 mm dishes, and then transfected with an expression vector for each FRET probe along with an expression vector for FLAG-mRIPK3 by PEI MAX 40000 (24765, Polysciences). Cells were lysed with an IP buffer (50 mM Tris–HCl [pH 8.0], 250 mM NaCl, 0.5% Nonidet P-40, 25 mM β-glycerophosphate, 1 mM sodium orthovanadate, 1 mM sodium fluoride, 1 mM PMSF, 1 μg ml −1 aprotinin, 1 μg ml −1 leupeptin, and 1 μg ml −1 pepstatin) on ice for 30 min. After centrifugation, the supernatants were divided and incubated with the indicated antibodies for 1 h on ice, and then incubated with Protein G-Sepharose (17061801, GE Healthcare) for another 1 h at 4 °C. The immunoprecipitates were subjected to SDS-PAGE and then transferred onto polyvinylidene difluoride membranes (IPVH 00010, Millipore). The membranes were analyzed by immunoblotting with the indicated antibodies, and developed with Super Signal West Dura Extended Duration Substrate (34076, Thermo Scientific). The signals were analyzed with Amersham Imager 600 (GE Healthcare Life Sciences). To detect the phosphorylation of RIPK1, RIPK3, and MLKL, cells were preincubated with BV6 and zVAD for 30 min and then stimulated with TNF for the indicated times. Cells were harvested and lysed with 1× sample buffer (1% SDS, 10% sucrose, 62.5 mM Tris–HCl [pH 6.8], 2.5% β-mercaptoethanol), followed by brief sonication. Cell lysates were subjected to the SDS-PAGE. After transferring the membrane, the membrane was blocked with a blocking buffer (Cell Signaling) and then incubated with the indicated antibodies. Uncropped images of the results of Western blotting are included in Supplementary Figures 9 – 13 . Blue Native PAGE HT29-SMART cells were untreated or treated with TNF, BV6, and zVAD in the absence or presence of NSA for the indicated times. Cell fractionation was performed as previously described 52 . Briefly, cells were harvested with cold PBS and resuspended in a cell fractionation buffer (20 mM HEPES [pH 7.5], 100 mM KCl, 2.5 mM MgCl 2 , and 100 mM sucrose) containing 0.025% digitonin (14592, Cayman Chemical), 25 mM β-glycerophosphate, 1 mM sodium orthovanadate, 1 mM sodium fluoride, 1 mM PMSF, 1 μg ml −1 aprotinin, 1 μg ml −1 leupeptin, and 1 μg ml −1 pepstatin on ice for 10 min. After centrifugation, the supernatant was collected as a cytosolic fraction. The resulting pellet was resuspended with the cell fractionation buffer described above and the final concentrations of digitonin were adjusted to 1% w/v and kept on ice for 20 min. After centrifugation, the 1% digitonin soluble membrane fraction and cytosolic fraction were subjected to 4–16% Bis–Tris Native PAGE gel (BN1002BOX, ThermoFisher) and then transferred onto PVDF membrane. In parallel experiments, membrane and cytosolic fractions were subjected to reducing SDS-PAGE and then transferred onto PVDF membrane. The membranes were analyzed as described in Western blotting.
Cell death assay
L929 cells were transiently transfected with α19, then cells were stimulated with TNF and zVAD in the presence of SYTOX Orange. Cell viability was determined by counting SYTOX-positive cells (dead cells) among CFP-positive (α19-expressing cells) or -negative (α19-nonexpressing cells). To induce RIPK3-independent necrosis of L929 cells, L929 cells were stimulated with CCCP (50 μM) in the absence or presence of zVAD (20 μM) or GSK’872 (5 μM) in Hank’s balanced salt solution (HBSS) for 2 h. Cell viability was determined by WST (Water soluble Tetrazolium salts) assay (Cell Counting kit-8, Dojindo, Japan). MEFs and aMoC1 cells were plated onto 96-well plates and cultured for 12 h in 10% DMEM. Cells were stimulated with mTNF (10 ng ml −1 ) in the absence or presence of BV6 (1 μM), GSK’872 (5 μM), zVAD (20 μM), or Nec-1 (20 μM) for 8 h. The values of LDH release from cells were determined by Cytotoxicity Detection Kit (Roche) as described previously 13 . HaCaT cells were stimulated with poly(I:C) (50 μg ml −1 ) in the absence or presence of BV6 (1 μM), zVAD (20 μM), or Nec-1 (20 μM) for 24 h. Cell viability was determined by WST assay.
Detection of released HMGB1 and histone H3
Cells were plated onto 24 well plates. After 12 h incubation, the culture medium was changed to Opti-MEM (Thermo Scientific), cells were stimulated with the indicated agents. Culture supernatant was collected at the indicated times after stimulation, and analyzed by immunoblotting as described above.
Imaging analysis
Initial experiments, L929 cells were transiently transfected with the indicated FRET biosensors with Lipofectamine 2000. Otherwise indicated, L929, MEFs, aMoC1, HT29, and HaCaT cells stably expressing mSMART or hSMART were used for imaging. Cells were seeded on gelatin-coated glass bottom dish (627870, Greinar) and then stimulated with the indicated agents. Final concentrations of agents to stimulate cells are as follows: murine TNF (10 ng ml −1 ), human TNF (30 ng ml −1 ), poly(I:C) (20 μg ml −1 ), zVAD (20 μM), Nec-1 (20 μM), BV6 (1 μM), GSK’872 (5 μM), and NSA (5 μM). In the former experiments (Figs. 1 , 2 , Supplementary Fig. 1 , 3 , 6 ), cells were incubated in growth medium and placed in a heated chamber. Imaging analysis was carried out using a fluorescence microscope (IX-81; Olympus) with a CCD camera (ORCA-R 2 , Hamamatsu) controlled by MetaMorph 7.0 Software (Molecular Devices). 440AF21 excitation (Ex) filter, 455DRLP dichroic mirror, and two emission (Em) filters (480AF30 for ECFP and 536AF26 for YPet) were used for imaging. The FRET emission ratio (FRET/CFP) was calculated by dividing Ex440/Em536 (FRET) by Ex440/Em480 (CFP) using MetaMorph. For the detection of SYTOX Orange uptake, an additional filter set for TRITC was used. In the latter experiments (Figs. 3 – 8 , 10 , Supplementary Fig. 4 , 5 ), imaging of FRET was collected using a DeltaVision microscope system (GE Healthcare) built on an Olympus IX-71 inverted microscope base equipped with Photometric Coolsnap HQ2 CCD camera, using 60×/NA1.516 PlanApo oil immersion lens (Olympus). For live cell imaging with FRET sensors, cells were seeded on CELLview Cell Culture Dish (Greiner Bio-One) at 37 °C heat chamber with 5% CO 2 gas. A Blue Ex filter (400–454 nm), two Em filters (Blue Green, 463–487 nm for ECFP; Yellow Green, 537–559 nm for YPet), and C-Y-m polychroic mirror were used for imaging. The FRET emission ratio (FRET/CFP) was calculated by dividing Ex 436 nm/Em 560 nm (FRET) by Ex436 nm/Em 470 nm (CFP) using SoftWoRx (Applied Precision Inc.). For statistical analyses, the obtained images were analyzed by ImageJ and MetaMorph. ΔFRET/CFP ratio was calculated by subtracting the FRET/CFP ratio at time 0 from the FRET/CFP ratio at the indicated times. To detect Hoechst, UV filter set (Ex: 381–401 nm and Em: 409–456 nm) was used. To detect SYTOX Orange or mCherry, mCherry filter set (Ex 575 nm/Em 625 nm) was used for data collection. Simultaneous LCI-S, intracellular HMGB1-mCherry, and SMART Imaging of the release of HMGB1-mCherry by LCI-S was performed as previously described with some modifications 14 . Briefly, time-resolved measurement was performed with a completely automated inverted microscope (ECLIPSE Ti-E; Nikon, Tokyo, Japan) equipped with a high numerical aperture (NA) objective lens (CFI Apo TIRF 60× Oil, NA = 1.49, Nikon), a stage-top incubator (INUBG2TF-WSKM; Tokai Hit Co., Shizuoka, Japan) and an EM-CCD camera (ImagEM C9100-17; Hamamatsu Photonics K.K., Shizuoka, Japan). A high-pressure mercury lamp (Intensilight, Nikon) and a LED (540–600 nm, X-Cite XLED1; Excelitas technologies Corp., Waltham, MA) were used as light sources. The following sets of excitation (Ex) and emission (Em) filters and a dichroic mirror (DM) were used: For FRET, Ex: FF02-438/24-25, Em: FF01-483/32-25 (for ECFP) or FF01-542/27-25 (for Ypet), and DM: FF458-Di02-25×36; for HMGB1-mCherry, Ex: FF01-559/34-25, Em: FF01-630/69-25, and DM: FF585-Di01-25×36. These optical filters were purchased from Semrock (Rochester, NY). Eight to fifteen hours before observation, L929 cells stably expressing the indicated protein were plated to a PDMS-glass hybrid microwell array chip, on which anti-mCherry antibody was immobilized. Immediately before observation, the culture supernatant was replaced with a freshly prepared culture medium containing 1% BSA. Mineral oil was layered on top of the medium to prevent evaporation. We observed 40 and 56 microwells at 1.4 and 2 min intervals, respectively, to detect successively the signals of FRET, intranuclear and intracellular HMGB1-mCherry by epi-fluorescence microscopy and extracellular release of HMGB1-mCherry by TIRFM. The time course analysis of each fluorescence was performed using NIS Elements 4.6 (Nikon) and their relative intensities were calculated by ImageJ software. The steepness ( k ) of the HMGB1 release was estimated by fitting with the modified logistic function below by data analysis software (Origin Pro 2017, OriginLab Co., MA): documentclass[12pt]{minimal} usepackage{amsmath} usepackage{wasysym} usepackage{amsfonts} usepackage{amssymb} usepackage{amsbsy} usepackage{mathrsfs} usepackage{upgreek} setlength{oddsidemargin}{-69pt} begin{document}$$Ileft( t right) = I_0e^{ - frac{t}{tau }}/(1 + e^{ - k(t - t_c)}) + I_b$$end{document} I t = I 0 e - t τ ∕ ( 1 + e - k ( t - t c ) ) + I b where I 0 is the maximum intensity of HMGB1 release signal, τ is the time constant of the exponential decrease due to photobleaching of mCherry and release of HMGB1-mCherry from the capture antibody, k is steepness of the curve and t c is the time of the sigmoid’s midpoint. Then the duration D needed for the signal reaching to 0.95 from 0.05 of the sigmoid curve was calculated from k as follows: documentclass[12pt]{minimal} usepackage{amsmath} usepackage{wasysym} usepackage{amsfonts} usepackage{amssymb} usepackage{amsbsy} usepackage{mathrsfs} usepackage{upgreek} setlength{oddsidemargin}{-69pt} begin{document}$$D = frac{2}{k}mathrm{ln}left( {frac{1}{{0.05}} - 1} right)$$end{document} D = 2 k ln 1 0.05 - 1 The logarithm of durations (log D ) was classified into two groups (“burst” and “sustained”) by k-means clustering methods. Average of the log D was used as the representative value of each cluster. To determine the mode of HMGB1-mCherry release, L929-SMART/HMGB1-mCherry cells were transfected with control or Chmp4b siRNAs by Lipofectamine. The cells were harvested and plated into a microwell array chip at 8 h before observation. We observed 76 microwells at 2.5 min intervals to detect successively the signal of FRET and the intracellular HMGB1-mCherry by epi-fluorescence microscopy and extracellular release of HMGB1-mCherry by TIRFM. The time course analysis of each fluorescence was performed using NIS Elements 4.6 (Nikon). To determine the mode of HMGB1-mCherry release, normalized HMGB1-mCherry TIRF signals were approximated by the above modified logistic function, and the log D of HMGB1-mCherry release were compared between control and Chmp4b knockdown cells by Mann–Whitney test. Assembly of the log D from control and Chmp4b knockdown cells were then classified into two groups (burst and sustained) by k-means clustering methods. Average of the log D was used as the representative value of each cluster.
Statistical analysis
Statistical analysis was performed by the unpaired two-tailed Student’s t test, Mann–Whitney test, or the Tukey’s one-way analysis of variance (ANOVA) test as appropriate. P < 0.05 was considered to be statistically significant.
Electronic supplementary material Supplementary Information Peer Review File Description of Additional Supplementary Files Supplementary Movie 1 Supplementary Movie 2 Supplementary Movie 3 Supplementary Movie 4 Supplementary Movie 5 Supplementary Movie 6 Supplementary Movie 7 Supplementary Movie 8 Supplementary Movie 9 Supplementary Movie 10
Electronic supplementary material Supplementary Information accompanies this paper at 10.1038/s41467-018-06985-6.
📊 Figures
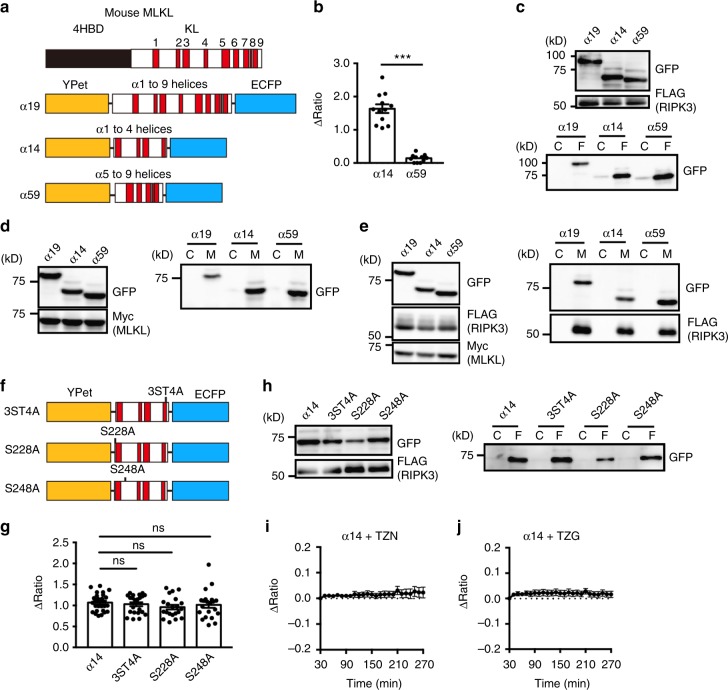
Fig. 1
Development of a FRET biosensor that monitors necroptosis. a Domain structures of murine MLKL and designed FRET biosensors. 4HBD and KL indicate four-helical bundle and kinase-like domains, respective...
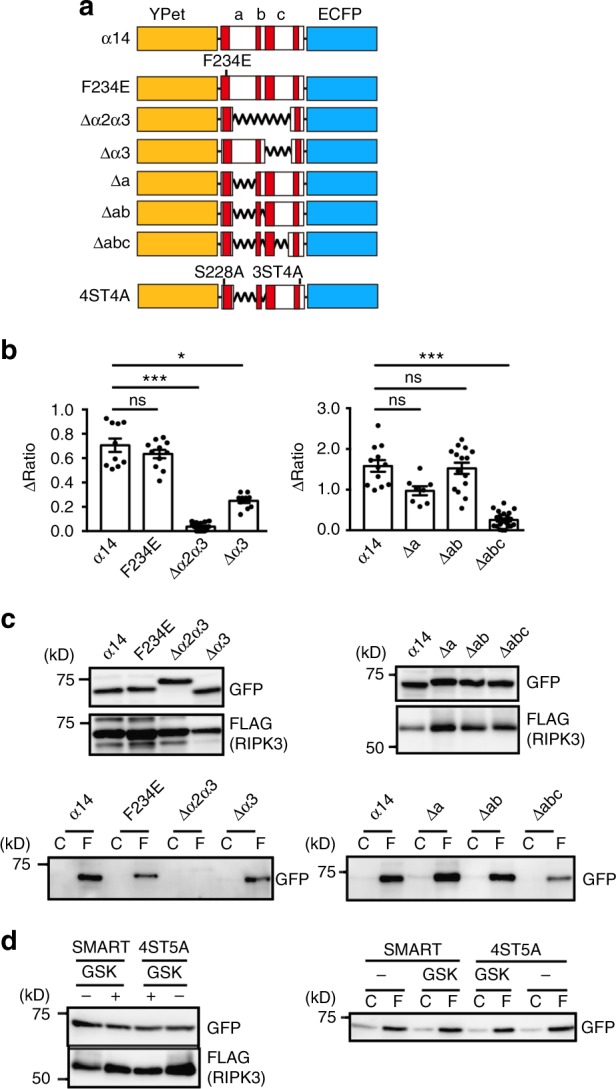
Fig. 2
Interaction of u03b114 with RIPK3 is required for monitoring necroptosis. a Diagram of a series of u03b114 mutants. F234E; phenylalanine at 234 is substituted with glutamic acid, 4ST5A; S228, S345, T3...
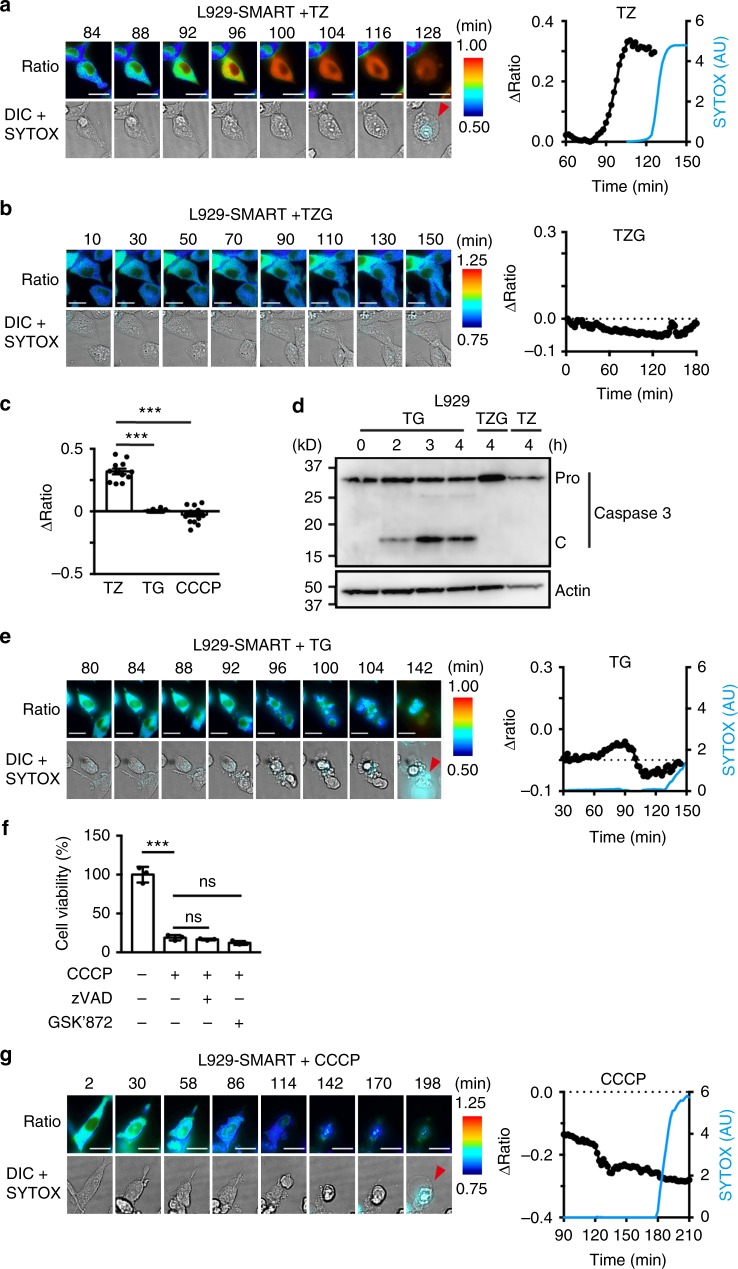
Fig. 3
SMART does not monitor apoptosis or necrosis. a , b , e , g L929-SMART cells were treated with TZ ( a ), TZG ( b ), TG ( e ), or CCCP ( g ). The FRET/CFP ratio was analyzed as in Fig. 1b . Representat...
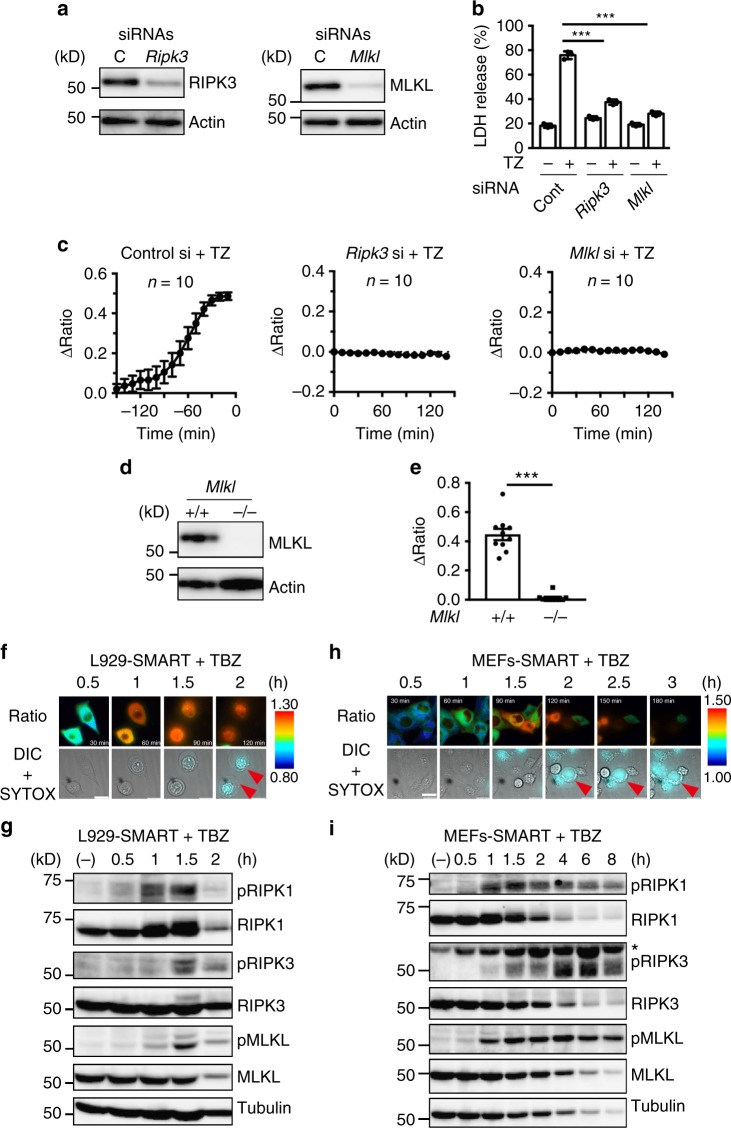
Fig. 4
Monitoring of necroptosis by SMART depends on RIPK3 and MLKL. a , b Knockdown of Ripk3 or Mlkl abolishes the TZ-induced increase in the FRET/CFP ratio of SMART. L929-SMART cells were transfected with ...
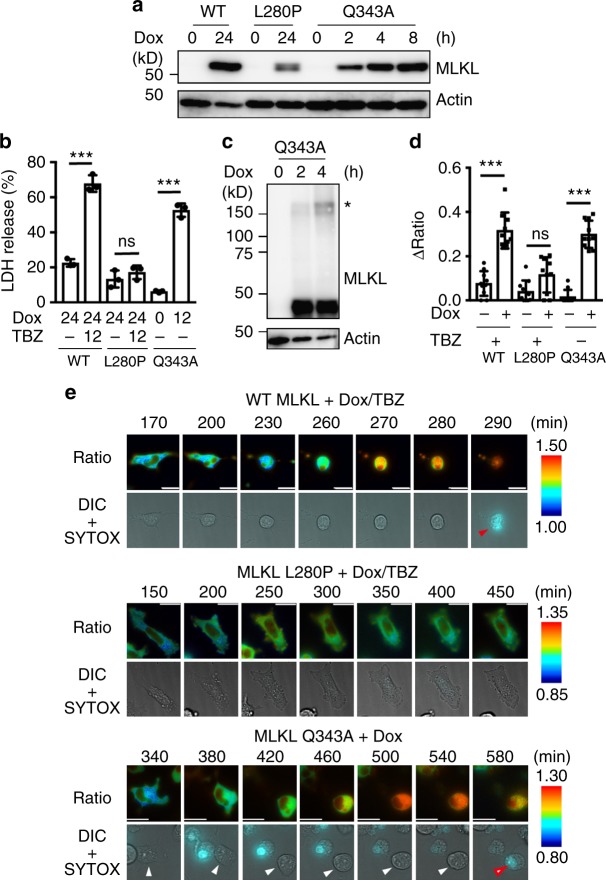
Fig. 5
SMART monitors oligomerization of MLKL. a Mlkl u2212/u2212 MEFs-SMART were transfected with Dox-inducible lentiviral vectors for WT MLKL, MLKL L280P, or MLKL Q343A. Cells were treated with Dox for the...
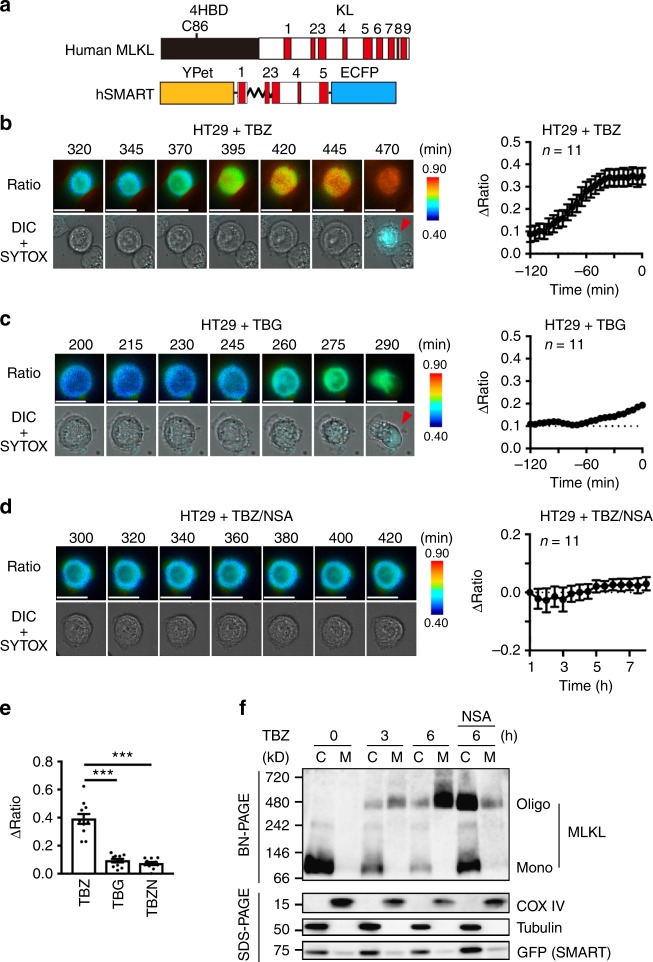
Fig. 6
hSMART monitors necroptosis in human cells. a Diagram of hSMART. b u2013 e HT29 cells stably expressing hSMART were stimulated with TBZ ( b ), TBG ( c ), or TBZu2009+u2009NSA ( d ). The FRET/CFP ratio...
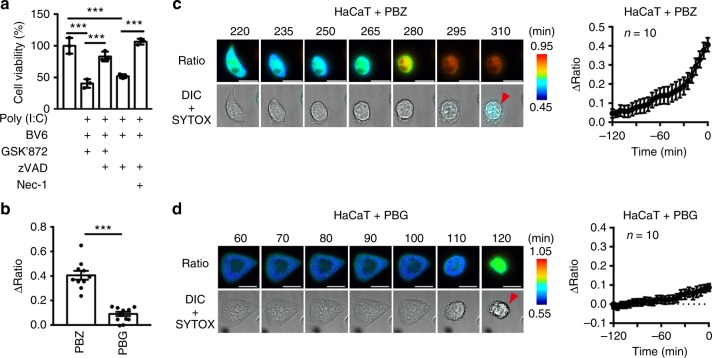
Fig. 7
SMART monitors poly(I:C)-induced necroptosis. a HaCaT cells were stimulated with the combination of the indicated agents for 24u2009h. Cell viability was determined by WST assay. Results are meanu2009...
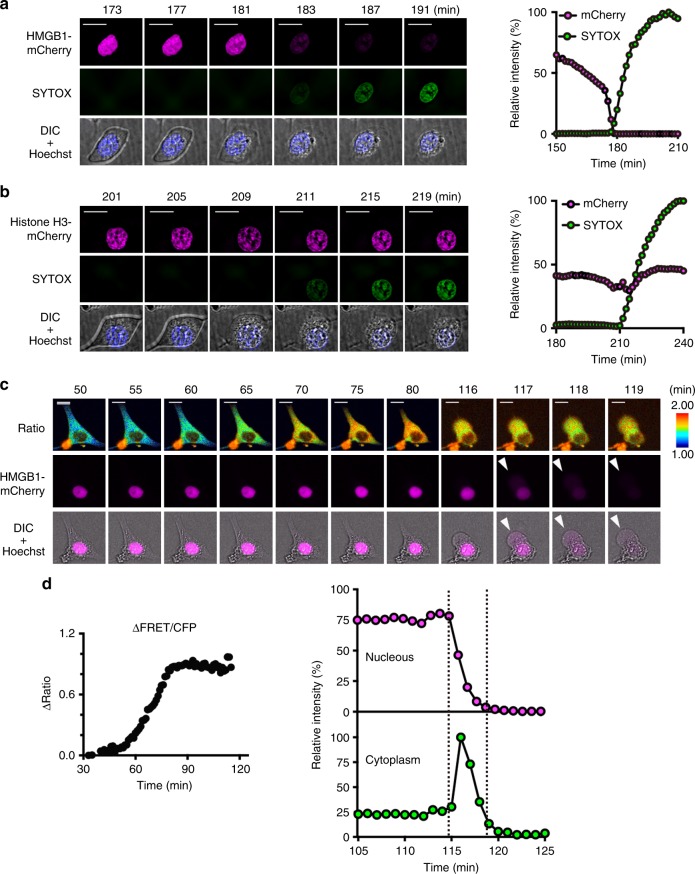
Fig. 8
Sequential two-step release of HMGB1 from cells undergoing necroptosis. a , b L929 cells stably expressing HMGB1-mCherry or histone H3-mCherry were stimulated with TZ. The signals of HMGB1- or histone...
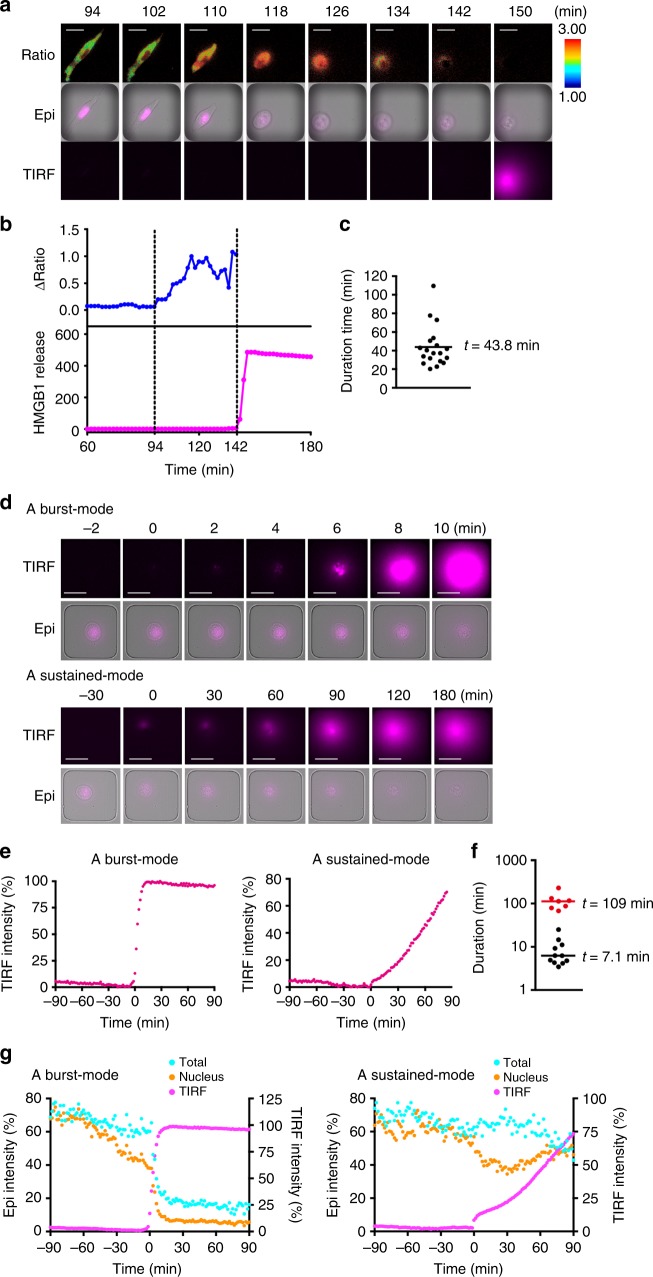
Fig. 9
LCI-S uncovers two different modes of the release of HMGB1. a u2013 c L929-SMART cells were transiently transfected with HMGB1-mCherry and then stimulated with TZ. The FRET/CFP ratio was analyzed as i...
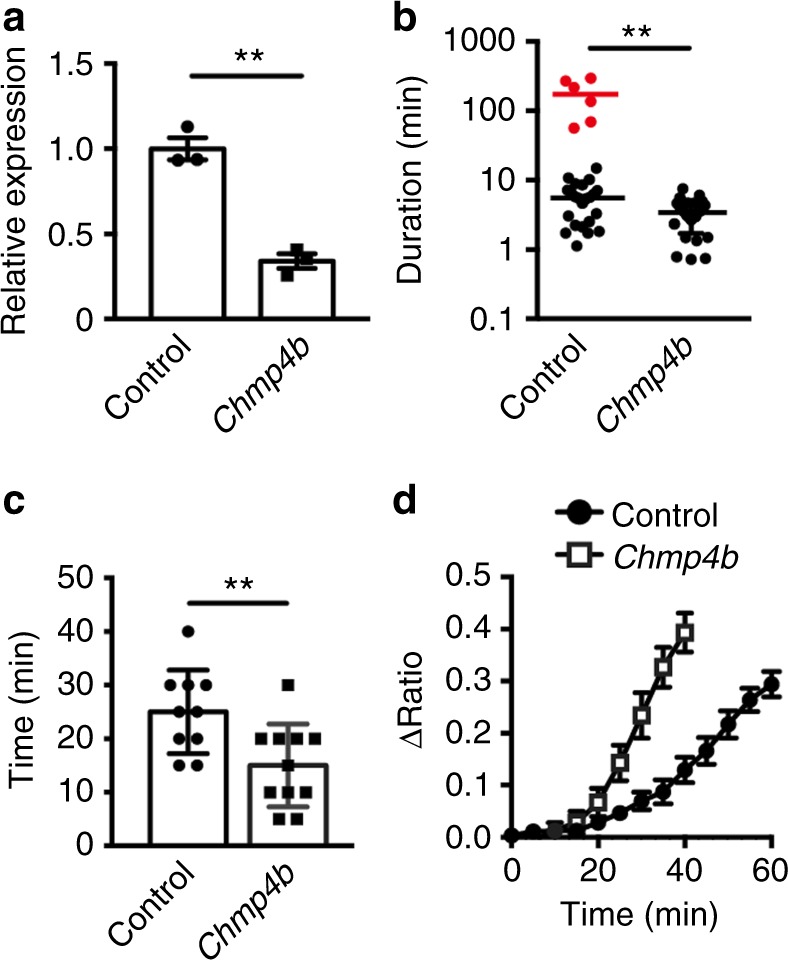
Fig. 10
Knockdown of Chmp4b abrogates a sustained-mode of HMGB1 release. a L929-SMART/HMGB1-mCherry cells were transfected with control or Chmp4b siRNA, and knockdown efficiency was determined by qPCR at 24u2...
Figure images are served from the NIH/NLM PubMed Central Open Access Subset or Europe PMC; copyright remains with the publishers and authors.
💬 Discussion
0 commentsNo comments yet. Be the first to start a discussion!
Leave a Comment