Abstract
Abstract Purified mitochondrial ATP synthase has been shown to form Ca 2+ -activated, large conductance channel activity similar to that of mitochondrial megachannel (MMC) or mitochondrial permeability transition pore (mPTP) but the oligomeric state required for channel formation is being debated. We reconstitute purified monomeric ATP synthase from porcine heart mitochondria into small unilamellar vesicles (SUVs) with the lipid composition of mitochondrial inner membrane and analyze its oligomeric state by electron cryomicroscopy. The cryo-EM density map reveals the presence of a single ATP synthase monomer with no density seen for a second molecule tilted at an 86 o angle relative to the first. We show that this preparation of SUV-reconstituted ATP synthase monomers, when fused into giant unilamellar vesicles (GUVs), forms voltage-gated and Ca 2+ -activated channels with the key features of mPTP. Based on our findings we conclude that the ATP synthase monomer is sufficient, and dimer formation is not required, for mPTP activity.
🔬 Techniques
🔭 Microscopes
🧬 Organisms
💻 Software
✨ Fluorophores
🧪 Sample Preparation
🏭 Microscope Brands
🧪 Reagent Suppliers
📷 Detectors
💻 Software Details
💾 Data Repositories
🏛️ Research Organizations (ROR)
Affiliated research institutions:
📋 Methods
Isolation of mitochondria and purification of ATP synthase
Fresh porcine hearts were obtained immediately after slaughter and sub-mitochondrial vesicles (SMVs) were isolated as previously described 57 . Briefly, the heart was finely minced in Buffer 1 [225 mM mannitol, 70 mM sucrose, 1 mM EGTA, and 20 mM Tris (pH 7.2)], and the tissue was then homogenized with an Elvehjem potter. The homogenate was centrifuged at 1000 × g for 4 min. The supernatant was transferred into a fresh tube, and the sediment was homogenized for a second time to access intermyofibrillar mitochondria. After centrifugation at 1000 × g , the supernatants were centrifuged at 9000 × g for 10 min to sediment the mitochondria. The mitochondria were resuspended in Buffer 2 [225 mM mannitol, 70 mM sucrose, and 20 mM Tris (pH 7.2)] and centrifuged again at 9000 × g for 10 min. The final mitochondrial pellet was suspended in 0.05–0.4 mL of Buffer 2. Isolated mitochondria were used immediately for SMV isolation or stored at −80 °C until further use. SMVs were solubilized on ice by using DDM (1 g/g protein) orCHAPSO and cholate to final concentrations of 1.6% (w/v) and 0.5% (w/v), respectively. Then, the suspension was centrifuged at 100,000 × g for 1 h. Subsequently, 50% (w/w) PEG 6000 was added to the supernatant (final concentration, 7%). After 2 h incubation on ice the protein precipitate was removed by centrifugation at 50,000 × g for 1 h and PEG 6000 was subsequently added to the supernatant (final concentration, 2%). The protein precipitate was collected after incubation for 2 h on ice and centrifuged at 50,000 × g for 1 h. The pellet, which contains ATP synthase, was solubilized in Buffer A (50 mM Tris-HCl, pH 8.0, 100 mM NaCl, 2 mM MgSO 4 , 1 mM ATP, 0.1% DDM, 10% glycerol (v/v)). The solubilized sample was concentrated to 0.5 ml (Amicon centrifugal filters with 100 kDa molecular mass cutoff) and loaded onto a Superose 6 Increase 10/300 gel filtration column (GE Healthcare, USA) equilibrated with Buffer B (Buffer A with 0.1 mg/ml bovine heart polar lipid extract, Avanti). Fractions eluted at a retention volume of 11–12 ml were collected and used for further analysis. Protein concentrations were determined with a BCA Protein Assay Kit (Thermo Scientific). The protein molecular weight markers, thyroglobulin (T, 669 kDa), ferritin (F, 440 kDa), and BSA (66 kDa) were used for column calibration. The monomeric state of the purified protein was confirmed by blue-native PAGE. Purified protein was used immediately, or it was flash frozen in aliquots for further use. Purified ATP synthase from five independent preparations was used for ion channel recordings.
Show full methods section
Isolation of mitochondria and purification of ATP synthase
Fresh porcine hearts were obtained immediately after slaughter and sub-mitochondrial vesicles (SMVs) were isolated as previously described 57 . Briefly, the heart was finely minced in Buffer 1 [225 mM mannitol, 70 mM sucrose, 1 mM EGTA, and 20 mM Tris (pH 7.2)], and the tissue was then homogenized with an Elvehjem potter. The homogenate was centrifuged at 1000 × g for 4 min. The supernatant was transferred into a fresh tube, and the sediment was homogenized for a second time to access intermyofibrillar mitochondria. After centrifugation at 1000 × g , the supernatants were centrifuged at 9000 × g for 10 min to sediment the mitochondria. The mitochondria were resuspended in Buffer 2 [225 mM mannitol, 70 mM sucrose, and 20 mM Tris (pH 7.2)] and centrifuged again at 9000 × g for 10 min. The final mitochondrial pellet was suspended in 0.05–0.4 mL of Buffer 2. Isolated mitochondria were used immediately for SMV isolation or stored at −80 °C until further use. SMVs were solubilized on ice by using DDM (1 g/g protein) orCHAPSO and cholate to final concentrations of 1.6% (w/v) and 0.5% (w/v), respectively. Then, the suspension was centrifuged at 100,000 × g for 1 h. Subsequently, 50% (w/w) PEG 6000 was added to the supernatant (final concentration, 7%). After 2 h incubation on ice the protein precipitate was removed by centrifugation at 50,000 × g for 1 h and PEG 6000 was subsequently added to the supernatant (final concentration, 2%). The protein precipitate was collected after incubation for 2 h on ice and centrifuged at 50,000 × g for 1 h. The pellet, which contains ATP synthase, was solubilized in Buffer A (50 mM Tris-HCl, pH 8.0, 100 mM NaCl, 2 mM MgSO 4 , 1 mM ATP, 0.1% DDM, 10% glycerol (v/v)). The solubilized sample was concentrated to 0.5 ml (Amicon centrifugal filters with 100 kDa molecular mass cutoff) and loaded onto a Superose 6 Increase 10/300 gel filtration column (GE Healthcare, USA) equilibrated with Buffer B (Buffer A with 0.1 mg/ml bovine heart polar lipid extract, Avanti). Fractions eluted at a retention volume of 11–12 ml were collected and used for further analysis. Protein concentrations were determined with a BCA Protein Assay Kit (Thermo Scientific). The protein molecular weight markers, thyroglobulin (T, 669 kDa), ferritin (F, 440 kDa), and BSA (66 kDa) were used for column calibration. The monomeric state of the purified protein was confirmed by blue-native PAGE. Purified protein was used immediately, or it was flash frozen in aliquots for further use. Purified ATP synthase from five independent preparations was used for ion channel recordings.
SDS-PAGE and BNP-PAGE and western blot analysis
Samples for SDS-PAGE were denatured for 2 min at 90 °C in a sample lysis buffer (50 mM Tris-HCl, pH 7.0, 4% (w/v) SDS, 10% (v/v) glycerol, and 0.1 M 1,4-Dithiothreitol) and separated on 4–16% polyacrylamide gels (Bio-Rad Mini Protean) by using Tris-HCl buffer system. Gels were stained with the silver stain kit for protein visualization (Pierce, Thermo Scientific) or wet-transferred on polyvinylidene fluoride (PVDF) membrane for the immunodetection of proteins. The membrane was blocked in 5% nonfat milk in TBS (Tris-buffered saline) and then probed with different antibodies: for ATP synthase α-subunit (1:1000 dilution, ab14748, Abcam), e-subunit (1:1000 dilution, ab122241, Abcam), g-subunit (1:1000 dilution, ab126181, Abcam), c-subunit (1:1000 dilution, anti-ATP5G1/G2/G3 antibody, ab180149, Abcam), ANT1 (1:1000 dilution, 32484, Sabbiotech) and CypD (1:1000 dilution, TA302580, Origene). Porcine heart mitochondrial or purified ATP synthase samples were used for the blue-native PAGE analysis to assess the oligomeric state of ATP synthase. Isolated mitochondria (20 μg, verified by BCA assay) were solubilized with DDM (1 g/g protein) or digitonin (2 g/g protein) for 20 min on ice and centrifuged at 20,000 × g for 30 min to remove the mitochondrial debris. Supernatants containing Coomassie Brilliant Blue G-250 (dye/detergent ratio 1:4) were separated on Bis-Tris 3–12% native gels (Invitrogen NativePAGE) by using the Bis-Tris buffer system. After separation the protein complexes were wet-transferred on a PVDF membrane, which was blocked in 5% nonfat milk in TBS and then probed with antibodies. Reconstitution of ATP synthase into liposomes DDM-solubilized ATP synthase monomers were reconstituted into SUVs (size range ~25–50 nm). The following lipid composition, closely mimicking that of the inner mitochondrial membrane 35 , was used for making SUVs: PE:PC:CL (35%:35%:30%, Avanti). Liposomes were destabilized by sonicating the lipid mixture (final concentration, 10 mM) in 200 μL of Buffer C (50 mM Tris-HCl, pH 8.0, 150 mM NaCl) with DM (decyl-maltoside, final concentration, 30 mM) for 30 min. DDM-solubilized ATP synthase was mixed with the lipid/DM mixture in 2:1 ratio and incubated for 2 h at 4 °C. The protein/lipid/detergent mixture was dialyzed for 4 days in Buffer D (50 mM Tris-HCl, pH 8.0, 150 mM NaCl, 2 mM MgSO 4 , 1 mM ATP) at 4 °C by using dialysis tubing (25000 MWCO, Cole-Parmer). The dialyzed sample was centrifuged at 15,000 × g for 20 min and the supernatant was used immediately for cryo-EM grid preparation. The pellet containing relatively larger size SUVs was resuspended in Buffer E (10 mM HEPES, pH 7.3, 120 mM KCl and 50 mM NaCl) and fused with GUV’s for electrophysiological recordings. GUVs were prepared as described previously 6 . Briefly, 50 μl of 50 mg/ml chloroform solution of PC was dried under a nitrogen stream in a vacuum to form a thin lipid bilayer film on a glass surface. For a separate recording experiment (Supplementary Fig. 3c, d ), GUVs were prepared with the exact lipid composition of SUVs used for cryo-EM studies (PE:PC:CL, 35%:35%:30%). Empty or ATP synthase reconstituted SUVs were fused with GUVs by overnight incubation in Buffer E at 4 °C. SM-2 Bio-Beads (Bio-rad) were added to this mixture to remove the residual amount of detergent if it was still present in our SUV sample. Bio-Beads were removed by brief centrifugation. F 1 regions were stripped by incubating GUVs with 3 M sodium bromide for 30 min 58 . Stripped GUVs were collected after centrifugation at 15,000 × g for 20 min. The absence of F 1 was confirmed by immunoblot analysis (Supplementary Fig. 1b ).
ATPase activity measurements
ATPase activities were assayed in a buffer containing 50 mM Tris/H 2 SO 4 , 10 mM ATP, and 4 mM MgSO 4 , pH 8.0, at 37 °C. The reaction was started by the addition of 5–10 μg enzyme solubilized in detergent or after liposome reconstitution and stopped after 2 min by the addition of SDS (final concentration, 10%, w/v). The released P i was measured as described 59 . One unit of enzymatic activity (U) corresponds to 1 μmol of ATP hydrolyzed (equivalent to 1 μmol of P i produced) per min, per mg protein. The effect of oligomycin on ATP hydrolysis activity was determined by addition of the inhibitor in ethanol solution (5 μg/ml, w/v).
Electrophysiology
The patch-clamp recordings of ATP synthase reconstituted GUVs were performed by forming a giga-ohm seal in intracellular solution (10 mM Hepes, pH 7.3, 120 mM KCl, 8 mM NaCl, 0.5 mM EGTA,) using an Axopatch 200B amplifier (Axon Instruments) at room temperature (22–25 °C). Recording electrodes were pulled from borosilicate glass capillaries (WPI) with a final resistance in the range of ~50 MΩ. Signals were filtered at 5 kHz using the amplifier circuitry. ATP and calcium were added into the bath during the patch-clamp recordings in 1:10 ratio (v/v) without perfusion. pCLAMP-10 software was used for patch-clamp electrophysiology data acquisition and analysis (molecular devices). All current measurements were adjusted for the holding voltage assuming a linear current-voltage relationship: the resulting conductances are expressed in pS according to the equation G = I/V , where G is conductance in pS, V is the membrane holding voltage in mV, and I is the peak membrane current in pA-baseline electrode leak current. Group data were quantified in terms of conductance. All population data were expressed as mean ± SEM. Single-particle Cryo-EM analysis of ATP synthase Thin carbon films (thickness 5–8 nm) were evaporated on freshly cleaved mica in a Leica ACE 600 evaporator. ATP synthase reconstituted liposomes were applied to the glow-discharged C-flat grids covered with a thin carbon film. Grids were plunge-frozen in liquid ethane using a Mark IV Vitrobot (ThermoFisher) at 100% humidity after blotting for 3–6 s. The images were recorded with a Gatan K2 direct electron detector in a Krios electron microscope in counting mode at 300 kV. During the exposure the defocus was stepped from a low value (2–4 µm 40 e − /Å exposure) to a high value (~10 µm 20–40 e − /Å). The focal pairs of micrographs were merged for improved visibility of the protein for particle picking as described 60 . The cryo-EM structure of bovine mitochondrial ATP synthase was used as an initial reference for the particle picking and refinement in RELION-1.3 61 . Particles were picked after vesicle-membrane subtraction by using the procedures described in 60 . Making use of the RELION rlnReconstructImageName variables, in the last iteration of 3D auto-refinement in RELION-1.3 an un-subtracted particle stack was used for the final reconstruction. This resulted in 3D reconstructions that included membrane density. A 96-pixel box size (2.8 Å/pixel) was used for initial particle picking. Classification in 2D of picked particles was performed in RELION-1.3, and 7795 particles were used for reconstruction of the first 3D density map, which had 19 Å resolution. Subsequently, a larger box (128-pixel box, 4.2 Å/pixel) was used for particle extraction, chosen to fit ATP synthase dimers. Reconstruction of the second 3D map from 6655 particles resulted in 30 Å resolution. For this refinement the first reconstruction was used as a reference (filtered to 60 Å). Models were fitted with the atomic model of bovine ATP synthase (5ARA) by using UCSF Chimera 62 . LC-MS/MS analysis In-solution protein digestion: Purified ATP synthase solution (5 µg/µl) in 0.1% DDM or liposome reconstituted ATP synthase solution (5 µg/µl) was precipitated with acetone by using established protocols to remove detergent. Protein pellet was dissolved and denatured in 8 M urea, 0.4 M ammonium bicarbonate, pH 8. The protein was reduced by the addition of 1/10 volume of 45 mM dithiothreitol (Pierce Thermo Scientific, #20290) and incubation at 37 °C for 20 min. Then the sample was alkylated with the addition of 1/10 volume of 100 mM iodoacetamide (Sigma-Aldrich, #I1149) with incubation in the dark at room temperature for 20 min. The urea concentration was adjusted to 2 M by the addition of water prior to enzymatic digestion at 37 °C with chymotrypsin for 16 h. Protease:protein ratios were estimated at 1:50. The sample was acidified by the addition of 20% trifluoroacetic acid, then desalted using C18 MacroSpin columns (The Nest Group, #SMM SS18V) following the manufacturer’s directions with peptides eluted with 0.1% TFA, 80% acetonitrile. Eluted sample was speedvac dried and dissolved in MS loading buffer (2% acetotonitrile, 0.2% trifluoroacetic acid). A nanodrop measurement (Thermo Scientific Nanodrop 2000) determined protein concentrations (A260/A280). Each sample was then further diluted with MS loading buffer to 0.08 µg/µl, with 0.4ug (5 µl) injected for LC-MS/MS analysis. LC-MS/MS on the Thermo Scientific Orbitrap Fusion: LC-MS/MS analysis was performed on a Thermo Scientific Orbitrap Fusion equipped with a Waters nanoAcquity UPLC system utilizing a binary solvent system (Buffer A: 100% water, 0.1% formic acid; Buffer B: 100% acetonitrile, 0.1% formic acid). Trapping was performed at 5 µl/min, 99.5% Buffer A for 3 min using a Waters Symmetry ® C18 180 µm × 20 mm trap column. Peptides were separated using an ACQUITY UPLC PST (BEH) C18 nanoACQUITY Column 1.7 µm, 75 µm × 250 mm (37 °C) and eluted at 300 nl/min with the following gradient: 3% buffer B at initial conditions; 6% B at 5 minute; 35% B at 90 min; 85% B at 95 min; 85% B at 105 min; return to initial conditions at 106–120 min. MS was acquired in the Orbitrap in profile mode over the 300–1500 m/z range using quadrapole isolation, 1 microscan, 120,000 resolution, AGC target of 4 × 10 5 , and a maximum injection time of 60 ms. MS/MS were collected in top speed mode with a 3 s cycle time on species with an intensity threshold of 5 × 10 4 , charge states 2–8, peptide monoisotopic precursor selection preferred. Dynamic exclusion was set to 30 s. Data dependent MS/MS were acquired in the Orbitrap in centroid mode using quadropole isolation (window 1.6 m/z), HCD activation with a collision energy of 28%, 1 microscan, 60,000 resolution, AGC target of 1 × 10 5 , maximum injection time of 110 ms. For the peptide identification, data were analyzed by using Byonic Software (Protein Metrics, San Carlos, CA USA; version PMI-Byonic-Demo:v2.15.7). Byonic was set up to search the data against the UniProt database with taxonomy restricted to Sus Scrofa (the domestic pig), (40,706 proteins). Search parameters included chymotrypsin digestion with up to two missed cleavages, peptide mass tolerance of 10 ppm, MS/MS fragment tolerance of 25 ppm, and methionine oxidation and carbamidomethylation on cysteine as variable modifications. The estimated-spectrum level FDR (false discovery rate) on true proteins was set to 0.3%. Scaffold (version Scaffold_4.8.9, Proteome Software) was used to validate and compare MS/MS based peptide and protein identifications. Normal and decoy database searches were run, with the confidence level set to 95% ( p < 0.05). Protein identifications were accepted if they could be established at greater than 99.0% probability and contained at least two identified peptides. Scaffold was also used for quantitative analysis of proteins to calculate the exponentially modified protein abundance index (emPAI).
Statistical analysis Paired or unpaired
Student’s two-tailed t test was used for two group comparisons. One-way ANOVA was used for multiple analysis, p values are provided in figure legends. Data represented as mean ± SEM. Reporting summary Further information on research design is available in the Nature Research Reporting Summary linked to this article.
Supplementary information Peer Review File Supplementary Information Description of Additional Supplementary Files Supplementary Data 1 Reporting Summary
📊 Figures
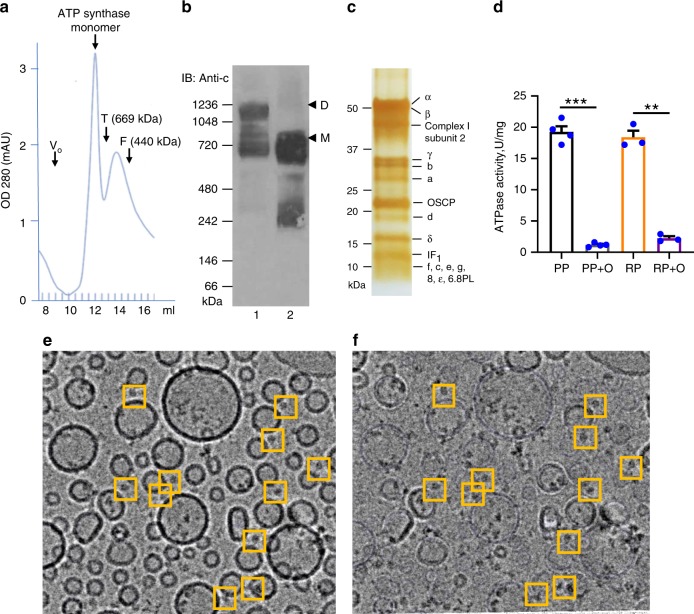
Fig. 1
DDM-purified ATP synthase forms monomers.
a Size exclusion chromatography (SEC) profile of purified ATP synthase monomer. A representative example of three independent runs is shown. Void volume of SEC column (V o ) and elution volume of prot...
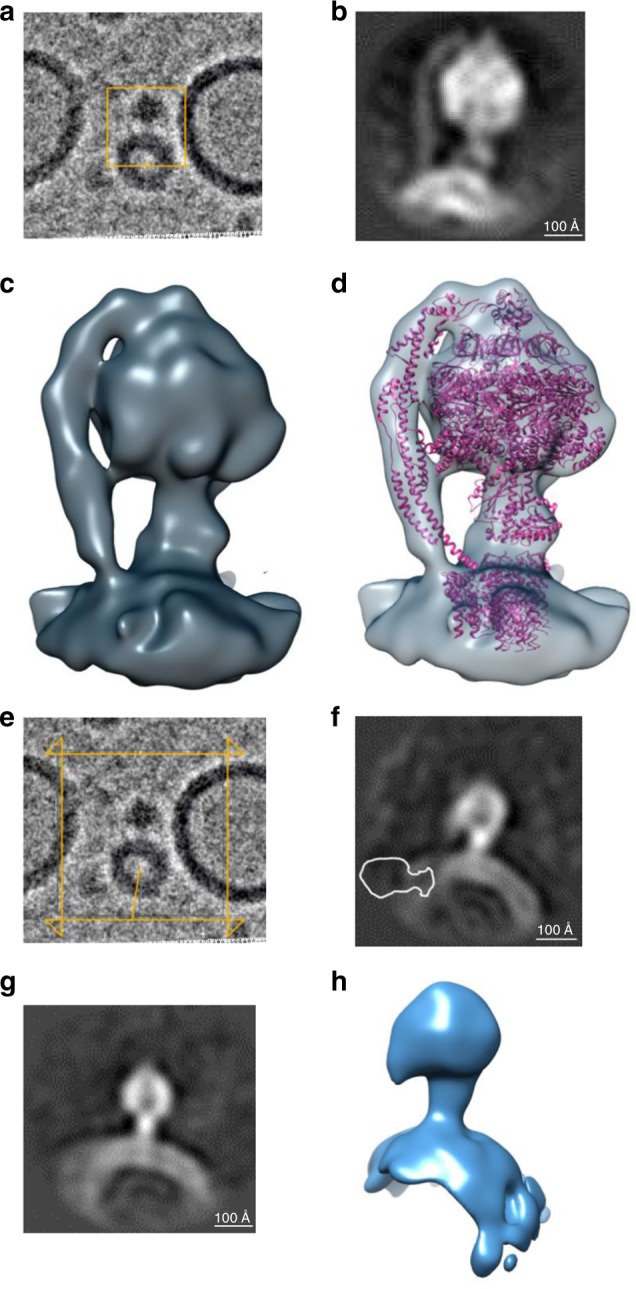
Fig. 2
ATP synthase forms monomers after reconstitution.
a Cryo-EM image of small unilamellar vesicles reconstituted with ATP synthase. For initial particle picking a 96-pixel box at 2.8u2009u00c5/pixel was used for particle picking and 3D reconstruction. b...
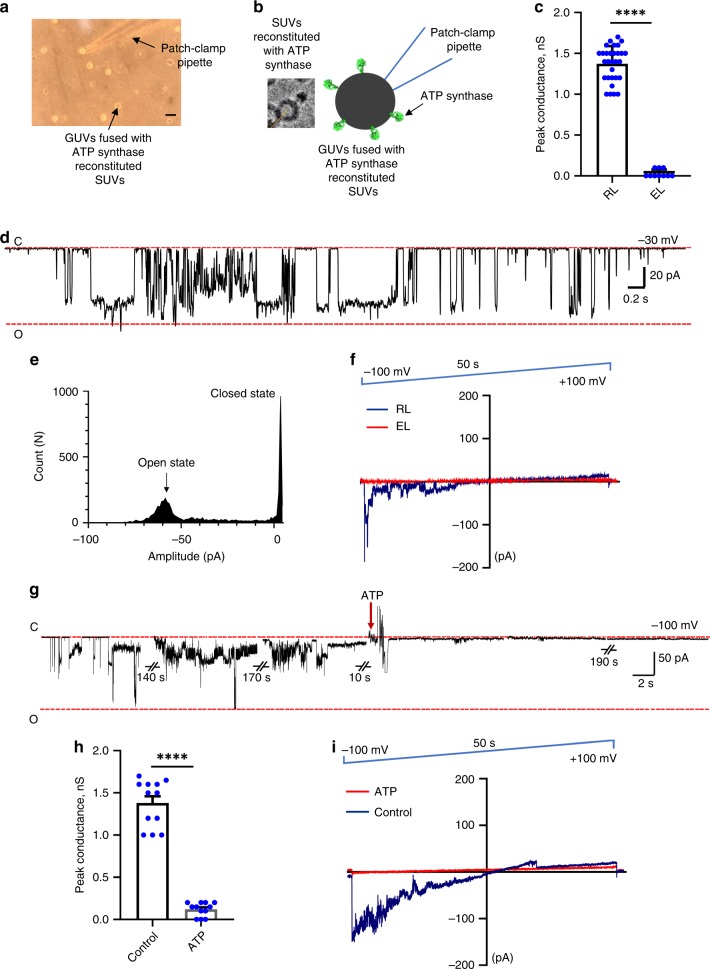
Fig. 3
ATP synthase forms a large voltage-gated channel.
a Photomicrographic image during a patch-clamp recording showing the patch-clamp pipette sealed onto a liposome. Scale bar, 50u2009u00b5m. b Left image, the cryo-EM image of monomeric ATP synthase rec...
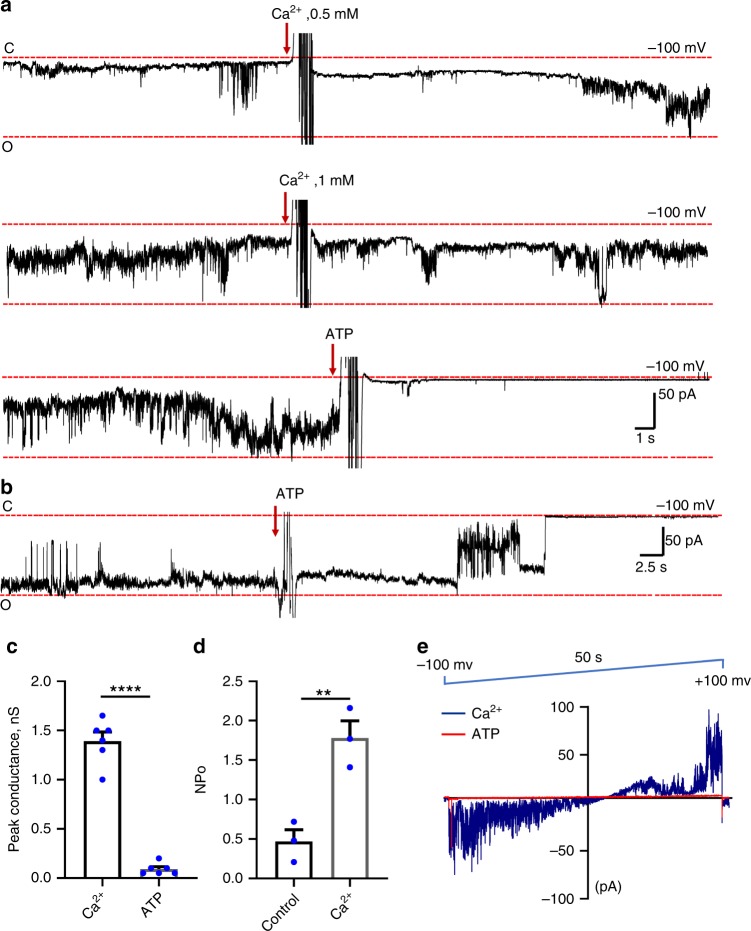
Fig. 4
ATP synthase forms a channel sensitive to Ca 2+ .
a A single continuous recording of ATP synthase reconstituted liposomes in the presence of increasing concentrations of Ca 2+ . Ca 2+ was added twice during the recording, yielding final concentration...
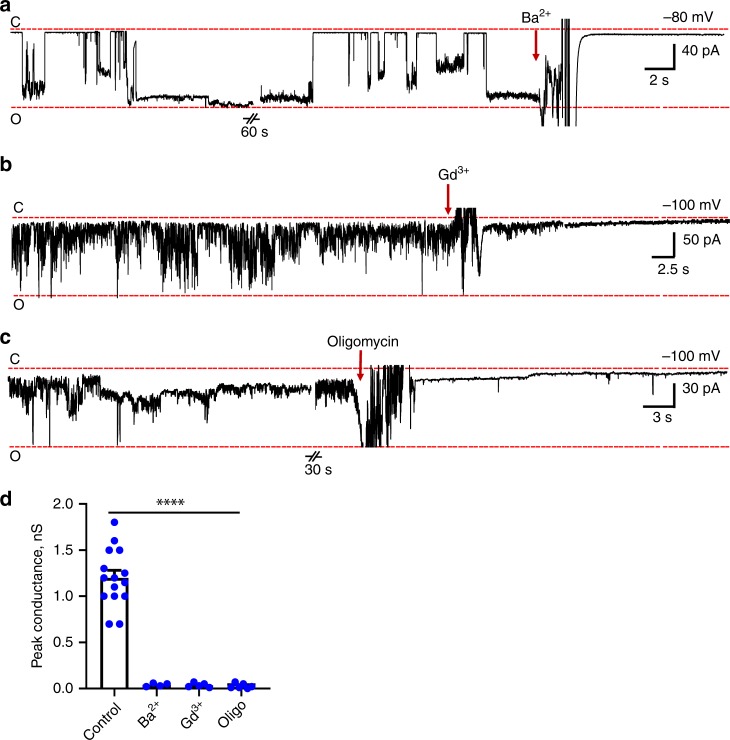
Fig. 5
Pharmacological modulation of ATP synthase channel activity.
Representative patch-clamp recording of F 1 F O ATP synthase reconstituted liposomes showing sensitivity to a Ba 2+ (1u2009mM), n =u20094, b Gd 3+ (1u2009mM), n =u20095, and c oligomycin A (5u2009u03b...
Figure images are served from the NIH/NLM PubMed Central Open Access Subset or Europe PMC; copyright remains with the publishers and authors.
💬 Discussion
0 commentsNo comments yet. Be the first to start a discussion!
Leave a Comment