Abstract
The actin cytoskeleton plays multiple critical roles in cells, from cell migration to organelle dynamics. The small and transient actin structures regulating organelle dynamics are challenging to detect with fluorescence microscopy, making it difficult to determine whether actin filaments are directly associated with specific membranes. To address these limitations, we developed fluorescent-protein-tagged actin nanobodies, termed 'actin chromobodies' (ACs), targeted to organelle membranes to enable high-resolution imaging of sub-organellar actin dynamics.
🔬 Techniques
🔭 Microscopes
💻 Software
✨ Fluorophores
🧪 Sample Preparation
🔬 Cell Lines
🏭 Microscope Brands
🧪 Reagent Suppliers
📷 Detectors
🔎 Objectives
🎨 Filters
💻 Software Details
💾 Data Repositories
🏛️ Research Organizations (ROR)
Affiliated research institutions:
📋 Methods
Cell culture. U2OS, HeLa, and Hap1 cells were purchased from ATCC. HeLa cells stably expressing LifeAct-mCherry were a gift from the Wedlich-Soldner lab 22 . Cells were grown in DMEM supplemented with 10% fetal bovine serum at 37°C with 5% CO 2 . Cells were transfected with Lipofectamine 2000 (ThermoFisher). Cells were plated onto either 8-well #1.5 imaging chambers or #1.5 35mm dishes (Cellvis) that were coated with 10µg/mL fibronectin in PBS at 37°C for 30 minutes prior to plating. 50nM MitoTracker Deep Red (ThermoFisher) was added for 30 minutes then washed for at least 30 minutes to allow for recovery time before imaging in FluoroBrite (ThermoFisher) medium. Airyscan confocal imaging. Cells were imaged with a Plan-Apochromat 63x/1.4NA oil objective on an inverted Zeiss 880 LSM Airyscan confocal microscope with the environmental control system supplying 37°C, 5% CO 2 and humidity for live cell imaging. The GFP channels were imaged with a 488nm laser line at ~500nW laser power. The mCherry or tagRFP channels were imaged with 561nm laser at ~1µW laser power. The MitoTracker Deep Red channel was imaged with ~250nW laser power. For timelapse imaging, the zoom factor was set between 3x-6x to increase the frame rate. In all cases, the maximum pixel dwell time (~0.684µs/pixel) and 2x Nyquist optimal pixel size (~40nm/pixel) was used. Spinning disk confocal imaging. Cells were imaged with a Plan-Apochromat 40x/1.3NA oil objective on a Zeiss CSU Spinning Disk Confocal Microscope with a CSU-X1 Yokogawa spinning disk scan head on a Prime 95B sCMOS camera (Teledyne Photometrics). The 488/561/647nm laser powers were set at 100/200/20µW with 300/300/150ms exposure times, respectively. Antibodies. We used the rabbit anti-Fis1 antibody against the N-terminal cytoplasmic facing side of the human Fis1 protein, made by Prestige Antibodies Powered by Atlas Antibodies (Sigma-Aldrich, catalog #: HPA017430). The amino acid sequence of the antigen is: MEAVLNELVSVEDLLKFEKKFQSEKAAGSVSKSTQFEYAWCLVRSKYNDDIRKGIVLLEELLPKGS KEEQRDYVFYLAVGNYRLKEYEKALKYVRGLLQTEPQNNQAKELERLIDKAMKKD. Immunofluorescence. Cells were washed in PBS then fixed with 4% PFA for 30 minutes before permeabilization with 0.1% Triton X-100 for 30 minutes. Cells were then blocked overnight with 4% BSA at 4°C. Cells were then incubated with primary antibody for 2 hours, rinsed 3x with PBS for 10 minutes each, then incubated with secondary antibodies (Jackson Immunoresearch Laboratories) for 1 hour, rinsed 3x with PBS for 10 minutes each, then counterstained with Alexa405-phalloidin (ThermoFisher) for 30 minutes, then rinsed with PBS 3x for 10 minutes each, then mounted with ProLong Glass antifade reagent (ThermoFisher). Image processing and analysis. After acquisition, images were Airyscan processed using the auto-filter 2D-SR settings in Zen Blue (ZEISS). All images were post-processed and analyzed using Imaris (BITPLANE) and Fiji software 23 . All images shown are from single focal planes unless stated otherwise. Data quantification and statistics. All line scans were normalized and plotted in Excel. All statistical analyses and graphs were generated using GraphPad Prism 8 software. All graphs display horizontal lines marking average values and error bars indicating standard deviation. AC probe “accumulation” calculation ( Supp. Fig. 5 ): Using Fiji, a square selection was drawn around a region with obvious AC probe accumulation (1.5 µm 2 for mitochondria, 0.6 µm 2 for ER). The mean pixel intensity of the AC probe and mCherry control probe within the selection was measured. Another square of equal dimensions was drawn in an adjacent area with mCherry signal but without obvious AC probe accumulation. Mean pixel intensity was also measured in this region. The mean pixel intensity in the accumulated region was then divided by the mean pixel intensity in the region without accumulation. Determination of coefficient of variance: We measured the extent of sub-organellar “accumulation” by quantifying the coefficient of variance as follows: In Fiji, the mCherry-mito or mCherry-ER signal was used to generate a mask of the mitochondria or ER, respectively. A selection was generated based on this mask (see Fig. 2d and Supp. Fig. 14a ). The mean pixel intensity and standard deviation within the mask were measured. Coefficient of variance was determined by dividing the standard deviation by the mean pixel intensity. Determination of % overlap: Masks of ER, mitochondria, actin, and AC/mCherry probes were generated in Fiji. For AC probes, thresholding was set to mask only the top 25% of AC probe signal based on maximum pixel intensity (see the “clipped” panels in Supp. Fig. 2 ). All other masks were generated using default thresholding settings in Fiji, which uses the IsoData algorithm developed by Ridler and Calvard 24 . The integrated density of each mask was calculated. Areas of overlap between masks were generated using Fiji’s “Image Calculator” and the integrated density of these areas was also measured. These values were used to calculate the % overlap (i.e. integrated density for area of overlap between AC-mito and mitochondria divided by integrated density for mitochondria area yields % of mitochondria overlapped by AC-mito). This percentage was interpreted as the probability of AC probes localizing to fission sites by chance ( Fig. 3c ). Colocalization analysis: Pearson’s correlation coefficient was determined using Fiji’s “Coloc 2” plugin ( https://imagej.net/Coloc_2 ). For analysis of colocalization in regions with or without AC probe accumulation ( Fig. 2c ), a square selection was drawn around a region with obvious AC probe accumulation and an equal-sized square was drawn in an adjacent region without AC probe accumulation. Square sizes were 1.5 µm 2 for AC-mito analysis and 0.6 µm 2 for AC-ER analysis. For mitochondria-ER contact analysis ( Supp. Fig. 11c ), a peripheral region (98.5 µm 2 ) of the cell containing mitochondria and ER was selected. This was done to prevent artificially high values resulting from the large amount of ER and mitochondria overlap typically observed in the perinuclear region, which is too dense to resolve by Airyscan confocal microscopy. FRAP analysis: FRAP experiments were performed on a Zeiss 880 Airyscan confocal microscope using a Plan-Apochromat 63x/1.4 Oil DIC objective. Transfected cells were maintained at 37°C with 5% CO 2 in FluoroBrite DMEM (Gibco) and 10% FBS (VWR) culture medium. 488nm and 561nm excitation laser lines and Airyscan detectors were driven by Zeiss Zen black software. FRAP experiments were done in one focal plane, using the following conditions: 3 pre-bleach frames were acquired at maximum speed with 488nm laser at 25µW and 561nm laser at 13µW power. The photobleaching of selected regions was done with 488nm laser at 5mW power at maximum speed for 30 iterations. The post-bleach acquisition was done with 488nm at pre-bleach imaging settings for 100 frames. The fluorescence intensity of the acquired images were quantified in Fiji following the principles as outlined in Lippincott-Schwartz et al. 2018 25 . The mobile fraction was determined as the percentage of fluorescence recovery at full recovery. The t 1/2 was determined as the time taken for the fluorescence intensity in the bleached region to recover to 50% of the full recovery value after bleaching. If objects moved in or out of the ROI during the recovery phase, they were not included in our analyses. Actin wave pixel intensity measurements: Square selections were made in Fiji (3 selections per cell) and the mean pixel intensity was measured over time. The selections used were 10.1 µm 2 for data collected using Airyscan confocal and 32.8 µm 2 for data collected using spinning disk confocal microscopy. Mitochondrial membrane potential: The mean threshold value for each cell was obtained through thresholding to include mitochondria using the MitoTracker Deep Red channel. The average pixel intensity in the thresholded region was measured. The relative intensity for each cell was then calculated by dividing each cell’s mean threshold value by the average mean threshold value of all un-transfected cells within the same image. The relative signal intensity of each transfected and un-transfected cell was then plotted and graphed. Plasmids. Drp1-mCherry was a kind gift from Gia Voeltz (Addgene plasmid #49152). mCherry-Cyto b 5 RR was a gift from Nica Borgese 26 . Halo-Sec61 27 , Halo-Fis1 (Addgene plasmid #111136), LifeAct-mScarlet (Addgene plasmid #85054), and mTagBFP2-mito 28 used for experiments shown in Figure 2 were gifts from the Lippincott-Schwartz lab. All custom actin nanobody probes were generated starting from the commercial vector of actin chromobody-tagGFP or actin chromobody-tagRFP (ChromoTek) and cloned via the BglII and NotI restriction sites. The following amino acid sequences were attached to the C-terminal of the actin chromobody probes to target the protein either to mitochondria or the ER: Fis1 (AC-mito and LifeAct-GFP-Fis1): IQKETLKGVVVAGGVLAGAVAVASFFLRNKRR 3 Cytb5mito (aka “Cyto b 5 RR”) (AC-GFP-Cytb5mito and LifeAct-GFP-Cytb5mito): FEPSETLITTVESNSSWWTNWVIPAISALVVALMYRR 29 Cytb5ER (AC-ER): IDSSSSWWTNWVIPAISAVAVALMYRLYMAED 3 LifeAct-GFP-Fis1, LifeAct-GFP-Cytb5mito, and AC-GFP-Cytb5mito were generated using PFU Ultra II for megaprimer PCR insertion 30 . The PCR primers, intended modifications, insert templates, and destination plasmids are listed in Supplementary Table 1 . All constructs were sequenced completely across their coding region.
Show full methods section
Cell culture. U2OS, HeLa, and Hap1 cells were purchased from ATCC. HeLa cells stably expressing LifeAct-mCherry were a gift from the Wedlich-Soldner lab 22 . Cells were grown in DMEM supplemented with 10% fetal bovine serum at 37°C with 5% CO 2 . Cells were transfected with Lipofectamine 2000 (ThermoFisher). Cells were plated onto either 8-well #1.5 imaging chambers or #1.5 35mm dishes (Cellvis) that were coated with 10µg/mL fibronectin in PBS at 37°C for 30 minutes prior to plating. 50nM MitoTracker Deep Red (ThermoFisher) was added for 30 minutes then washed for at least 30 minutes to allow for recovery time before imaging in FluoroBrite (ThermoFisher) medium. Airyscan confocal imaging. Cells were imaged with a Plan-Apochromat 63x/1.4NA oil objective on an inverted Zeiss 880 LSM Airyscan confocal microscope with the environmental control system supplying 37°C, 5% CO 2 and humidity for live cell imaging. The GFP channels were imaged with a 488nm laser line at ~500nW laser power. The mCherry or tagRFP channels were imaged with 561nm laser at ~1µW laser power. The MitoTracker Deep Red channel was imaged with ~250nW laser power. For timelapse imaging, the zoom factor was set between 3x-6x to increase the frame rate. In all cases, the maximum pixel dwell time (~0.684µs/pixel) and 2x Nyquist optimal pixel size (~40nm/pixel) was used. Spinning disk confocal imaging. Cells were imaged with a Plan-Apochromat 40x/1.3NA oil objective on a Zeiss CSU Spinning Disk Confocal Microscope with a CSU-X1 Yokogawa spinning disk scan head on a Prime 95B sCMOS camera (Teledyne Photometrics). The 488/561/647nm laser powers were set at 100/200/20µW with 300/300/150ms exposure times, respectively. Antibodies. We used the rabbit anti-Fis1 antibody against the N-terminal cytoplasmic facing side of the human Fis1 protein, made by Prestige Antibodies Powered by Atlas Antibodies (Sigma-Aldrich, catalog #: HPA017430). The amino acid sequence of the antigen is: MEAVLNELVSVEDLLKFEKKFQSEKAAGSVSKSTQFEYAWCLVRSKYNDDIRKGIVLLEELLPKGS KEEQRDYVFYLAVGNYRLKEYEKALKYVRGLLQTEPQNNQAKELERLIDKAMKKD. Immunofluorescence. Cells were washed in PBS then fixed with 4% PFA for 30 minutes before permeabilization with 0.1% Triton X-100 for 30 minutes. Cells were then blocked overnight with 4% BSA at 4°C. Cells were then incubated with primary antibody for 2 hours, rinsed 3x with PBS for 10 minutes each, then incubated with secondary antibodies (Jackson Immunoresearch Laboratories) for 1 hour, rinsed 3x with PBS for 10 minutes each, then counterstained with Alexa405-phalloidin (ThermoFisher) for 30 minutes, then rinsed with PBS 3x for 10 minutes each, then mounted with ProLong Glass antifade reagent (ThermoFisher). Image processing and analysis. After acquisition, images were Airyscan processed using the auto-filter 2D-SR settings in Zen Blue (ZEISS). All images were post-processed and analyzed using Imaris (BITPLANE) and Fiji software 23 . All images shown are from single focal planes unless stated otherwise. Data quantification and statistics. All line scans were normalized and plotted in Excel. All statistical analyses and graphs were generated using GraphPad Prism 8 software. All graphs display horizontal lines marking average values and error bars indicating standard deviation. AC probe “accumulation” calculation ( Supp. Fig. 5 ): Using Fiji, a square selection was drawn around a region with obvious AC probe accumulation (1.5 µm 2 for mitochondria, 0.6 µm 2 for ER). The mean pixel intensity of the AC probe and mCherry control probe within the selection was measured. Another square of equal dimensions was drawn in an adjacent area with mCherry signal but without obvious AC probe accumulation. Mean pixel intensity was also measured in this region. The mean pixel intensity in the accumulated region was then divided by the mean pixel intensity in the region without accumulation. Determination of coefficient of variance: We measured the extent of sub-organellar “accumulation” by quantifying the coefficient of variance as follows: In Fiji, the mCherry-mito or mCherry-ER signal was used to generate a mask of the mitochondria or ER, respectively. A selection was generated based on this mask (see Fig. 2d and Supp. Fig. 14a ). The mean pixel intensity and standard deviation within the mask were measured. Coefficient of variance was determined by dividing the standard deviation by the mean pixel intensity. Determination of % overlap: Masks of ER, mitochondria, actin, and AC/mCherry probes were generated in Fiji. For AC probes, thresholding was set to mask only the top 25% of AC probe signal based on maximum pixel intensity (see the “clipped” panels in Supp. Fig. 2 ). All other masks were generated using default thresholding settings in Fiji, which uses the IsoData algorithm developed by Ridler and Calvard 24 . The integrated density of each mask was calculated. Areas of overlap between masks were generated using Fiji’s “Image Calculator” and the integrated density of these areas was also measured. These values were used to calculate the % overlap (i.e. integrated density for area of overlap between AC-mito and mitochondria divided by integrated density for mitochondria area yields % of mitochondria overlapped by AC-mito). This percentage was interpreted as the probability of AC probes localizing to fission sites by chance ( Fig. 3c ). Colocalization analysis: Pearson’s correlation coefficient was determined using Fiji’s “Coloc 2” plugin ( https://imagej.net/Coloc_2 ). For analysis of colocalization in regions with or without AC probe accumulation ( Fig. 2c ), a square selection was drawn around a region with obvious AC probe accumulation and an equal-sized square was drawn in an adjacent region without AC probe accumulation. Square sizes were 1.5 µm 2 for AC-mito analysis and 0.6 µm 2 for AC-ER analysis. For mitochondria-ER contact analysis ( Supp. Fig. 11c ), a peripheral region (98.5 µm 2 ) of the cell containing mitochondria and ER was selected. This was done to prevent artificially high values resulting from the large amount of ER and mitochondria overlap typically observed in the perinuclear region, which is too dense to resolve by Airyscan confocal microscopy. FRAP analysis: FRAP experiments were performed on a Zeiss 880 Airyscan confocal microscope using a Plan-Apochromat 63x/1.4 Oil DIC objective. Transfected cells were maintained at 37°C with 5% CO 2 in FluoroBrite DMEM (Gibco) and 10% FBS (VWR) culture medium. 488nm and 561nm excitation laser lines and Airyscan detectors were driven by Zeiss Zen black software. FRAP experiments were done in one focal plane, using the following conditions: 3 pre-bleach frames were acquired at maximum speed with 488nm laser at 25µW and 561nm laser at 13µW power. The photobleaching of selected regions was done with 488nm laser at 5mW power at maximum speed for 30 iterations. The post-bleach acquisition was done with 488nm at pre-bleach imaging settings for 100 frames. The fluorescence intensity of the acquired images were quantified in Fiji following the principles as outlined in Lippincott-Schwartz et al. 2018 25 . The mobile fraction was determined as the percentage of fluorescence recovery at full recovery. The t 1/2 was determined as the time taken for the fluorescence intensity in the bleached region to recover to 50% of the full recovery value after bleaching. If objects moved in or out of the ROI during the recovery phase, they were not included in our analyses. Actin wave pixel intensity measurements: Square selections were made in Fiji (3 selections per cell) and the mean pixel intensity was measured over time. The selections used were 10.1 µm 2 for data collected using Airyscan confocal and 32.8 µm 2 for data collected using spinning disk confocal microscopy. Mitochondrial membrane potential: The mean threshold value for each cell was obtained through thresholding to include mitochondria using the MitoTracker Deep Red channel. The average pixel intensity in the thresholded region was measured. The relative intensity for each cell was then calculated by dividing each cell’s mean threshold value by the average mean threshold value of all un-transfected cells within the same image. The relative signal intensity of each transfected and un-transfected cell was then plotted and graphed. Plasmids. Drp1-mCherry was a kind gift from Gia Voeltz (Addgene plasmid #49152). mCherry-Cyto b 5 RR was a gift from Nica Borgese 26 . Halo-Sec61 27 , Halo-Fis1 (Addgene plasmid #111136), LifeAct-mScarlet (Addgene plasmid #85054), and mTagBFP2-mito 28 used for experiments shown in Figure 2 were gifts from the Lippincott-Schwartz lab. All custom actin nanobody probes were generated starting from the commercial vector of actin chromobody-tagGFP or actin chromobody-tagRFP (ChromoTek) and cloned via the BglII and NotI restriction sites. The following amino acid sequences were attached to the C-terminal of the actin chromobody probes to target the protein either to mitochondria or the ER: Fis1 (AC-mito and LifeAct-GFP-Fis1): IQKETLKGVVVAGGVLAGAVAVASFFLRNKRR 3 Cytb5mito (aka “Cyto b 5 RR”) (AC-GFP-Cytb5mito and LifeAct-GFP-Cytb5mito): FEPSETLITTVESNSSWWTNWVIPAISALVVALMYRR 29 Cytb5ER (AC-ER): IDSSSSWWTNWVIPAISAVAVALMYRLYMAED 3 LifeAct-GFP-Fis1, LifeAct-GFP-Cytb5mito, and AC-GFP-Cytb5mito were generated using PFU Ultra II for megaprimer PCR insertion 30 . The PCR primers, intended modifications, insert templates, and destination plasmids are listed in Supplementary Table 1 . All constructs were sequenced completely across their coding region.
Supplementary Material zip file of all supplementary movies Supplementary Video 1: Live cell imaging of mitochondria-associated actin. A Hap1 cell expressing AC-mito counterstained with MitoTracker shows dynamic subdomains of actin enrichment on mitochondria. Supplementary Video 2: Live cell imaging of mitochondria-associated actin. A Hap1 cell expressing AC-mito counterstained with MitoTracker shows dynamic subdomains of actin enrichment on mitochondria. Supplementary Video 3: Live cell imaging of ER-associated actin. A Hap1 cell expressing AC-ER counterstained with MitoTracker shows dynamic subdomains of actin enrichment on the ER, in particular at ER-mitochondria contact sites. Supplementary Video 4: Live cell imaging of ER-associated actin. A Hap1 cell expressing AC-ER counterstained with MitoTracker shows dynamic subdomains of actin enrichment on the ER, in particular at ER-mitochondria contact sites. Supplementary Video 5: FRAP of cell co-expressing AC-mito and mCherry-mito. FRAP of U2OS cells co-expressing AC-mito and mCherry-mito shows that AC-mito is highly mobile but less mobile than mCherry-mito. Supplementary Video 6: FRAP of cell co-expressing AC-ER and mCherry-ER. FRAP of U2OS cells co-expressing AC-ER and mCherry-ER shows that AC-ER is highly mobile but less mobile than mCherry-ER. Supplementary Video 7: Live imaging of LifeAct and AC-mito durng actin wave cycling. Co-accumulation of LifeAct and AC-mito is observable in several regions of the cell during actin wave cycling. Scale bar: 5 µm. Graphs display the normalized average pixel intensity over time within the indicated boxed regions. This video corresponds to Figure 2B . Supplementary Video 8: Live imaging of LifeAct and AC-ER durng actin wave cycling (single cell). Co-accumulation of the F-actin marker LifeAct and AC-ER is observable during actin wave cycling. Scale bar: 5 µm. Graphs display the normalized average pixel intensity over time within the indicated boxed regions. This video corresponds to Extended Data Figure 7 . Supplementary Video 9: Live imaging of LifeAct and AC-ER during actin wave cycling (field of cells). Co-accumulation of LifeAct and AC-ER is concsistently observed during actin wave cycling in multiple cells. The box indicates the cell shown in Extended Data Figure 7 and Supplementary Video 8 . Scale bar: 10 µm. Supplementary Video 10: Live imaging of AC-mito and Halo-mito during mitochondrial fission. Live imaging of AC-mito, Halo-mito (Halo-Fis1), and mitochondria (BFP-mito) in HeLa cells reveals accumulation of mitochondria-associated actin prior to fission. Scale bar: 1 µm. This video corresponds to Figure 2D . Supplementary Video 11: Live imaging of AC-mito and mitochondrial fragmentaion with ionomycin treatment. Live imaging of AC-mito in HeLa cells counterstained with MitoTracker treated with 10 µM ionomycin reveals mitochondrial fragmentation. Fragmention occurs simultaneously across cells regardless of AC-mito expression. Scale bar: 20 µm. Supplementary Video 12: Live imaging of AC-ER and mitochondrial fragmentaion with ionomycin treatment. Live imaging of AC-ER in HeLa cells counterstained with MitoTracker treated with 10 µM ionomycin reveals mitochondrial fragmentation. Fragmention occurs simultaneously across cells regardless of AC-ER expression. Scale bar: 20 µm. Supplementary Video 13: Live imaging of AC-mito during mitochondrial fission. Live imaging of AC-mito in HeLa cells counterstained with MitoTracker reveals accumulation of mitochondria-associated actin prior to fission. Scale bar: 0.5 µm. This video corresponds to Figure 3A . Supplementary Video 14: Live imaging of AC-ER during mitochondrial fission. Live imaging of AC-ER in HeLa cells co-expressing BFP-mito reveals accumulation of ER-associated actin prior to fission. Scale bar: 1 µm. This montage corresponds to Figure 3B . Supplementary Video 15: Live imaging of AC-ER during Drp1-mediated mitochondrial fission. Live imaging of AC-ER and mCherry-Drp1 in HeLa cells counterstained with MitoTracker reveals accumulation of ER-associated actin prior Drp1 accumulation and mitochondrial fission. Scale bar: 1 µm. This video corresponds to Extended Data Figure 9A . Supplementary Video 16: Live imaging of AC-mito during Drp1-mediated mitochondrial fission. Live imaging of AC-mito and mCherry-Drp1 in HeLa cells counterstained with MitoTracker reveals accumulation of mitochondria-associated actin prior Drp1 accumulation and mitochondrial fission. Scale bar: 1 µm. This video corresponds to Extended Data Figure 9B . Supplementary Video 17: Live imaging of AC-mito and mCherry-mito during mitochondrial fission. Live imaging of AC-mito and mCherry-mito in HeLa cells counterstained with MitoTracker reveals accumulation of mitochondria-associated actin prior to mitochondrial fission. Scale bar: 1 µm. This video corresponds to Supplementary Figure 5 . Supplementary Video 18: Live imaging of AC-ER during ER-mediated mitochondrial fission. Live imaging of AC-ER and mCherry-ER in HeLa cells counterstained with MitoTracker reveals accumulation of ER-associated actin prior to ER-mediated mitochondrial fission. Scale bar: 1 µm. This video corresponds to Extended Data Figure 10A . Supplementary Video 19: Live imaging of AC-mito during ER-mediated mitochondrial fission. Live imaging of AC-mito and mCherry-ER in HeLa cells counterstained with MitoTracker reveals accumulation of mitochondria-associated actin prior to ER-mediated mitochondrial fission. Scale bar: 1 µm. This video corresponds to Extended Data Figure 10B . Supplementary Video 20: Example of artifact resulting from AC-mito overexpression. Live imaging of AC-mito in a HeLa cell counterstained with MitoTracker. Mild mitochondrial clustering and a decrease in mitochondrial movement is evident in the perinuclear region coinciding with a high degree of AC-mito signal. Scale bar: 10 µm. Supplementary Video 21: Live imaging of AC-mito and AC-ER during mitochondrial fission. Live imaging of AC-mito and AC-ER in HeLa cells counterstained with MitoTracker reveals accumulation of mitochondria-associated actin prior to accumulation of ER-associated actin. Scale bar: 1 µm. This video corresponds to Figure 3D . Supp fig 1 Supplementary Figure 1: Montage of AC-mito accumulation during mitochondrial fission. AC-mito accumulation prior to mitochondrial fission is shown across 20 time points. Scale bar: 0.5 µm. This montage corresponds to Figure 3A . Supp fig 2 Supplementary Figure 2: Montage of AC-ER accumulation during mitochondrial fission. AC-ER accumulation prior to mitochondrial fission is shown across 20 time points. Mitochondria are labeled with BFP-mito. Scale bar: 0.5 µm. This montage corresponds to Figure 3B . Supp fig 3 Supplementary Figure 3: Montage of AC-ER accumulation during Drp1-mediated mitochondrial fission. AC-ER accumulation prior to Drp1 recruitment and mitochondrial fission is shown across 20 time points. Scale bar: 0.5 µm. This montage corresponds to Extended Data Figure 9A . Supp fig 4 Supplementary Figure 4: Montage of AC-mito accumulation during Drp1-mediated mitochondrial fission. AC-mito accumulation prior to Drp1 recruitment and mitochondrial fission is shown across 20 time points. Scale bar: 0.5 µm. This montage corresponds to Extended Data Figure 9B . Supp fig 5 Supplementary Figure 5: Mitochondria-associated actin accumulates specifically at mitochondrial fission sites. AC-mito accumulation is evident at sites of mitochondrial fission. Hollow arrows mark the location of mitochondrial fission. Yellow lines in the left column mark the area used to generate the line scans. Scale bar: 1 µm. Example images of the areas used to determine the degree of MitoTracker overlap and coefficient of variance for mCherry/AC-mito and the resulting values are also shown. Supp fig 6 Supplementary Figure 6: Montage of AC-mito accumulation during mitochondrial fission. AC-mito accumulation prior to mitochondrial fission is shown across 20 time points. Scale bar: 0.5 µm. This montage corresponds to Supplementary Figure 5 . Supp fig 7 Supplementary Figure 7: Montage of AC-ER accumulation during ER-mediated mitochondrial fission. AC-ER accumulation prior to ER-mediated mitochondrial fission is shown across 20 time points. Scale bar: 0.5 µm. This montage corresponds to Extended Data Figure 10A . Supp fig 8 Supplementary Figure 8: Montage of AC-mito accumulation during ER-mediated mitochondrial fission. AC-mito accumulation prior to ER-mediated mitochondrial fission is shown across 20 time points. Scale bar: 0.5 µm. This montage corresponds to Extended Data Figure 10B . Supp fig 9 Supplementary Figure 9: Montage of AC-mito and AC-ER accumulation during mitochondrial fission. AC-mito accumulation followed by AC-ER accumulation, followed by mitochondrial fission is shown across 35 time points. Scale bar: 0.5 µm. This montage corresponds to Figure 3D . Supp fig 10 Supp fig 11 Supp fig 12 Supp fig 13 Supp fig 14 Supp fig 15 Supp fig 16 Supp fig 17 Supp fig 18 Supp mov 6 Supp mov 4 Supp mov 5 Supp mov 3 Supp mov 2 Supp mov 1 Supp mov 17 Supp mov 16 Supp mov 14 Supp mov 15 Supp mov 13 Supp mov 12 Supp mov 10 Supp mov 9 Supp mov 8 Supp mov 7 Supp mov 11 Supplementary Table 1 Supplementary Table 1: Primers and plasmids used to generate the expression constructs for these studies.
📊 Figures
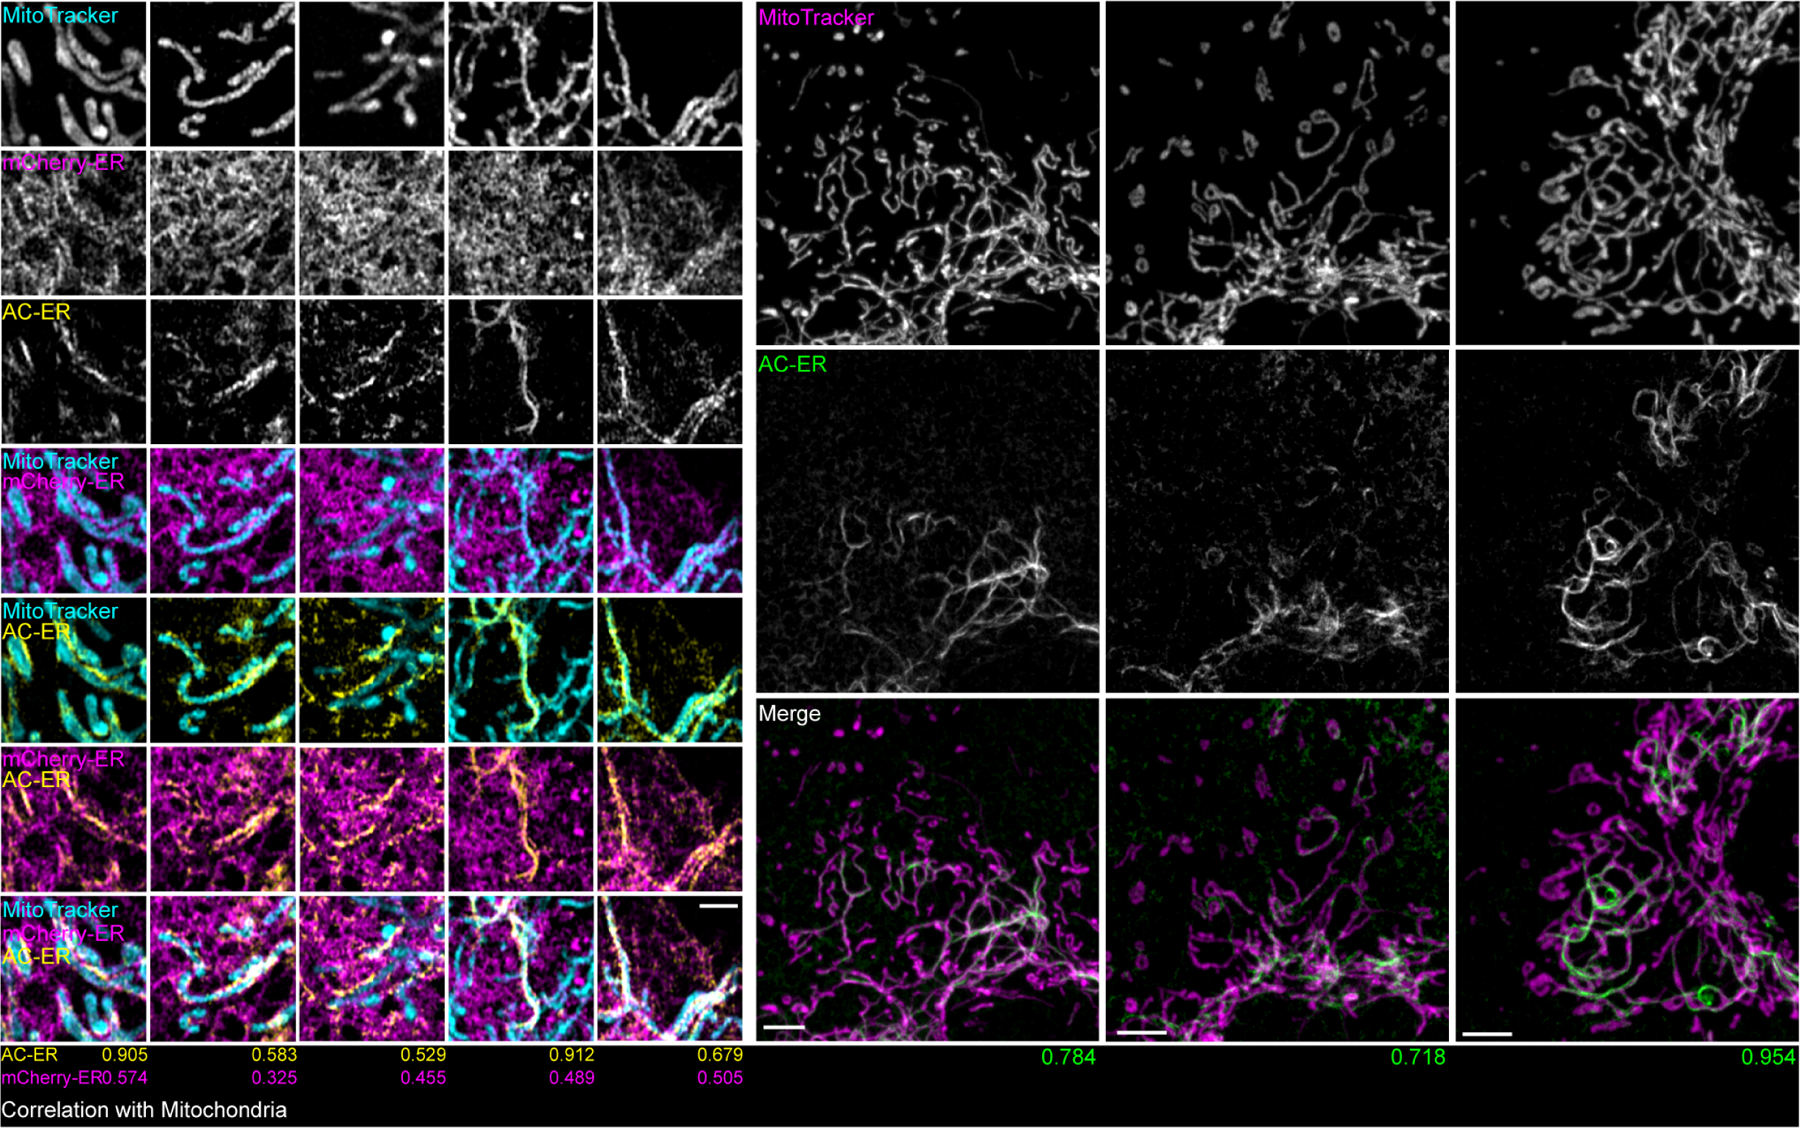
Extended Data Figure 1:
AC-ER accumulates alongside mitochondria.
Left: five high magnification examples of AC-ER accumulating specifically alongside mitochondria are shown. Note that the mCherry-ER control probe does not specifically accumulate in these regions. Th...
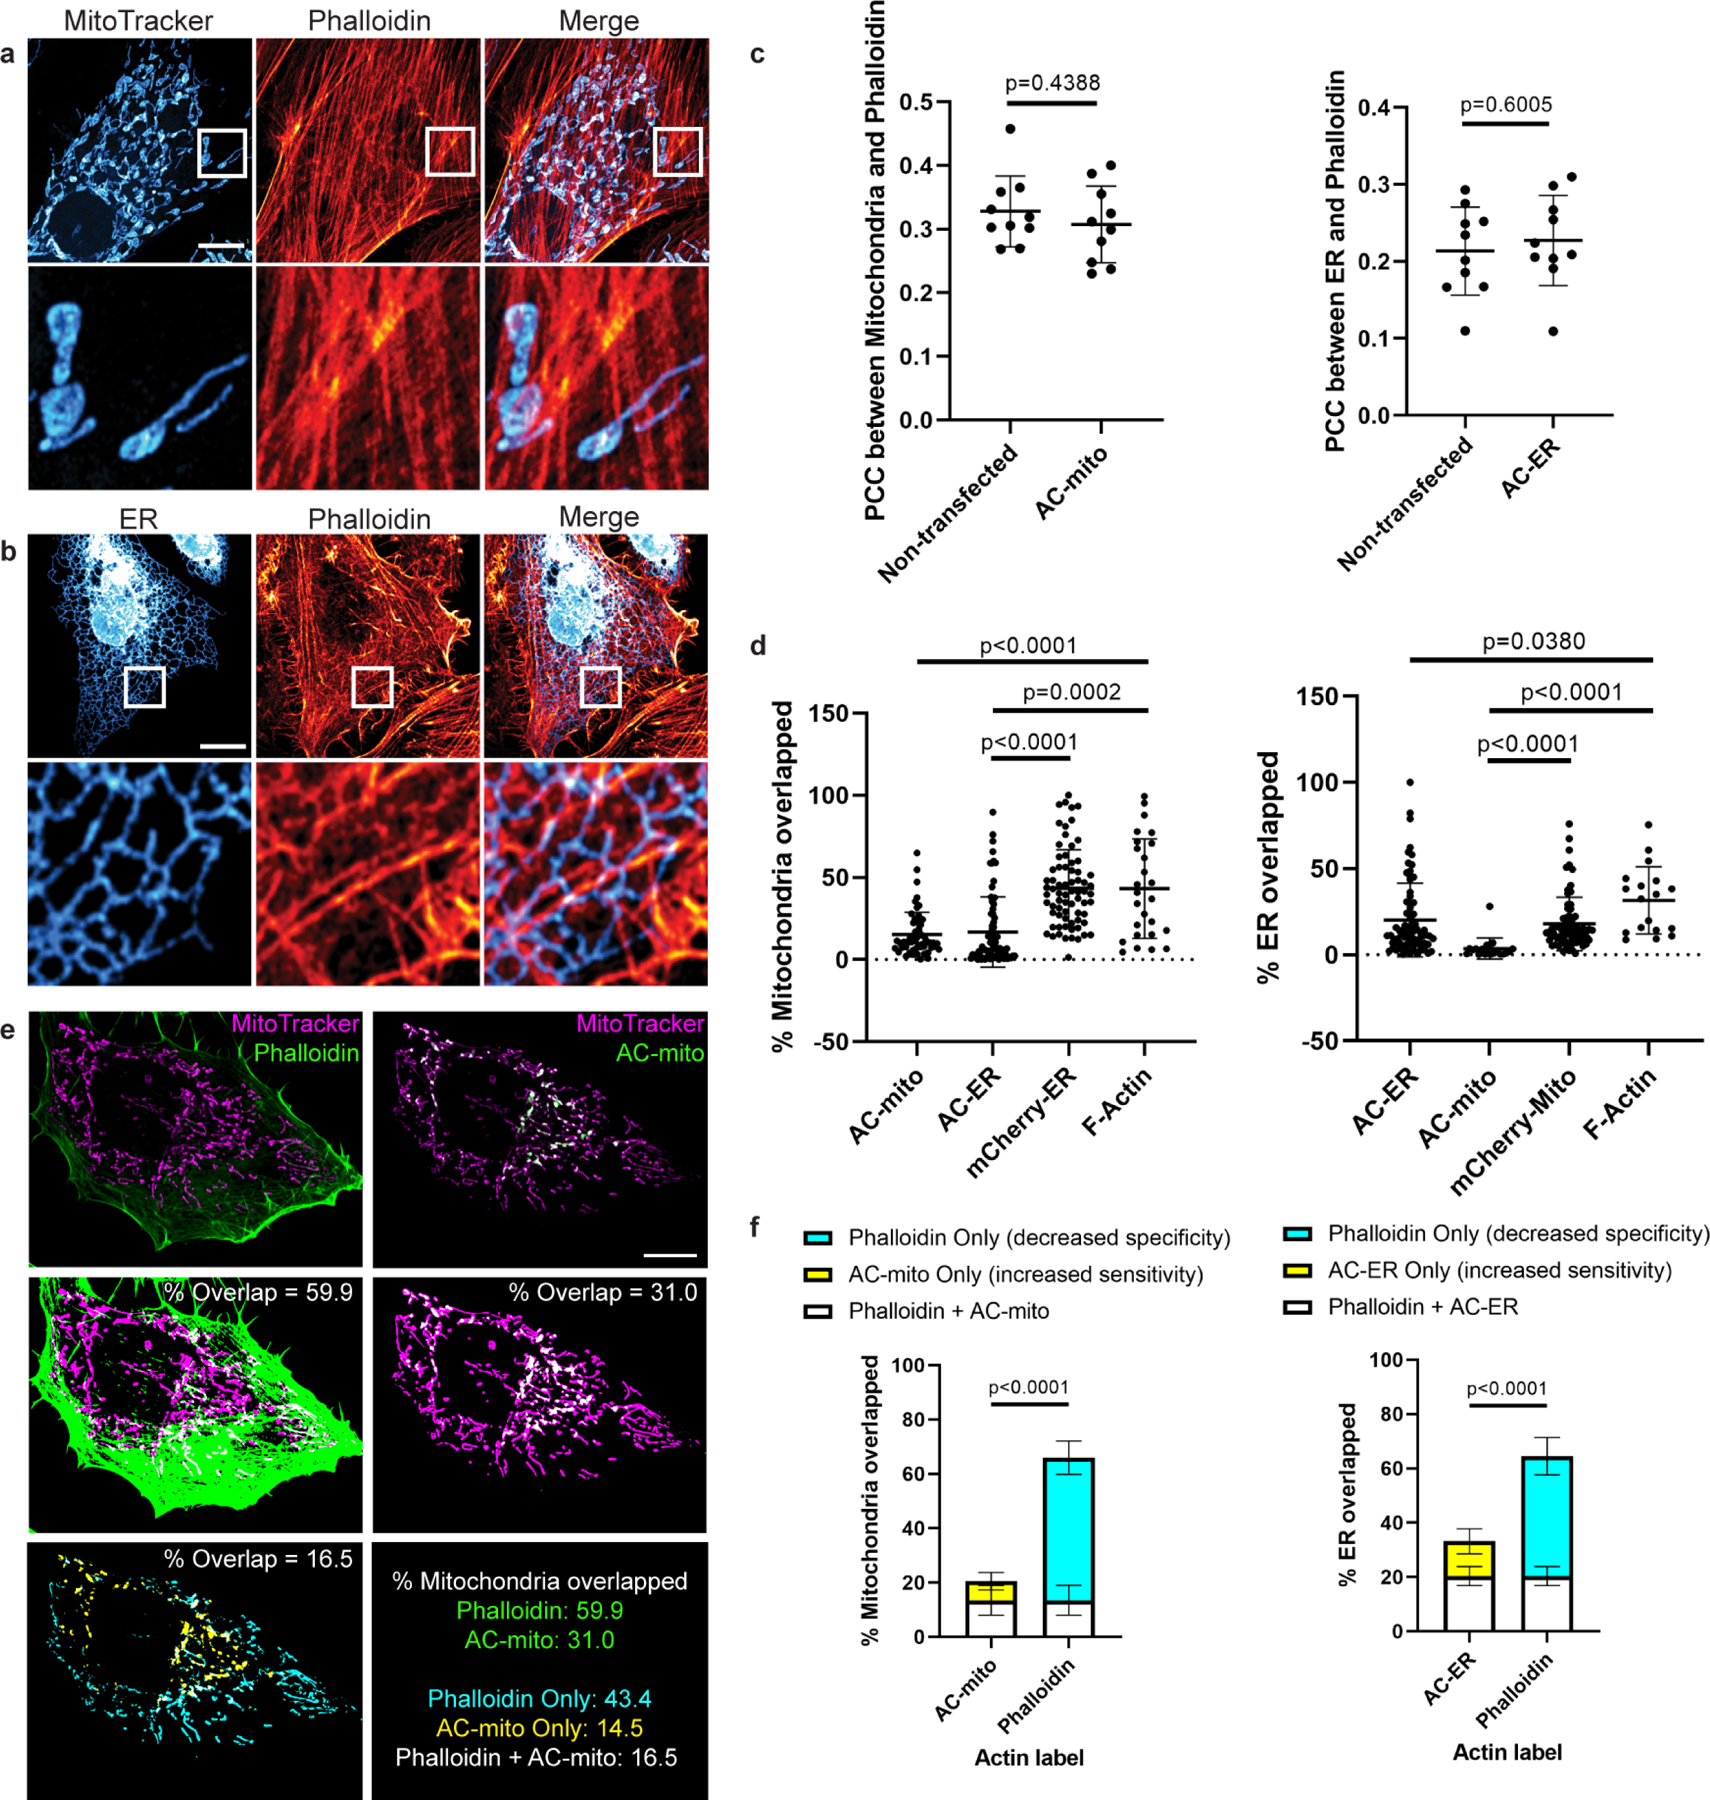
Extended Data Figure 2:
AC probes provide higher sensitivity and specificity for imaging sub-organellar F-actin accumulation.
A) Maximum projection of cells stained with phalloidin and MitoTracker do not show obvious sites of accumulation of actin on mitochondria. Scale bar: 10u00b5m. These results were reproducible across 1...
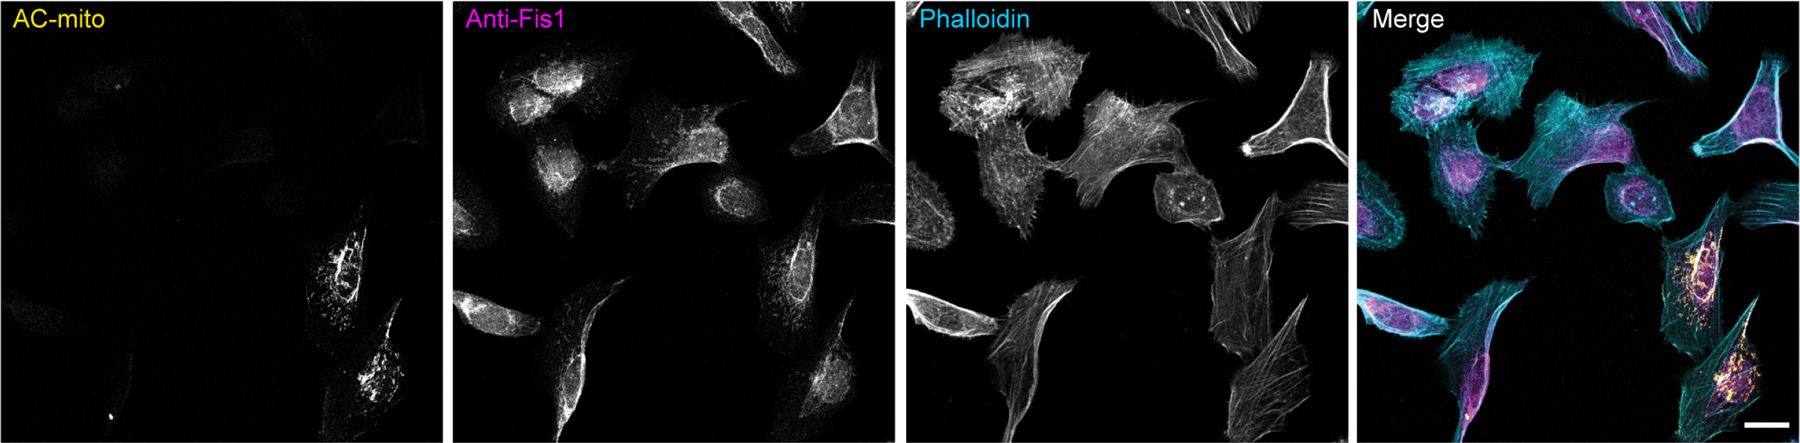
Extended Data Figure 3:
AC-mito expression does not alter endogenous Fis1 localization to mitochondria.
Maximum projection of cells expressing AC-mito and non-transfected cells show similar levels of endogenous anti-Fis1 immunofluorescence. Note that the anti-Fis1 antigen is the Fis1 N-terminus, which i...
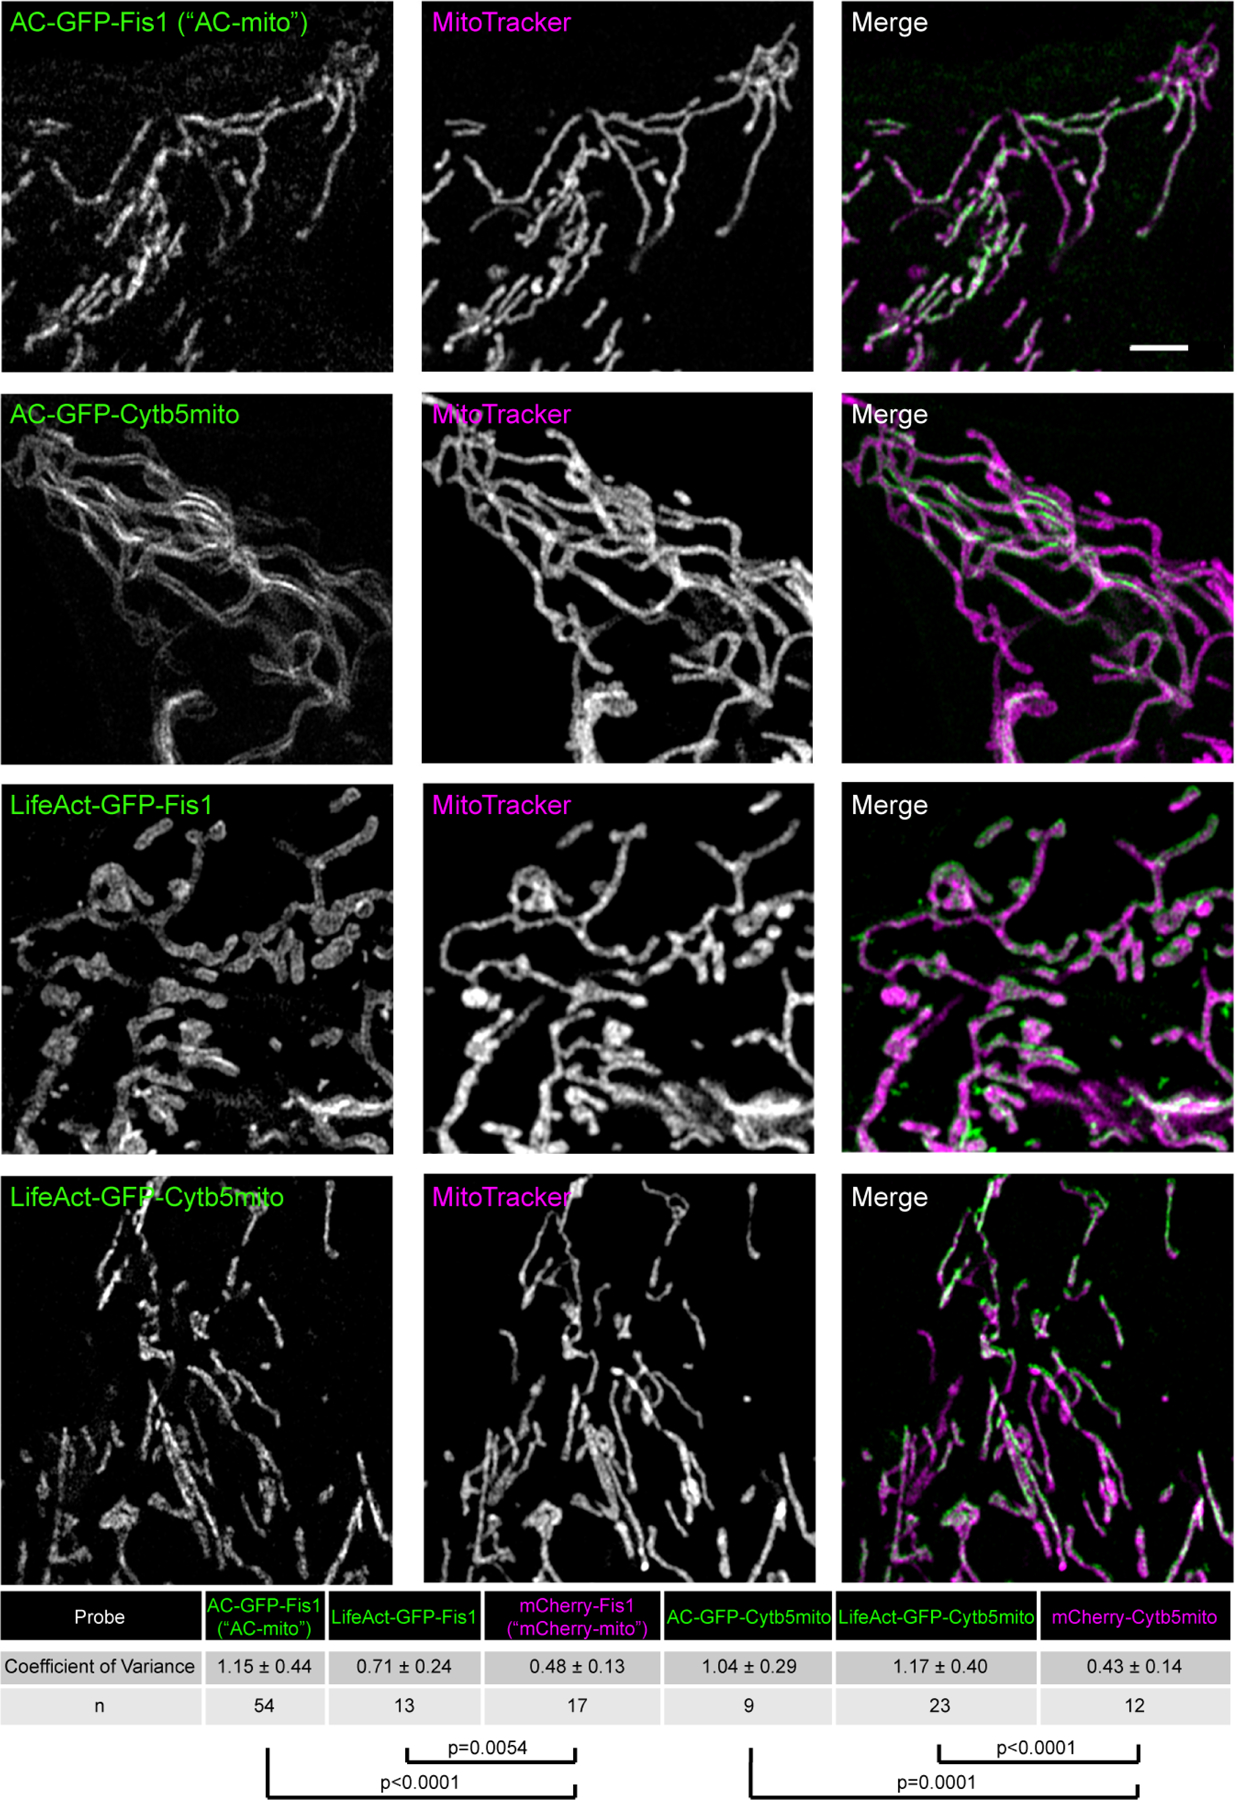
Extended Data Figure 4:
Alternate membrane-targeting and actin-binding motifs yield similar results.
Switching the actin nanobody motif with LifeAct (Fis1-LifeAct-GFP) yields similarly increased accumulation compared to control constructs as quantified by the coefficient of variance. Switching the Fi...
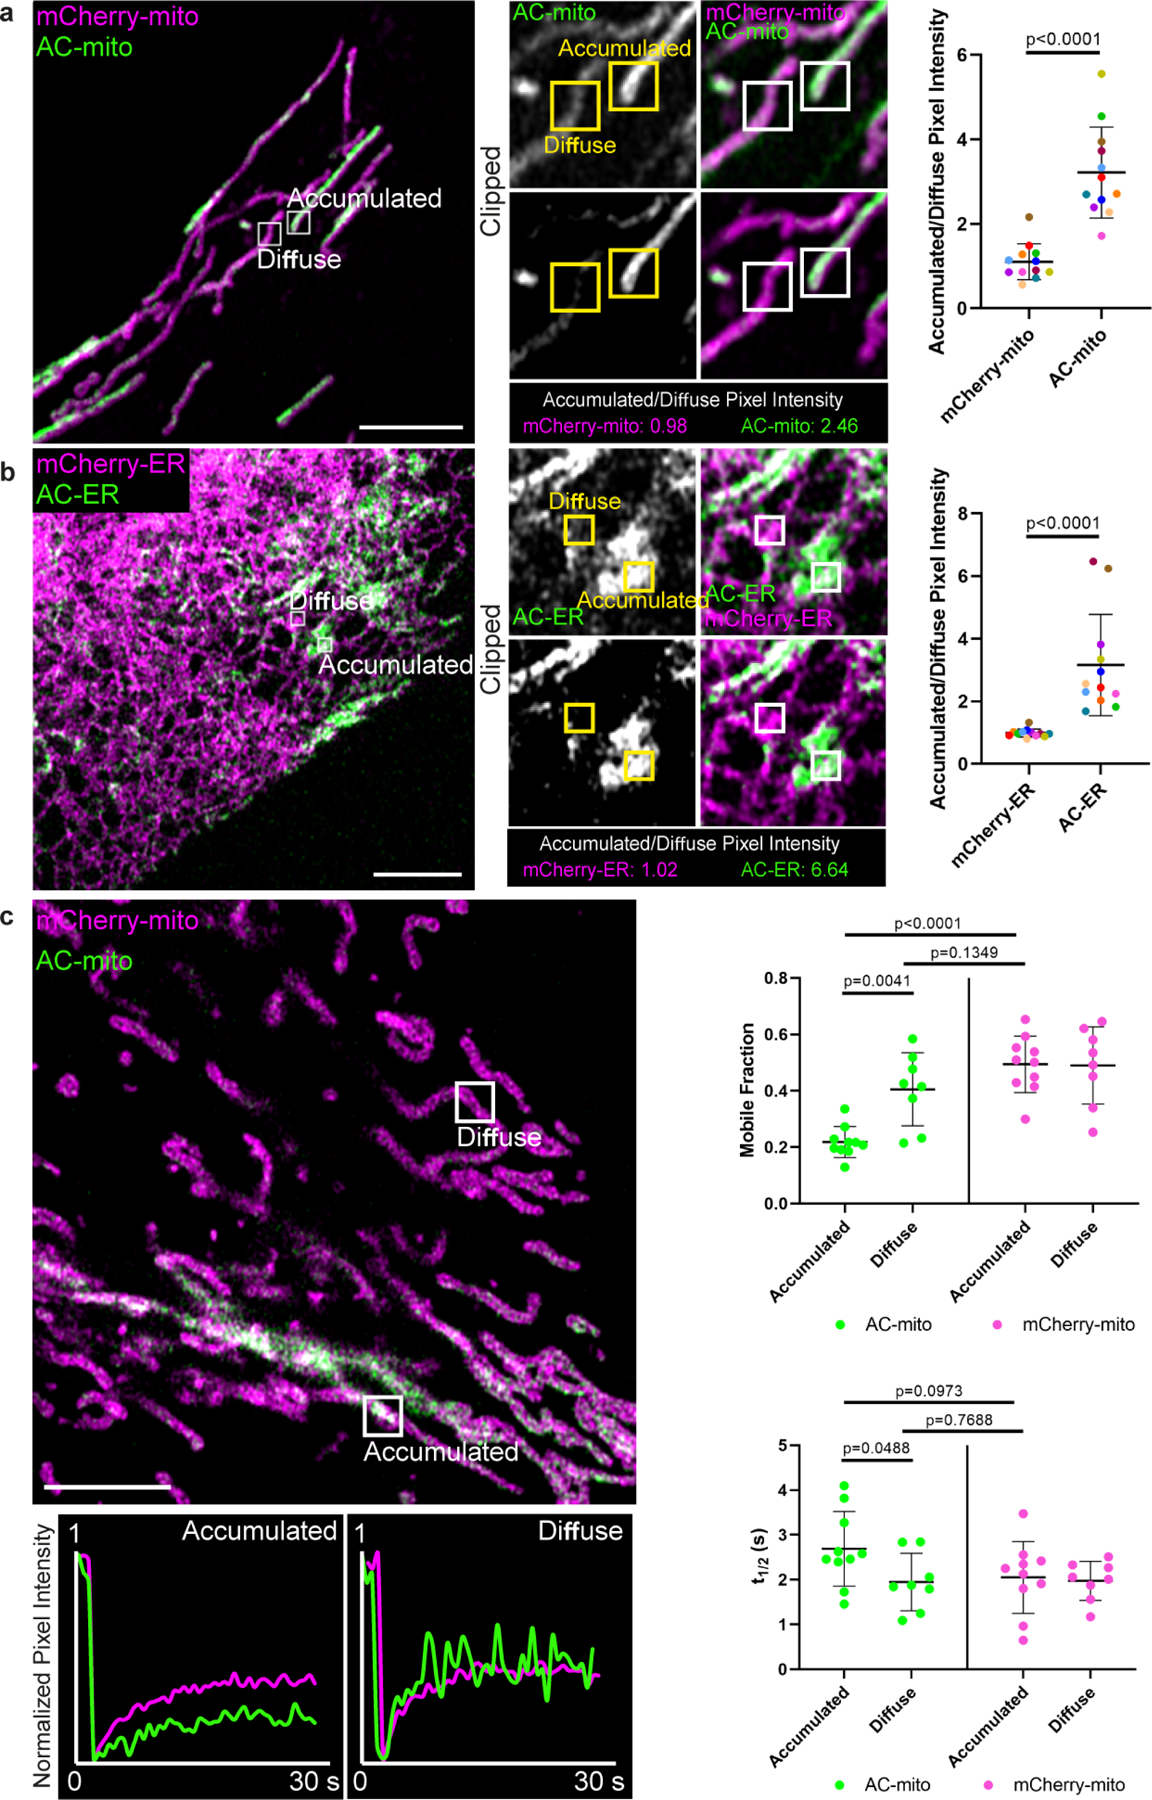
Extended Data Figure 5:
Comparison of AC probe dynamics in u201caccumulatedu201d vs. u201cdiffuseu201d regions.
A) Example of a cell containing regions with accumulated vs. diffuse AC probe localization. Regions with AC-mito accumulation (u201cAccumulatedu201d) and without AC-mito accumulation (u201cDiffuseu201...
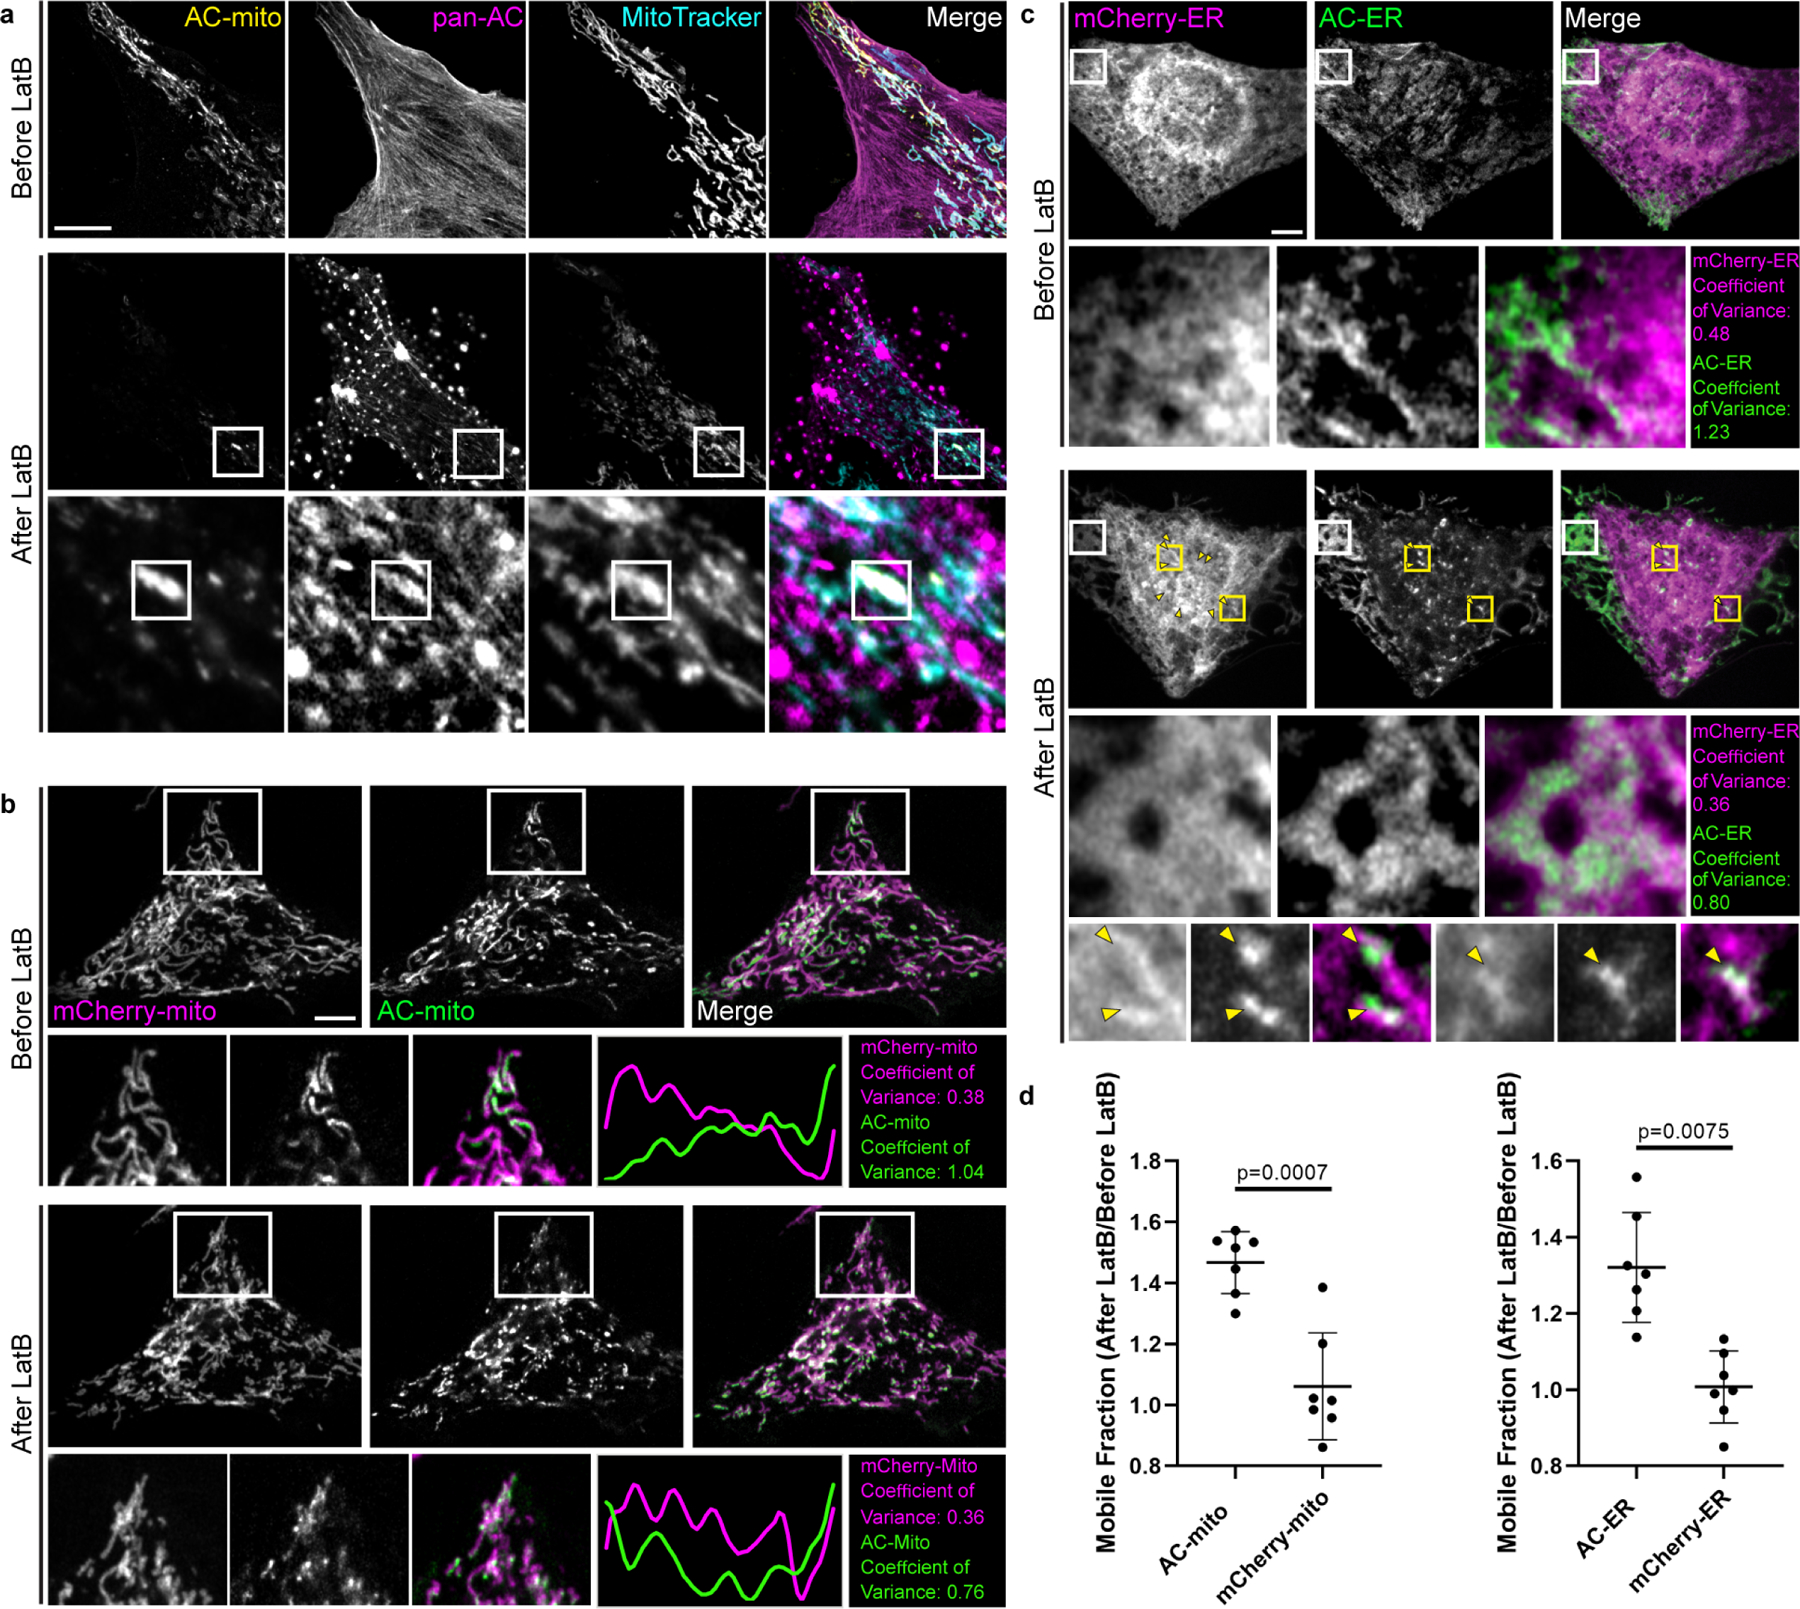
Extended Data Figure 6:
Actin depolymerization destroys AC-mito and AC-ER accumulation.
A) U2OS cells stained with MitoTracker and expressing AC-mito and pan-AC (cytoplasmic AC-tagRFP) were imaged before and after treatment with 2 u00b5M Latrunculin B (LatB) for 30 minutes. After LatB tr...
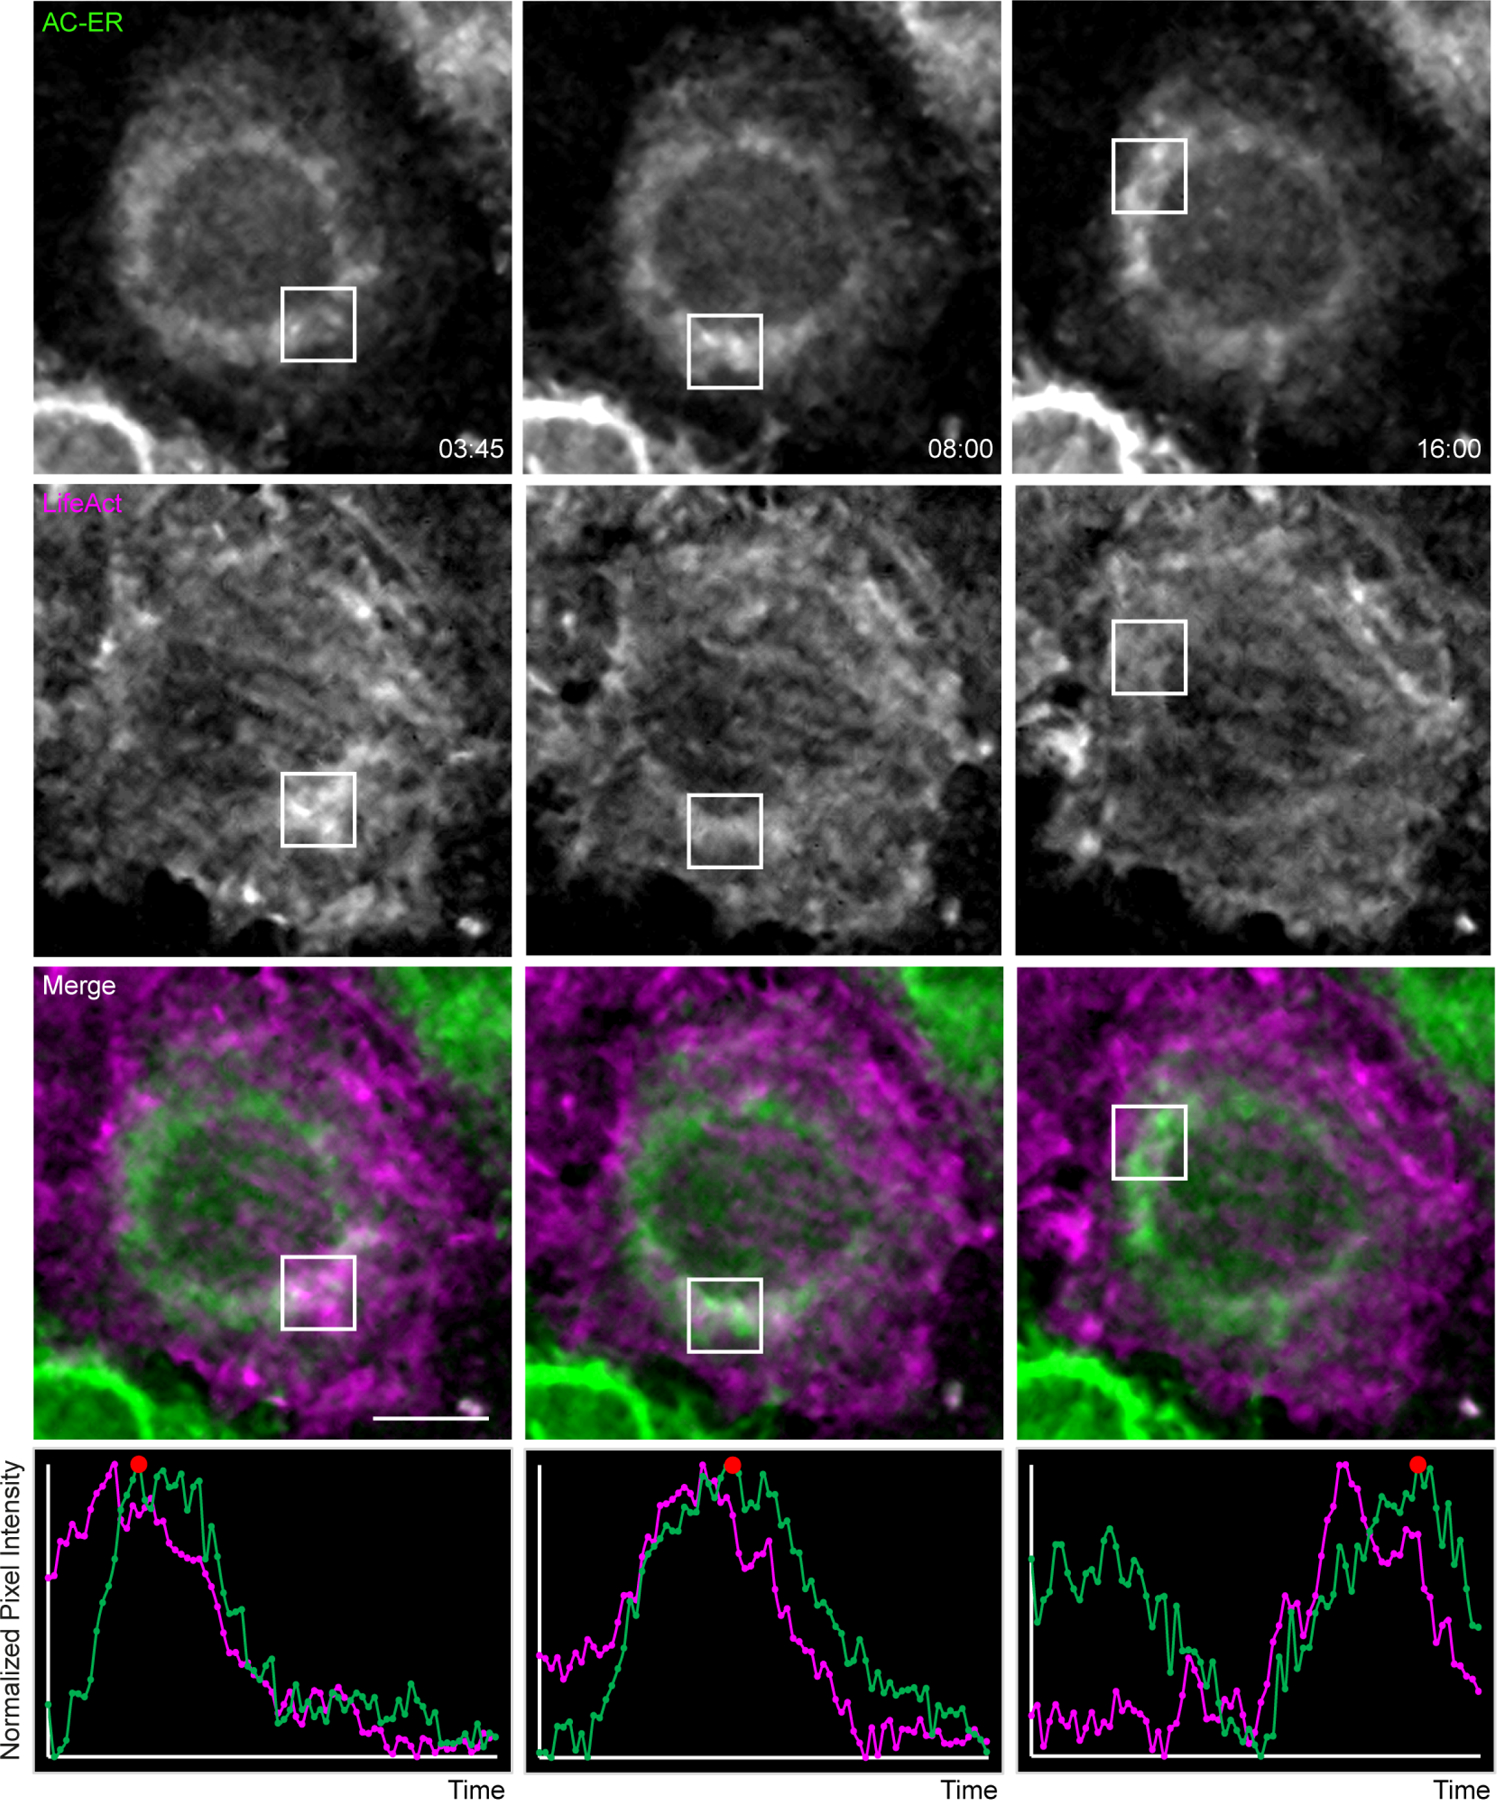
Extended Data Figure 7:
AC-ER dynamically co-accumulates with F-actin during actin wave cycling.
Actin waves were imaged in HeLa cells co-expressing AC-ER and the F-actin marker LifeAct. Boxes mark regions of LifeAct accumulation at different timepoints. Graphs displaying normalized pixel intensi...
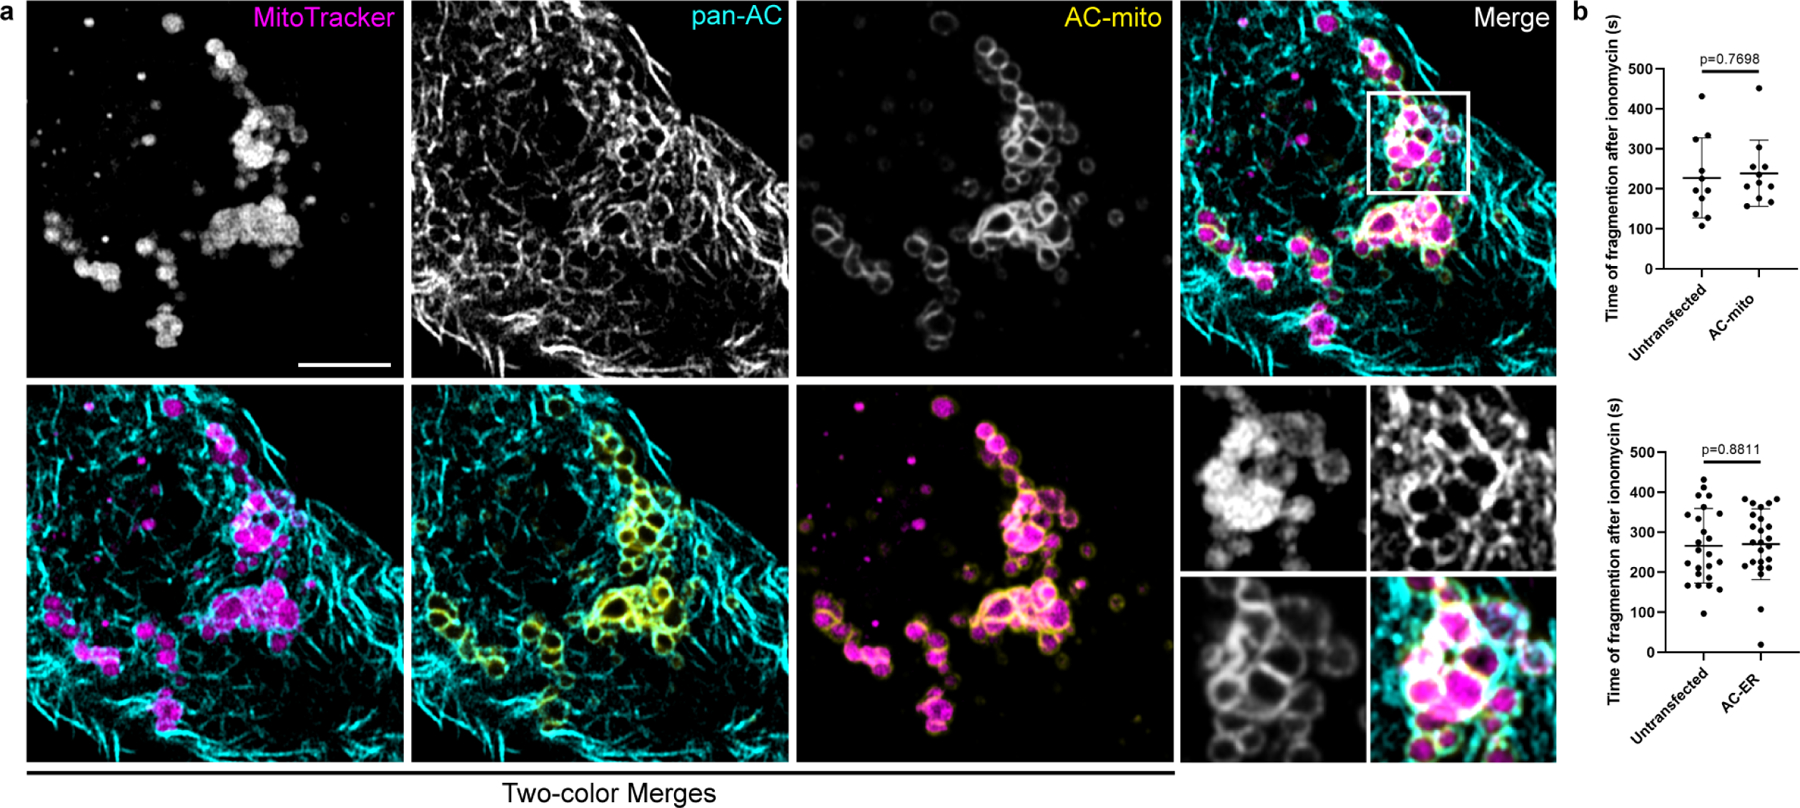
Extended Data Figure 8:
Impact of ionomycin treatment on cells expressing AC probes.
A) HeLa cells stained with MitoTracker and expressing AC-mito and pan-AC (cytoplasmic AC-tagRFP) were treated with 10 u00b5M ionomycin for 10 minutes. Fragmented mitochondria surrounded by both pan-AC...
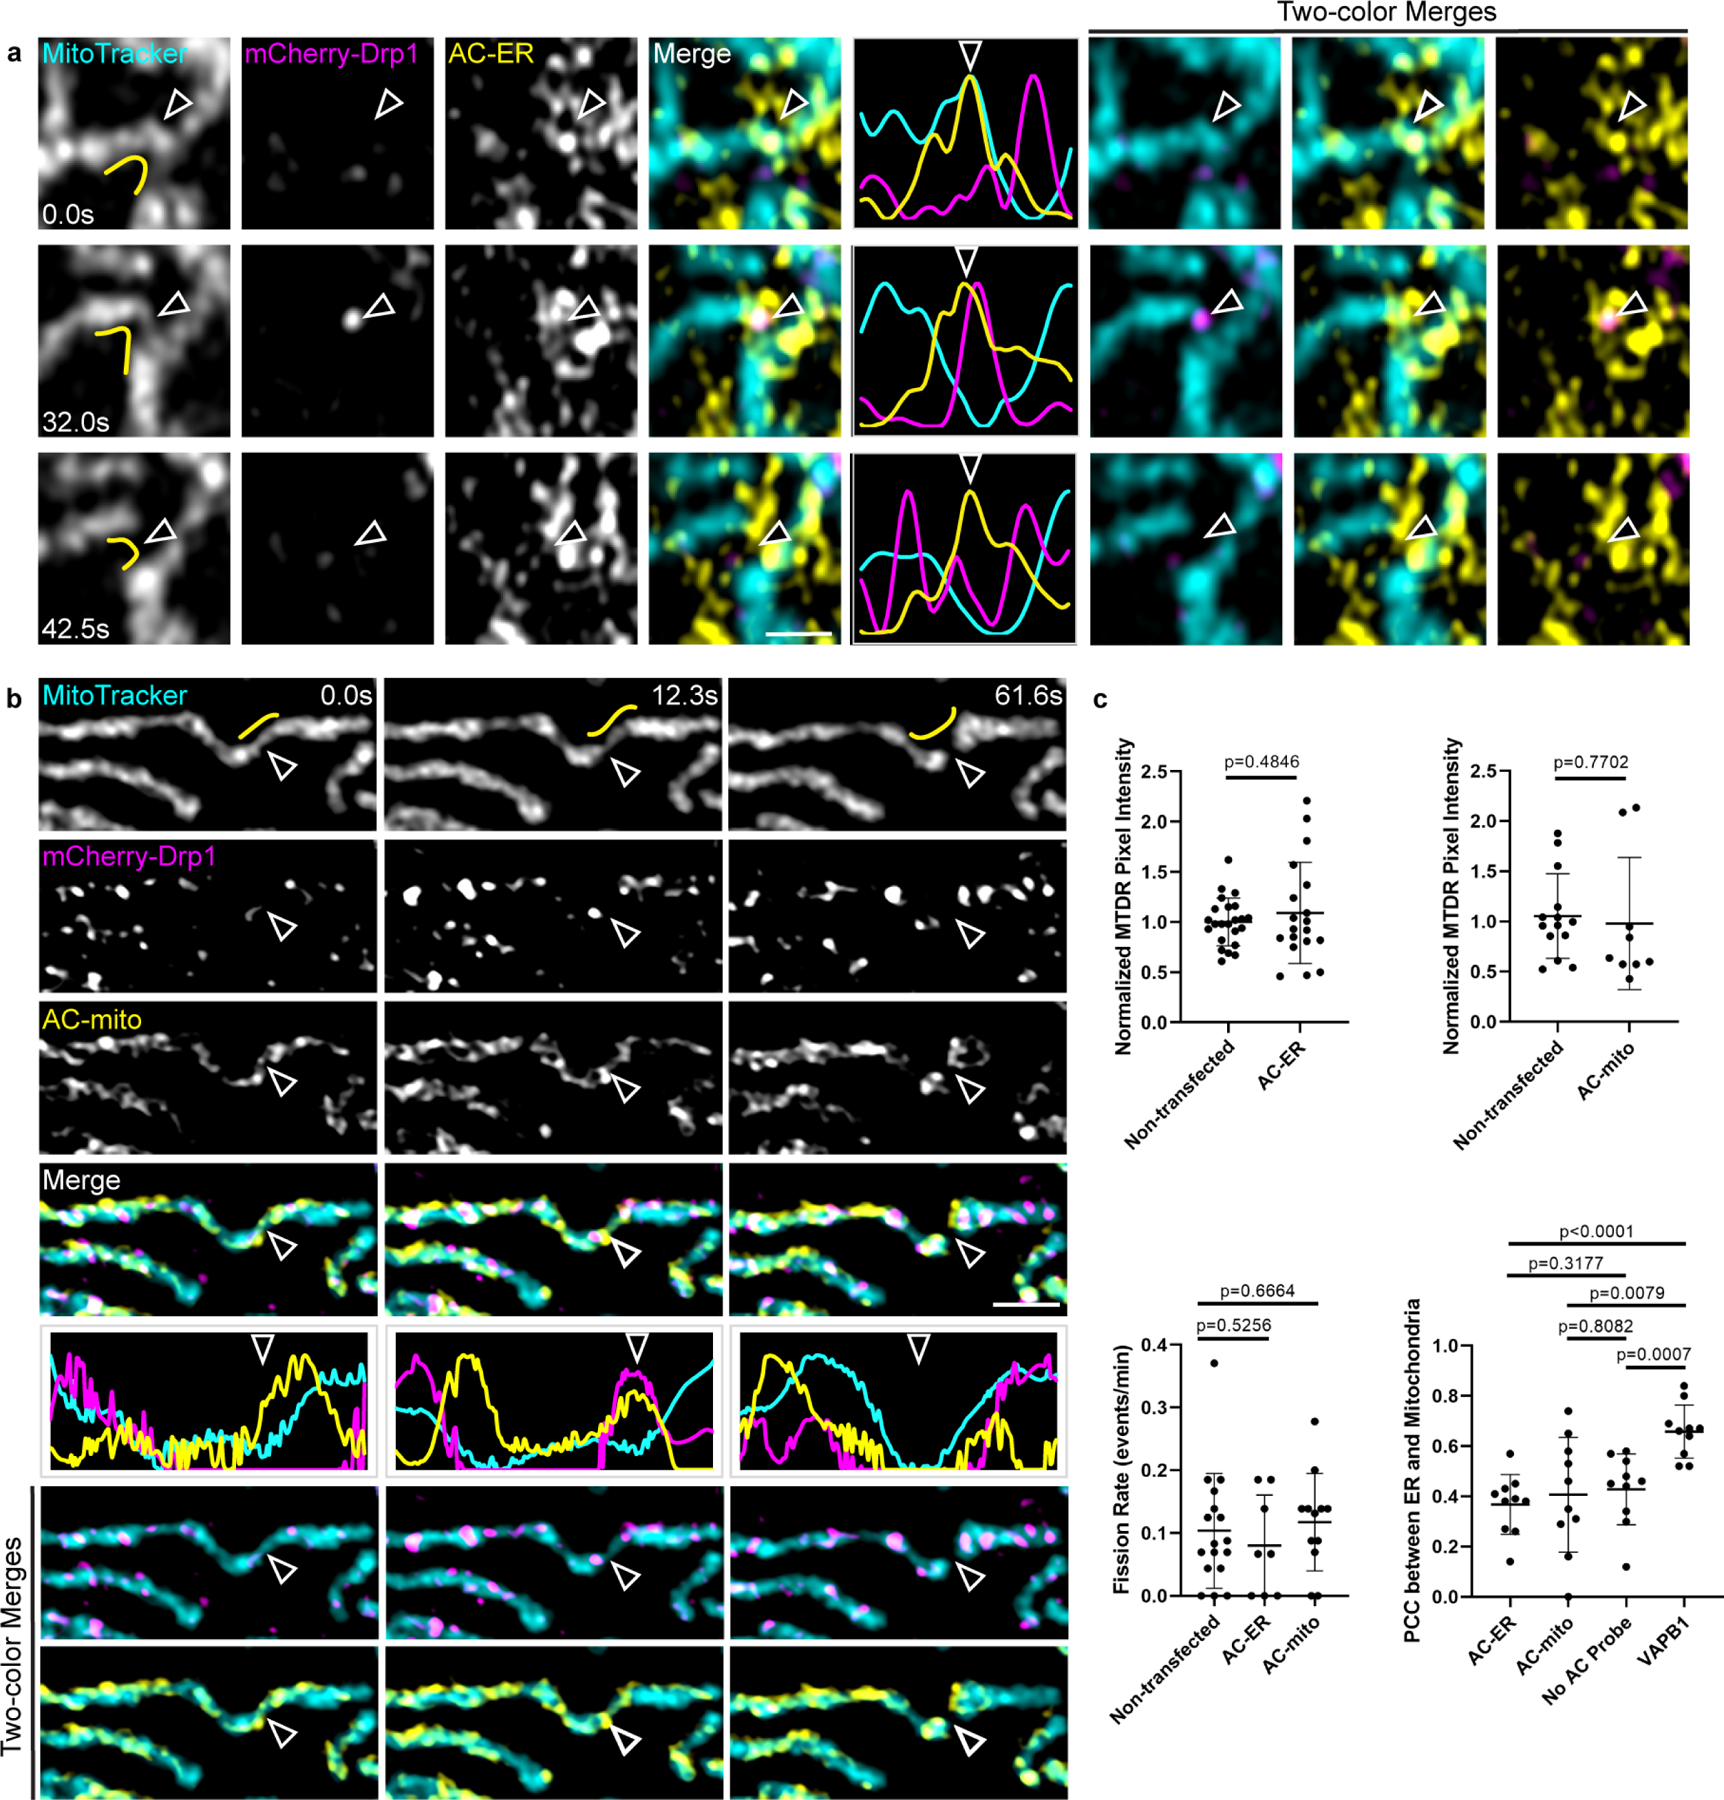
Extended Data Figure 9:
Mitochondria- and ER-associated actin accumulates during Drp1-mediated mitochondrial fission.
A) AC-ER accumulates prior to Drp1-mediated fission. AC-ER accumulation is evident prior to Drp1 recruitment and mitochondrial fission. Hollow arrows mark the location of mitochondrial fission. Yellow...
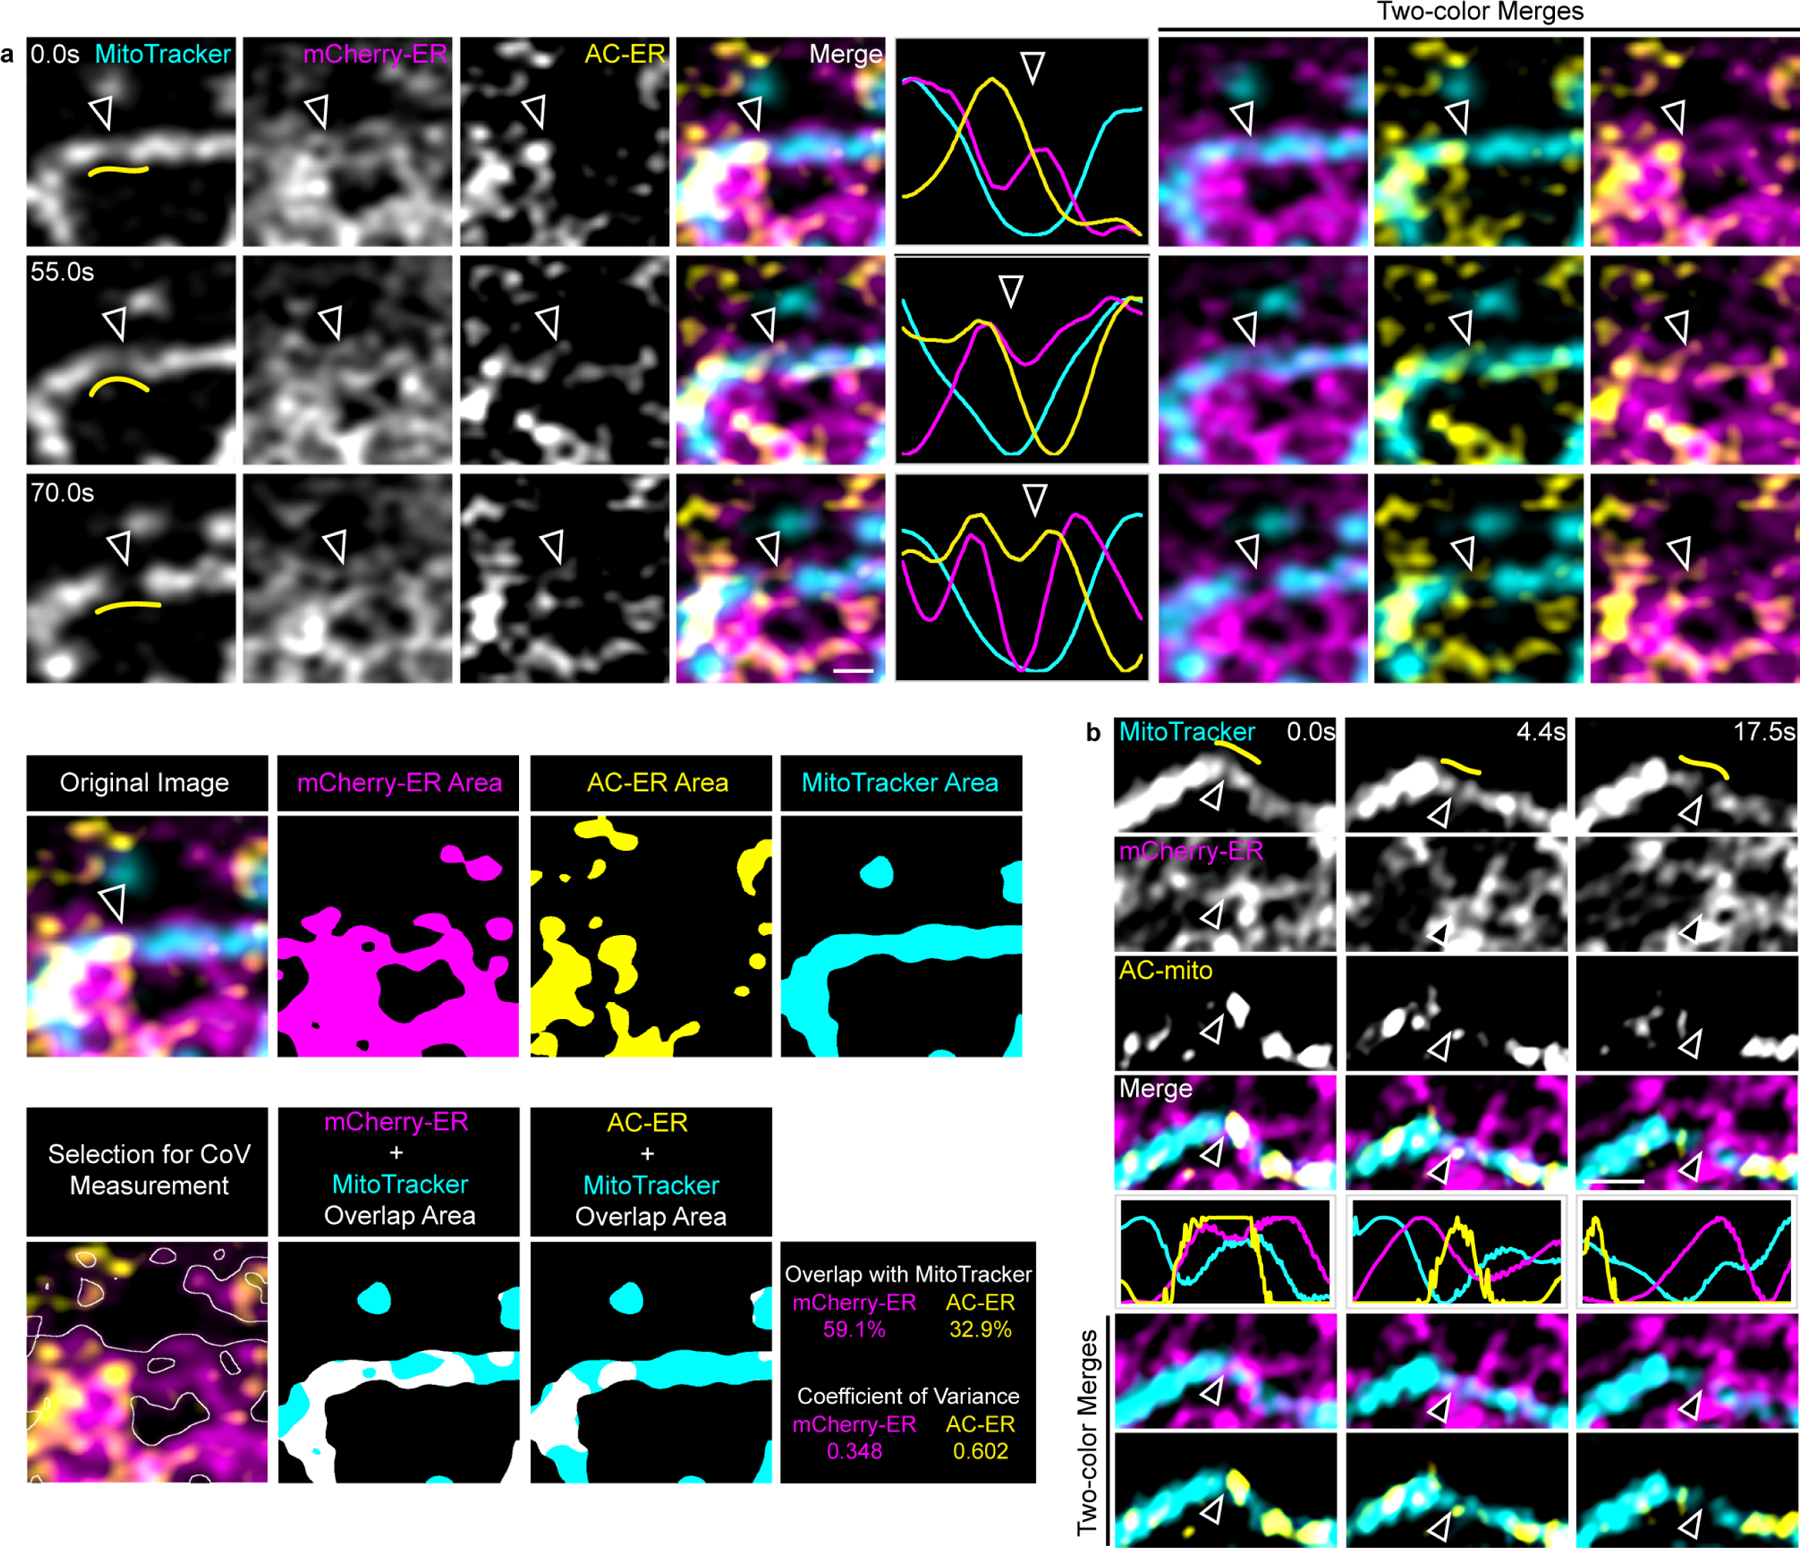
Extended Data Figure 10:
Mitochondria- and ER-associated actin accumulates during ER-mediated mitochondrial fission.
A) AC-ER specifically accumulates at fission sites prior to ER-mediated fission. AC-ER accumulation is evident during ER-mediated mitochondrial fission. Hollow arrows mark the location of mitochondria...
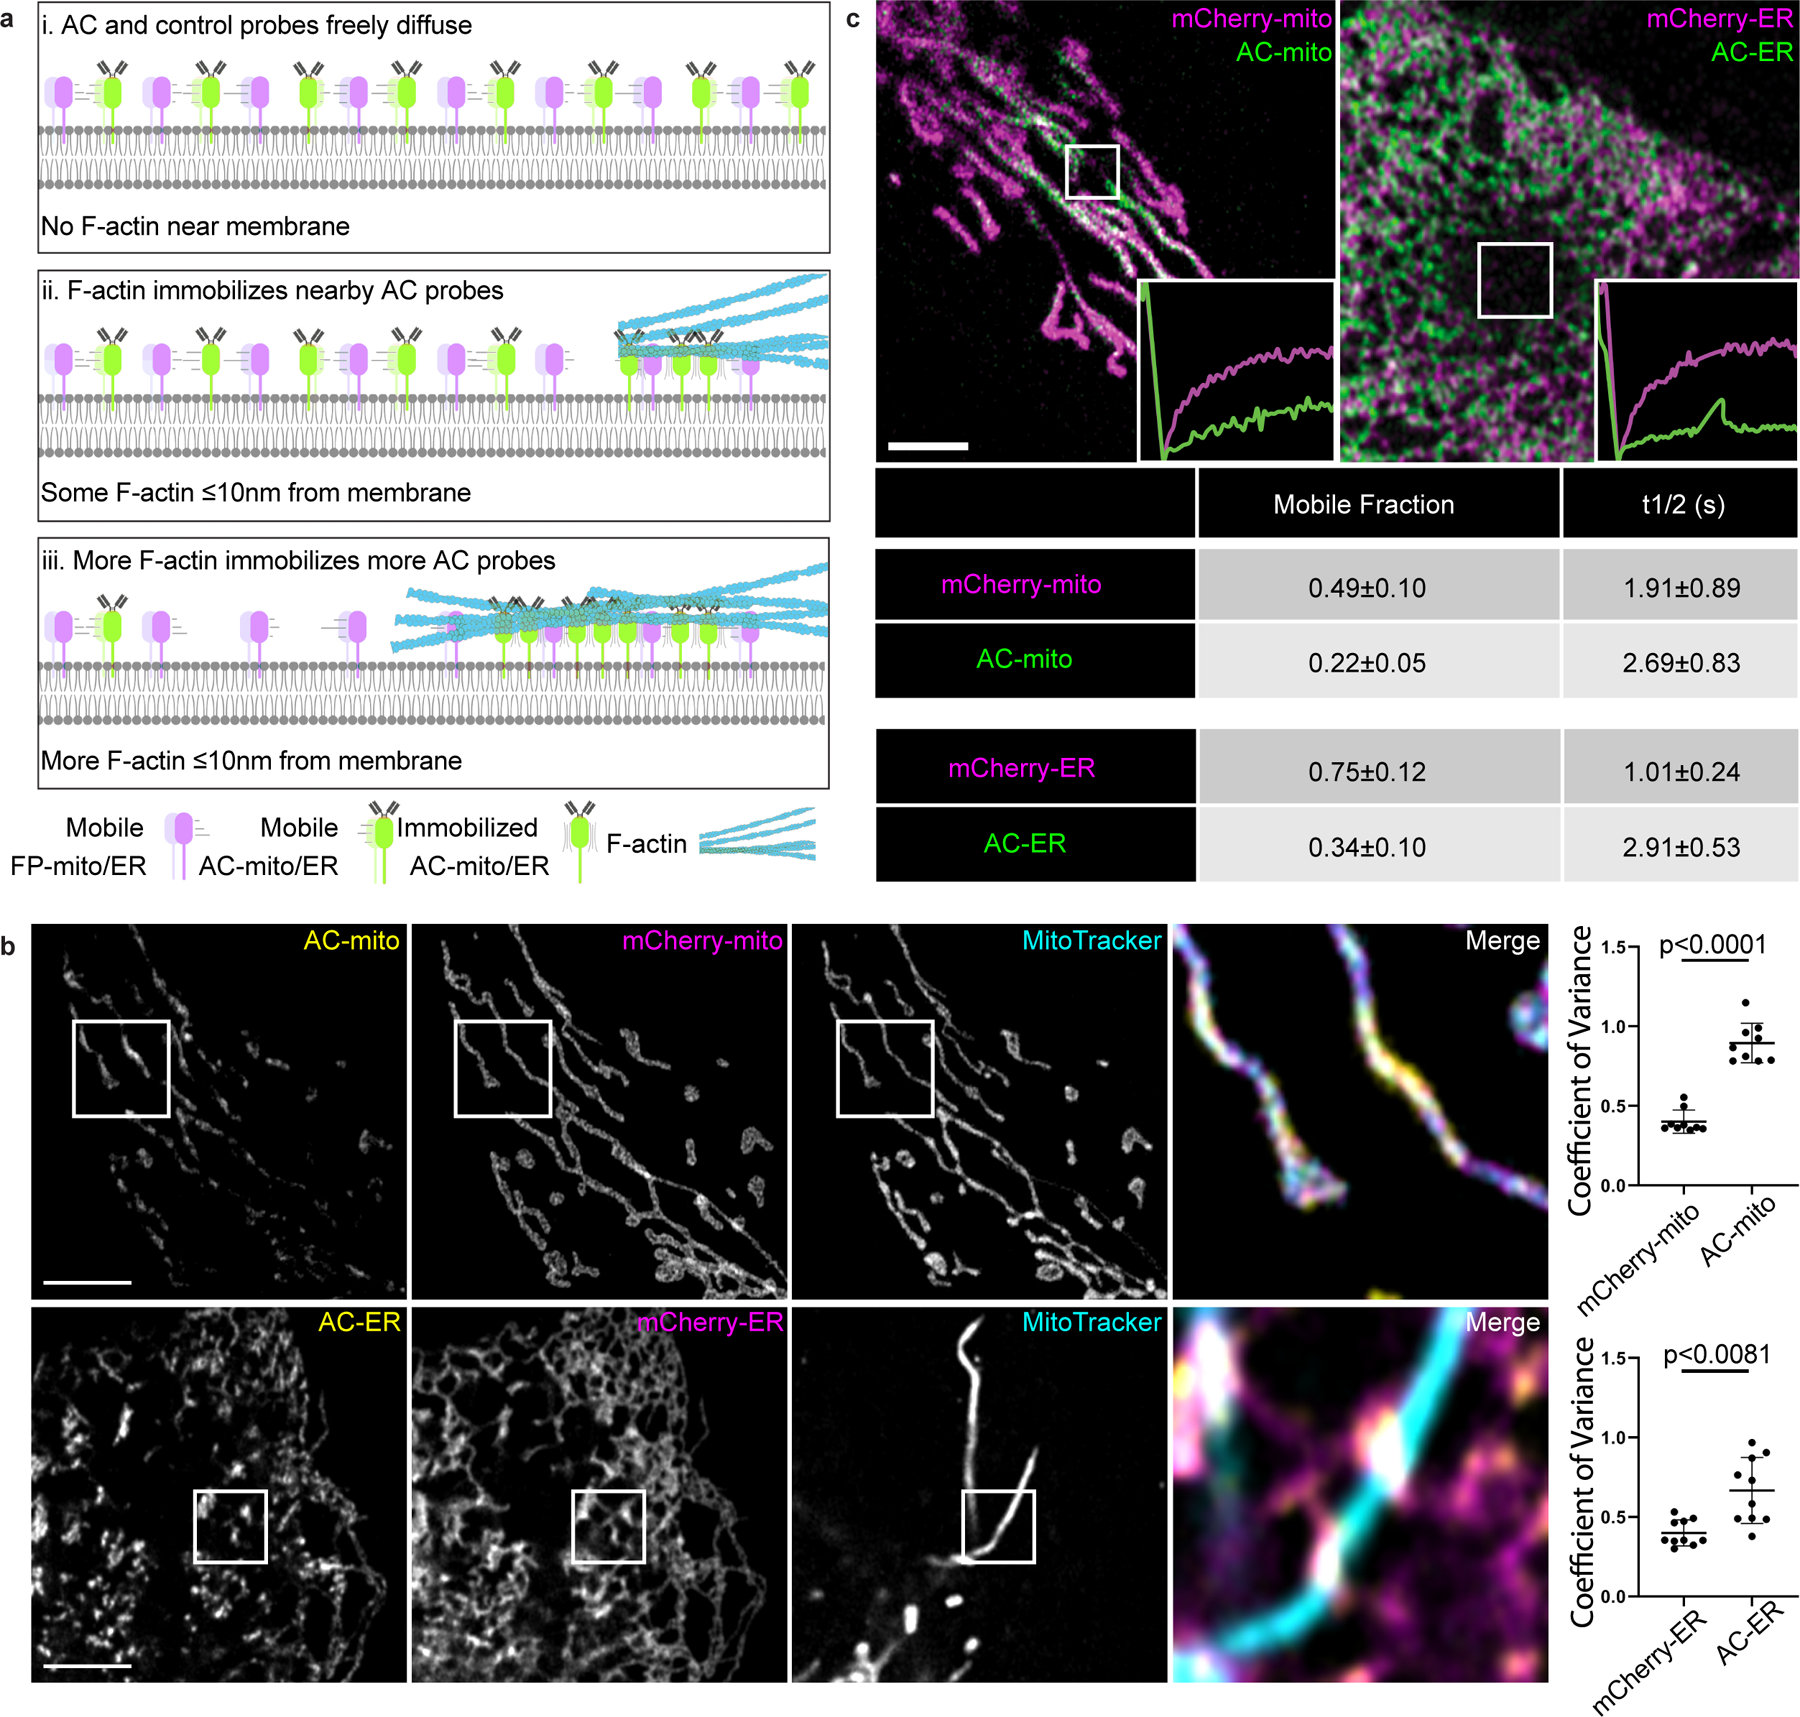
Figure 1:
Mitochondria and ER targeted actin chromobodies reveal sub-organellar F-actin associated domains.
A) Cartoon model of changes in organelle membrane targeted actin chromobody (AC) probe localization in response to the presence of F-actin. When there is no F-actin near the membrane, AC probes freely...
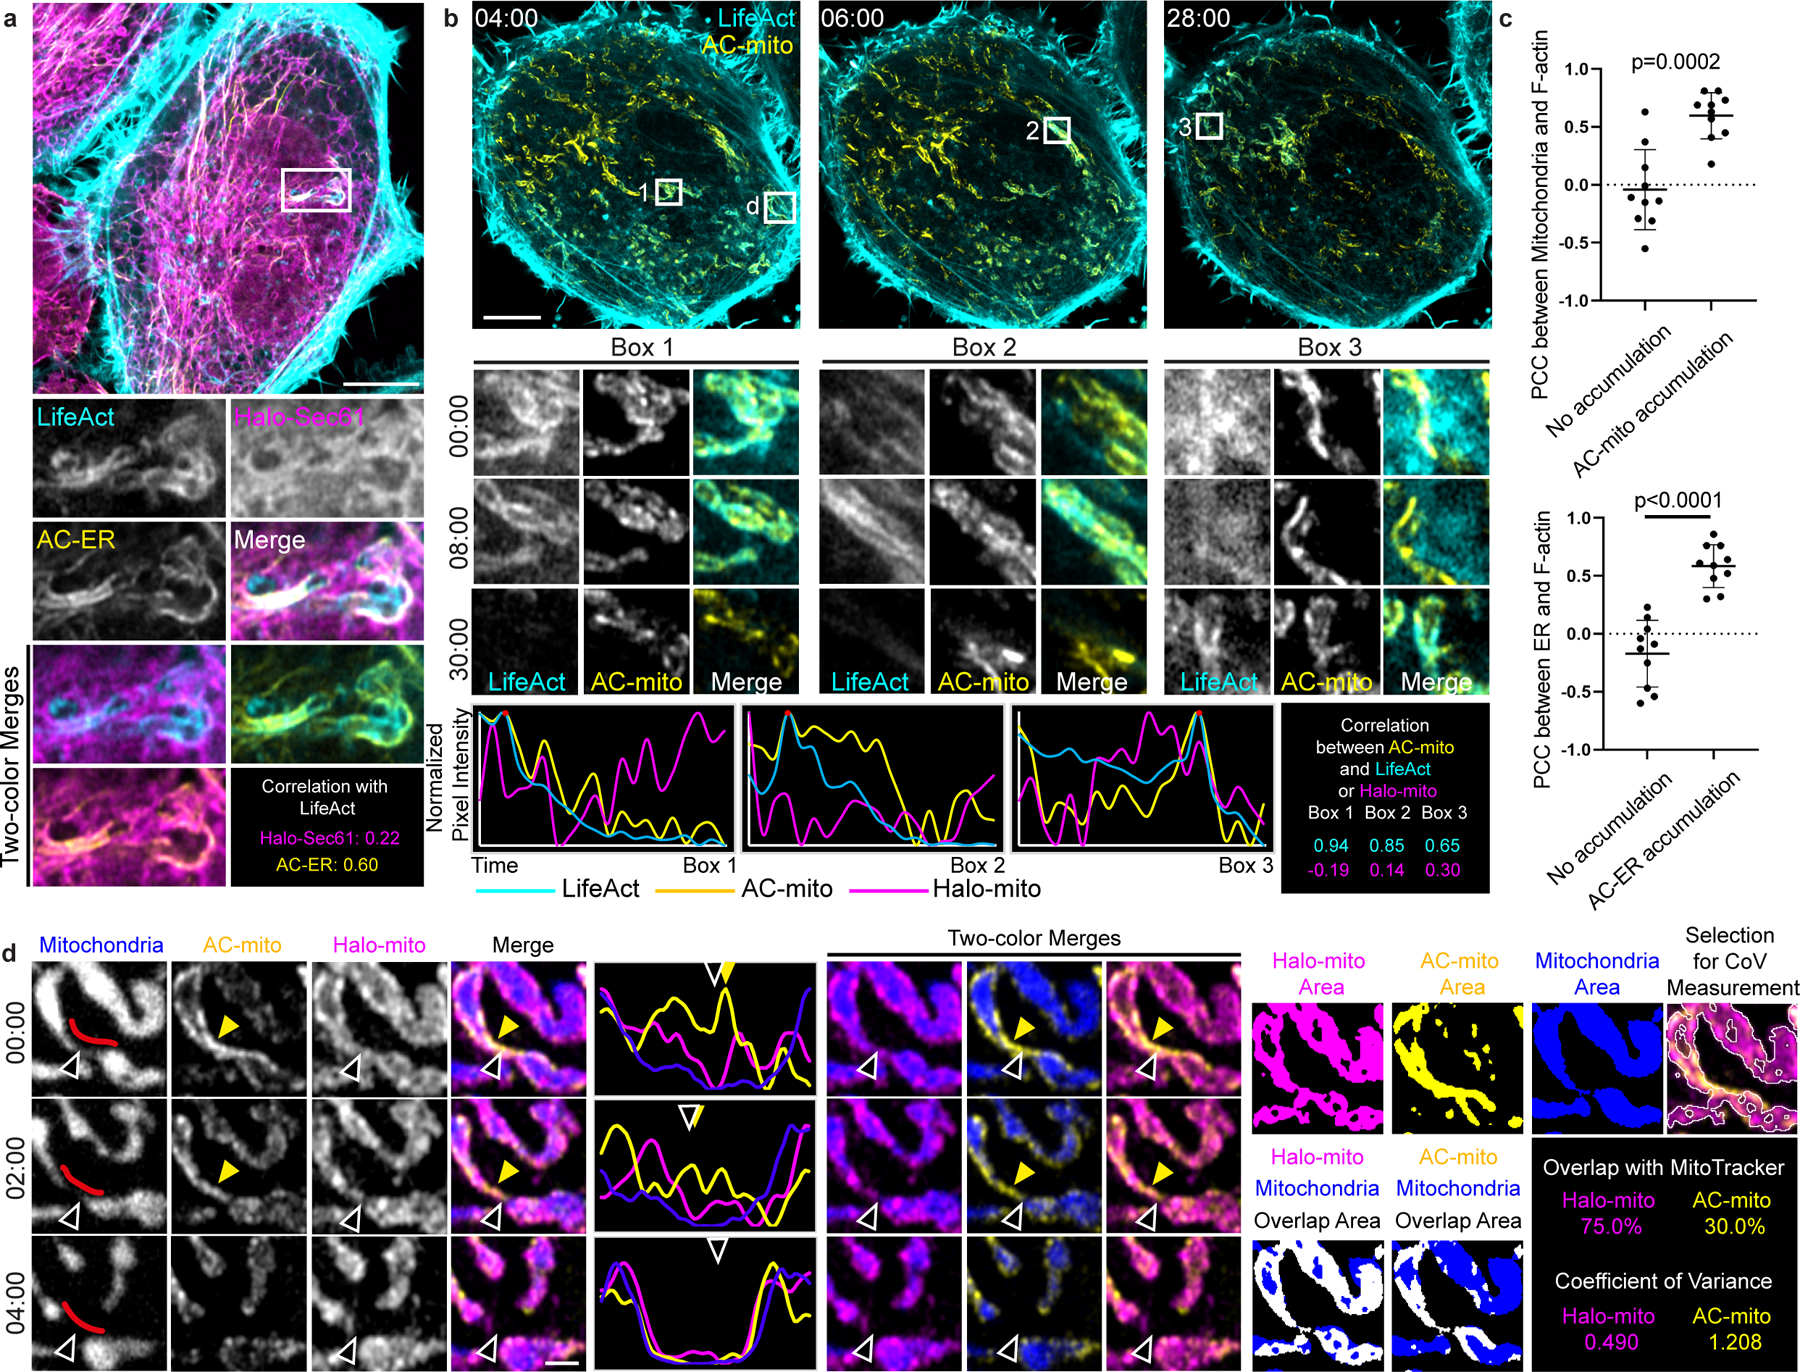
Figure 2:
AC-mito and AC-ER dynamically label mito- and ER-associated actin.
A) AC-ER co-accumulates with actin. HeLa cell co-expressing LifeAct, AC-ER, and Halo-ER control probe is pictured with an area of actin and AC-ER co-accumulation shown in the high magnification images...
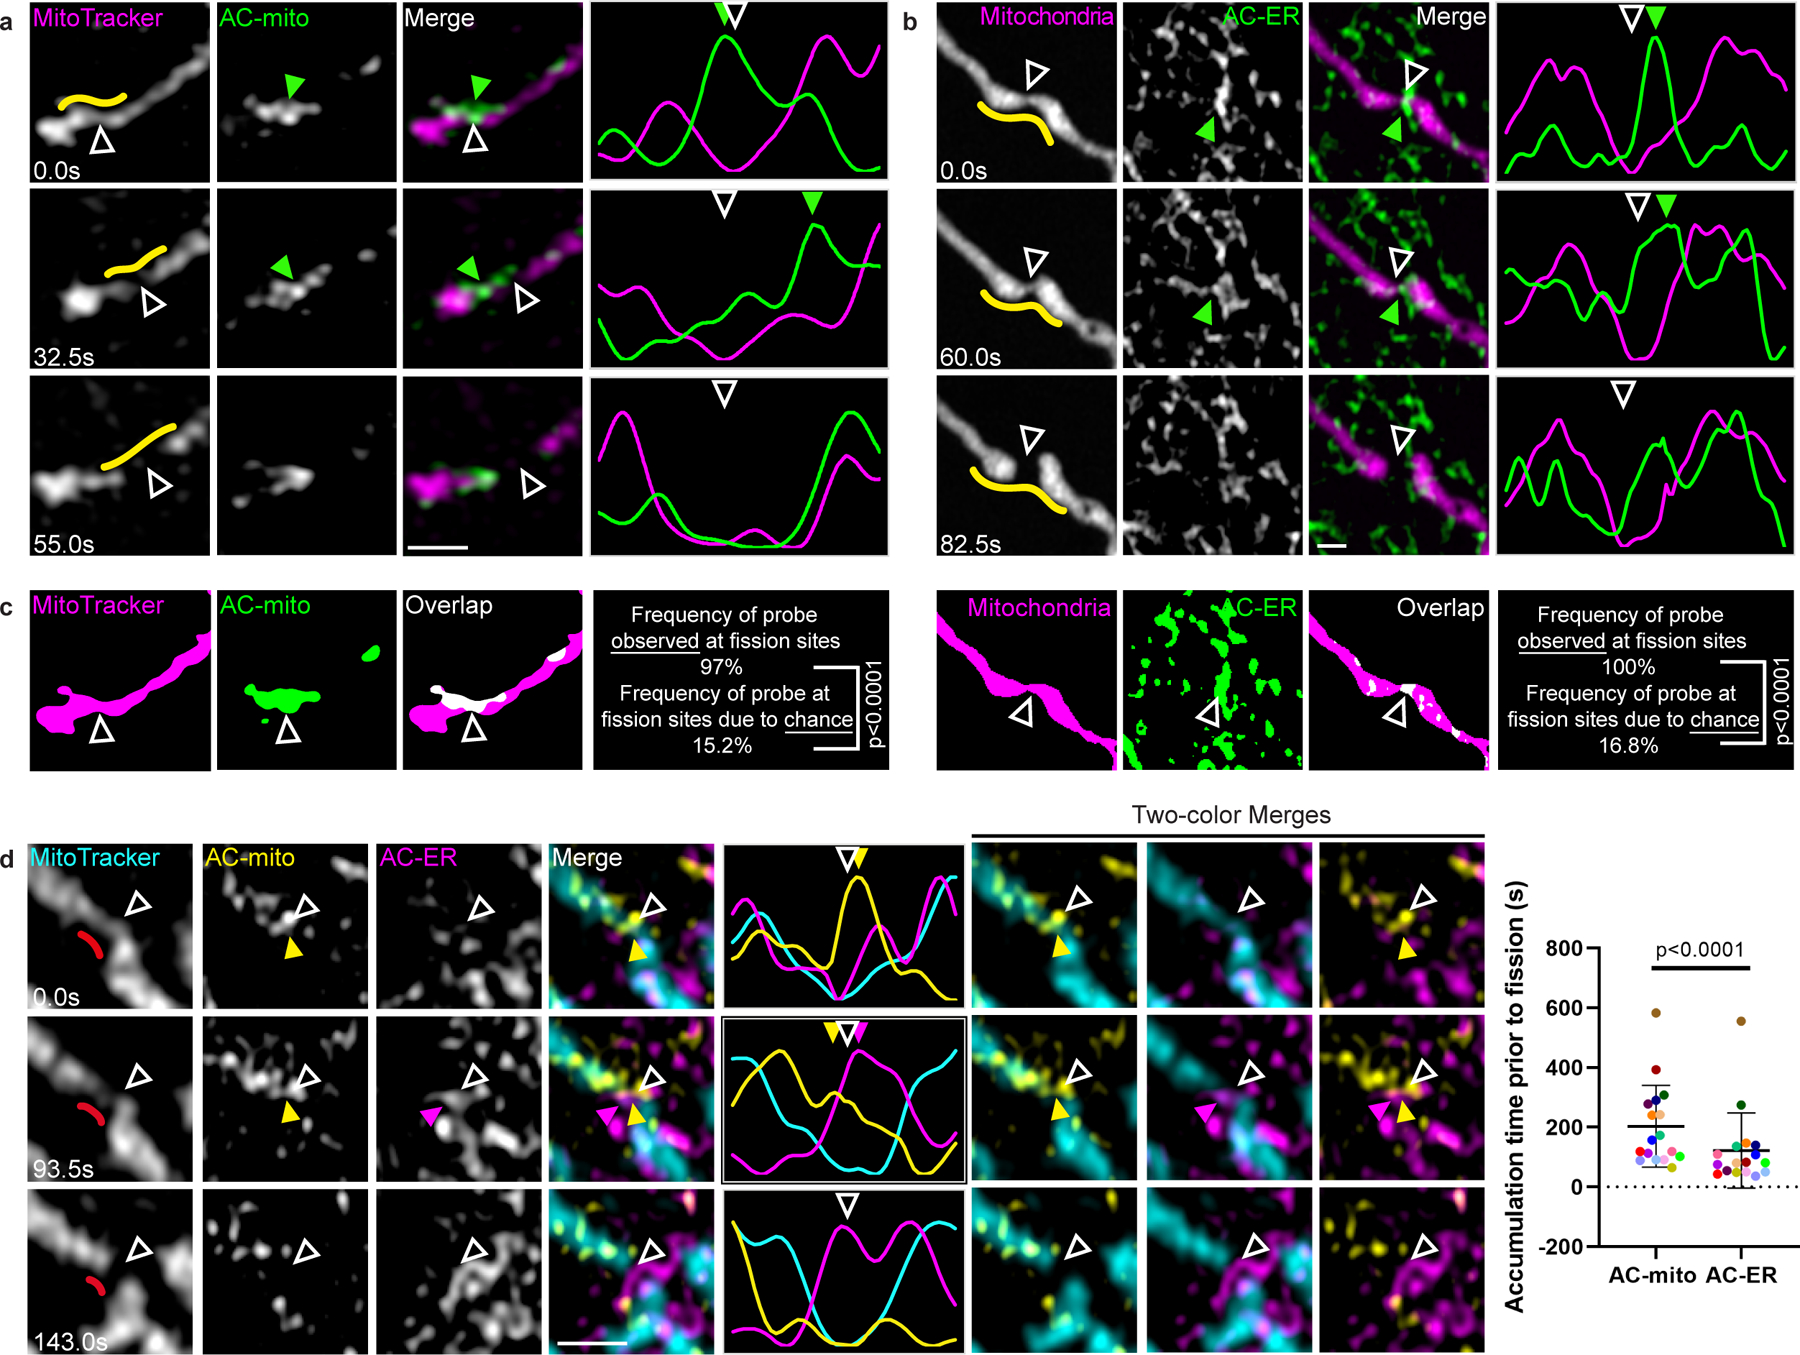
Figure 3:
Mitochondria- and ER-associated actin accumulates prior to mitochondrial fission.
A) AC-mito accumulates at mitochondrial fission sites. AC-mito accumulation is evident prior to mitochondrial fission. Hollow arrows mark the site of mitochondrial fission. Green arrows mark the locat...
Figure images are served from the NIH/NLM PubMed Central Open Access Subset or Europe PMC; copyright remains with the publishers and authors.
💬 Discussion
0 commentsNo comments yet. Be the first to start a discussion!
Leave a Comment