Abstract
Abstract Vesicle fusion is executed via formation of an Ω-shaped structure (Ω-profile), followed by closure (kiss-and-run) or merging of the Ω-profile into the plasma membrane (full fusion). Although Ω-profile closure limits release but recycles vesicles economically, Ω-profile merging facilitates release but couples to classical endocytosis for recycling. Despite its crucial role in determining exocytosis/endocytosis modes, how Ω-profile merging is mediated is poorly understood in endocrine cells and neurons containing small ∼30–300 nm vesicles. Here, using confocal and super-resolution STED imaging, force measurements, pharmacology and gene knockout, we show that dynamic assembly of filamentous actin, involving ATP hydrolysis, N-WASP and formin, mediates Ω-profile merging by providing sufficient plasma membrane tension to shrink the Ω-profile in neuroendocrine chromaffin cells containing ∼300 nm vesicles. Actin-directed compounds also induce Ω-profile accumulation at lamprey synaptic active zones, suggesting that actin may mediate Ω-profile merging at synapses. These results uncover molecular and biophysical mechanisms underlying Ω-profile merging.
🔬 Techniques
🔭 Microscopes
💻 Software
✨ Fluorophores
🧪 Sample Preparation
🏭 Microscope Brands
🧪 Reagent Suppliers
📷 Detectors
💻 Software Details
💾 Data Repositories
🏛️ Research Organizations (ROR)
Affiliated research institutions:
📋 Methods
Primary bovine chromaffin cell culture
Bovine chromaffin cells were prepared as described previously 11 . Briefly, fresh adrenal glands were obtained from a local slaughterhouse on the day of culture. After excess fat was trimmed off the glands (two were used per culture), glands were then perfused with cold 1 × Lock's buffer containing (in mM): NaCl, 145; KCl, 5.4; Na 2 HPO 4 , 2.2; NaH 2 PO 4 , 0.9; glucose, 5.6; and HEPES, 10 pH 7.3, to remove any residual blood. Each gland was then injected through the portal vein with ∼2 ml of filtered Lock's buffer containing collagenase P (1.5 mg ml −1 , Roche), trypsin inhibitor (0.325 mg ml −1 , Sigma) and BSA (5 mg ml −1 , Sigma), and incubated at 37 ° C for 20 min in a water bath. The glands were then cut open longitudinally, to expose the digested medulla. The medulla were carefully removed, minced in Lock's buffer and filtered through a nylon mesh. The filtrate was centrifuged at 500 r.p.m. for 4–5 min, to obtain the cell pellet. The supernatant was then removed and the pellets resuspended in Lock's buffer. The process was repeated one to two times until the supernatant was clear. Final cell pellet was resuspended in pre-warmed DMEM low glucose medium (Gibco) supplemented with 10% fetal bovine serum (Gibco) and plated onto poly- D -lysine and laminin I-coated 25 mm-diameter glass coverslips (Neuvitro Corp., USA). The plated cells were incubated at 37 ° C, 8% humidified CO 2 and used within 4 days after culturing. In some experiments, cells were transfected with 2 μg of Lifeact-tagGFP2 (Ibidi, Germany) by electroporation using a basic neuron nucleofector kit (Lonza, Program O-005) according to the manufacturer's instruction.
Show full methods section
Primary bovine chromaffin cell culture
Bovine chromaffin cells were prepared as described previously 11 . Briefly, fresh adrenal glands were obtained from a local slaughterhouse on the day of culture. After excess fat was trimmed off the glands (two were used per culture), glands were then perfused with cold 1 × Lock's buffer containing (in mM): NaCl, 145; KCl, 5.4; Na 2 HPO 4 , 2.2; NaH 2 PO 4 , 0.9; glucose, 5.6; and HEPES, 10 pH 7.3, to remove any residual blood. Each gland was then injected through the portal vein with ∼2 ml of filtered Lock's buffer containing collagenase P (1.5 mg ml −1 , Roche), trypsin inhibitor (0.325 mg ml −1 , Sigma) and BSA (5 mg ml −1 , Sigma), and incubated at 37 ° C for 20 min in a water bath. The glands were then cut open longitudinally, to expose the digested medulla. The medulla were carefully removed, minced in Lock's buffer and filtered through a nylon mesh. The filtrate was centrifuged at 500 r.p.m. for 4–5 min, to obtain the cell pellet. The supernatant was then removed and the pellets resuspended in Lock's buffer. The process was repeated one to two times until the supernatant was clear. Final cell pellet was resuspended in pre-warmed DMEM low glucose medium (Gibco) supplemented with 10% fetal bovine serum (Gibco) and plated onto poly- D -lysine and laminin I-coated 25 mm-diameter glass coverslips (Neuvitro Corp., USA). The plated cells were incubated at 37 ° C, 8% humidified CO 2 and used within 4 days after culturing. In some experiments, cells were transfected with 2 μg of Lifeact-tagGFP2 (Ibidi, Germany) by electroporation using a basic neuron nucleofector kit (Lonza, Program O-005) according to the manufacturer's instruction.
Electrophysiology
Whole-cell voltage-clamp and capacitance recordings were performed with an EPC-10 amplifier together with the lock-in software (PULSE, HEKA, Lambrecht, Germany) 56 . All experiments were carried out at room temperature (21 °C −24 °C) with the cells immersed in bathing solution containing (in mM): 125 NaCl, 10 glucose, 10 HEPES, 5 CaCl 2 , 1 MgCl 2 , 4.5 KCl, 0.001 tetrodotoxin and 20 tetraethylammonium ion, pH 7.3. The osmolarity of the bath solution was 305–310 mOsm. In some experiments, we increased the osmolarity to 640–650 mOsm by adding 295 mM sucrose to the bath solution. In some experiments, we decreased the osmolarity to 160–221 mOsm by reducing NaCl to 55–70 mM. The pipette (3–6 MΩ) solution contained (in mM): 130 glutamate, 0.5 EGTA, 12 NaCl, 30 HEPES, 1 MgCl 2 , 2 ATP and 0.5 GTP pH 7.2 adjusted with CsOH. The osmolarity was ∼308 mOsm. In some experiments, ATP (2 mM) in the pipette solution was replaced with a non-hydrolysable ATPγS (2 mM, Sigma) and MgCl 2 was raised to 3 mM to facilitate endogenous ATP turnover 57 . For intracellular Ca 2+ dialysis experiments, the pipette solution contained (in mM): 110 glutamate, 10 EGTA, 12 NaCl, 30 HEPES, 1 MgCl 2 , 2 ATP 0.5 GTP and 9 CaCl 2 pH 7.2 adjusted with CsOH. The free Ca 2+ concentration was ∼1.5 μM, which was calculated based on the Max-Chelator programme (Stanford University, Stanford, CA), in which the calcium dissociation constant of EGTA is 0.15 μM 58 59 . The holding potential was −80 mV. For Train 2Hz stimulation, a Train of 50 ms depolarization from −80 to +10 mV was given at 2 Hz; each 50 ms depolarization was preceded by a 50 ms pre-pulse from −80 to +120 mV, to facilitate Ca 2+ channel current 60 61 62 . Cell membrane capacitance was simultaneously recorded 15 s before, during and 30 s after depolarization. The sample interval for current recordings was 50 μs. The frequency of the sinusoidal stimulus was 1,000–1,500 Hz with a peak-to-peak voltage ≤50 mV. Confocal imaging Alexa 647 (A647; 20–30 μM in bathing solution, Invitrogen) and Alexa 488 dyes (A488; 20–30 μM in bathing solution, Invitrogen) were excited by a solid-state 638 nm (30 mW output) and 488 nm lasers (20 mW output) with an inverted confocal microscope (TCS SP8, Leica, Germany; original magnification, × 63/1.40 oil objective). Unless mentioned otherwise, the 638 nm laser was set at 20–25% of the maximum power and the 488 nm laser was set at 0.5–2% of the maximum power. A647 fluorescence was collected with a photomultiplier at 639–767 nm, whereas A488 was collected with a hybrid GaAsP spectral detector at 489–596 nm. For time-lapse A647/A488 imaging, images were collected with 40 ms inter-frame interval at 45–70 nm per pixel in an imaging area of ∼160–320 μm 2 . In some experiments, cells were pre-treated with 3 μM latrunculin A (Enzo Life Sciences), 4 μM Cyto D (Enzo Life Sciences), wiskostatin (10 μM, Tocris Bioscience) and SMIFH2 (25 μM, Tocris Bioscience) for 20 min in the bath solution, or whole-cell dialysis of phalloidin–FITC (1.3 μM, Invitrogen) for 2–3 min before imaging.
STED imaging
The inverted STED microscopes used in this study (TCS SP5 STED, TCS SP8 STED 3X, Leica) have a resolution of ∼60–90 nm. A488 (60 μM) was excited with an Argon laser at 488 nm at 20% of the maximum power (maximum power: 25 mW) and depleted with a continuous wave fibre laser at 592 nm using the maximum power (1.5 W). The fluorescence was acquired by GaAsP hybrid detection system at 498–580 nm. At 20% of the maximum power, 488 nm laser caused A488 bleaching after pore closure with a time course similar to that of A647 under the confocal setting 11 . Lifeact (TagGFP2) was excited by a tunable white light laser at 470 nm (7% of maximum power) with the STED depletion laser at 592 nm (25% of the maximum power) and its fluorescence at 480–560 nm was collected using time-gated detection (1.5–6.5 ns). mCherry was excited by the tunable white light laser at 570 nm (6% of maximum power) with the STED depletion laser at 660 nm (60% of the maximum power) and its fluorescence between 575 and 650 nm was collected using time-gated detection (0.5–6.5 ns). PH–mPapaya was excited by the tunable white light laser at 530 nm (14% of the maximum power) with the STED depletion laser at 660 nm (10% of the maximum power) and its fluorescence between 541 and 620 nm was collected using time-gated detection (1.5–6.5 ns). When NPY–mCherry or PH–mPapaya and Lifeact (TagGFP2) were imaged at the STED microscope, NPY–mCherry (or PH–mPapaya) was imaged first, to avoid bleaching of mCherry or mPapaya fluorescence by the 592 nm STED depletion laser. For XZ scanning, we used 70–80% of STED depletion laser power in the Z -direction to improve the z axis resolution.
Image analysis A647 or A488 spots
(Ω-profiles filled with A647 or A488) were identified during and
📊 Figures
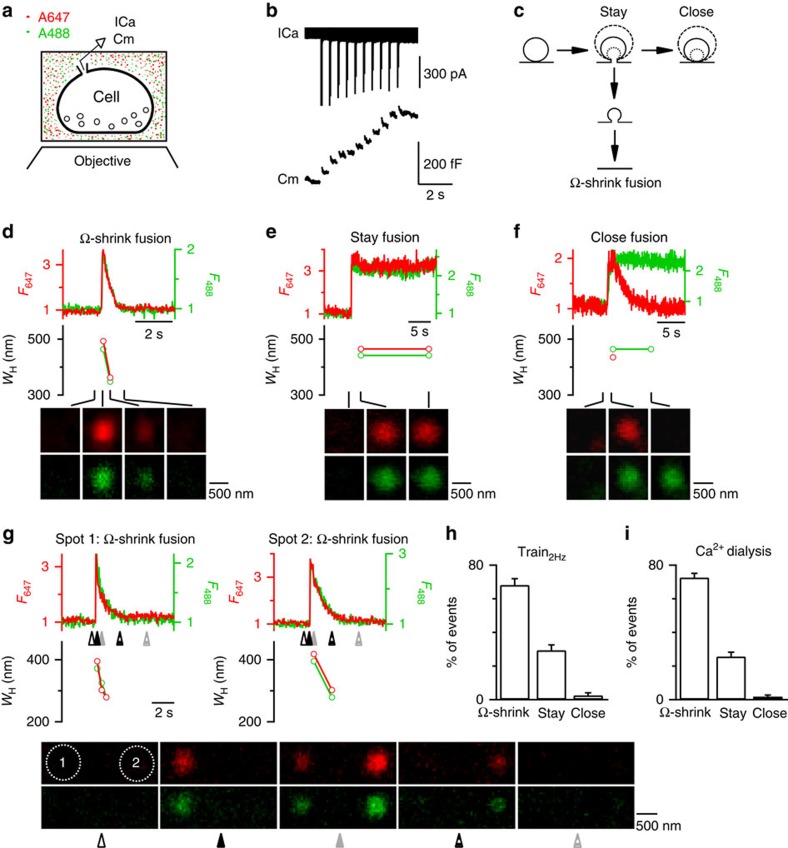
Figure 1
Train 2Hz induces three fusion forms with u03a9-shrink as the dominant form in control chromaffin cells.
( a ) Schematic drawing of a cell on the coverslip bathed with a solution containing A647 (red) and A488 (green). ICa and membrane capacitance (Cm) are whole-cell recorded and the cell bottom is image...
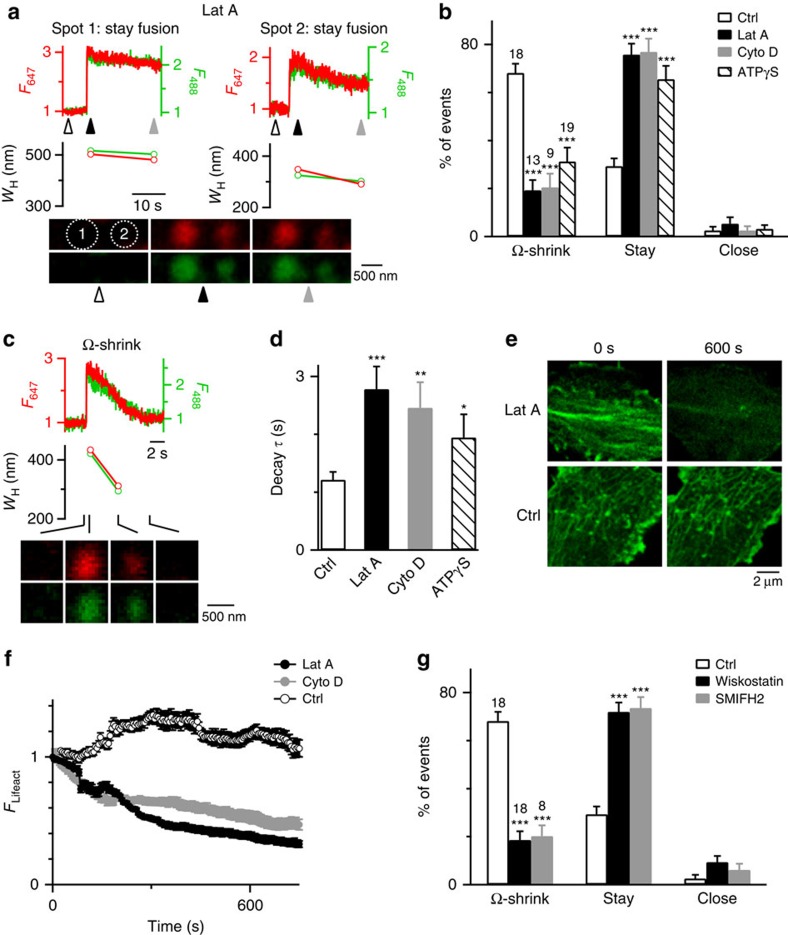
Figure 2
Block of F-actin inhibits u03a9-shrink fusion but promotes stay fusion.
( a ) An example showing more spots (two neighbouring spots, 1 and 2) undergoing stay fusion during Train 2Hz in the presence of Lat A (3u2009u03bcM, bath). Sampled confocal images were taken at times...
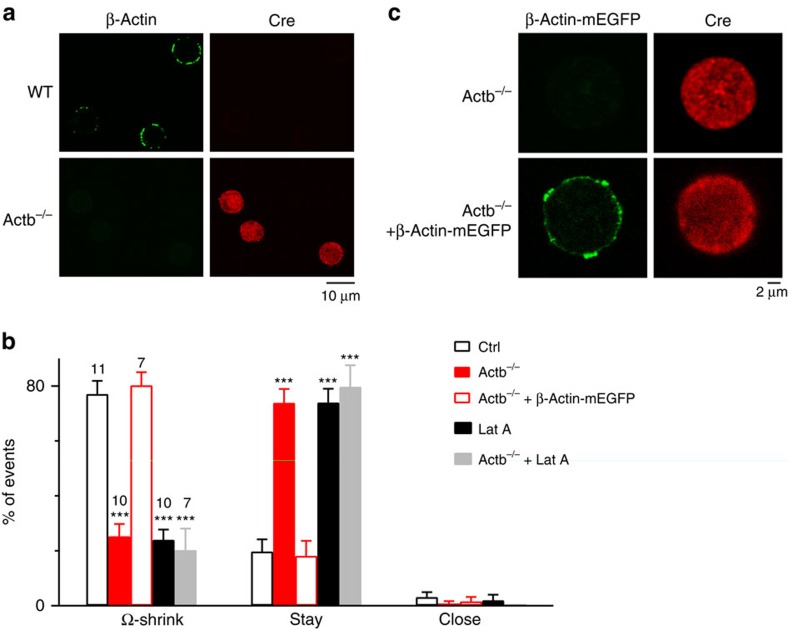
Figure 3
u03b2-Actin KO inhibits u03a9-shrink fusion but promotes stay fusion.
( a ) Immunostaining of u03b2-actin in WT and Actb u2212/u2212 mouse chromaffin cells; Cre antibody staining was also shown to indicate cells expressed with Cre for deletion of Actb1 gene. ( b ) Perce...
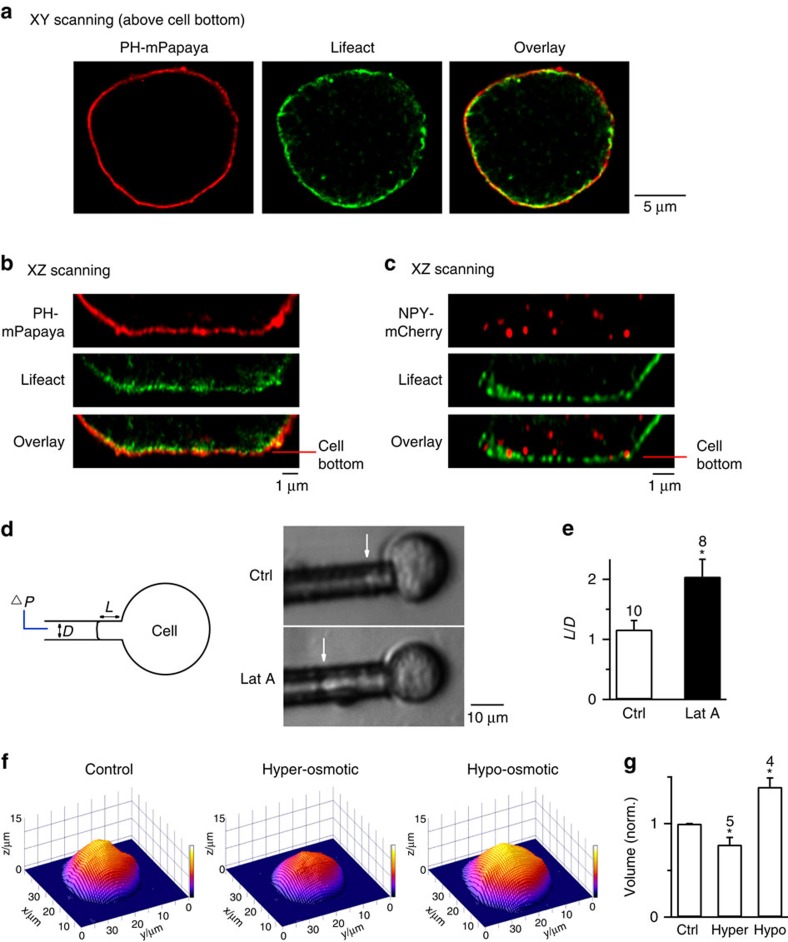
Figure 4
Localization of F-actin and manipulation of membrane tension by Lat A and by changes of osmolarity.
( a ) Sampled STED images of a cell overexpressed with PHu2013mPapaya (left, red, labelling the plasma membrane) and Lifeact-TagGFP2 (middle, green) at the conventional XY scanning mode with a focal p...
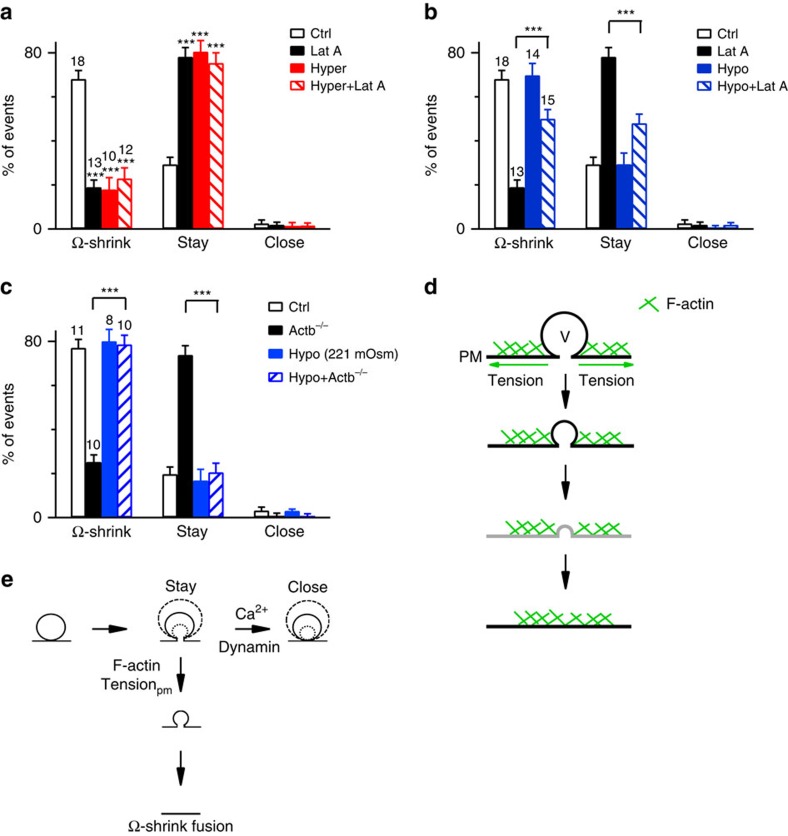
Figure 5
Actin provides sufficient Tension pm to mediate u03a9-profile shrinking.
( a ) Percentages (mean+s.e.m.) of u03a9-shrink, stay and close fusion induced by Train 2Hz in Ctrl (305u2009mOsm, n =18 cells; 192 spots in total), in the presence of Lat A (3u2009u03bcM, 305u2009mOs...
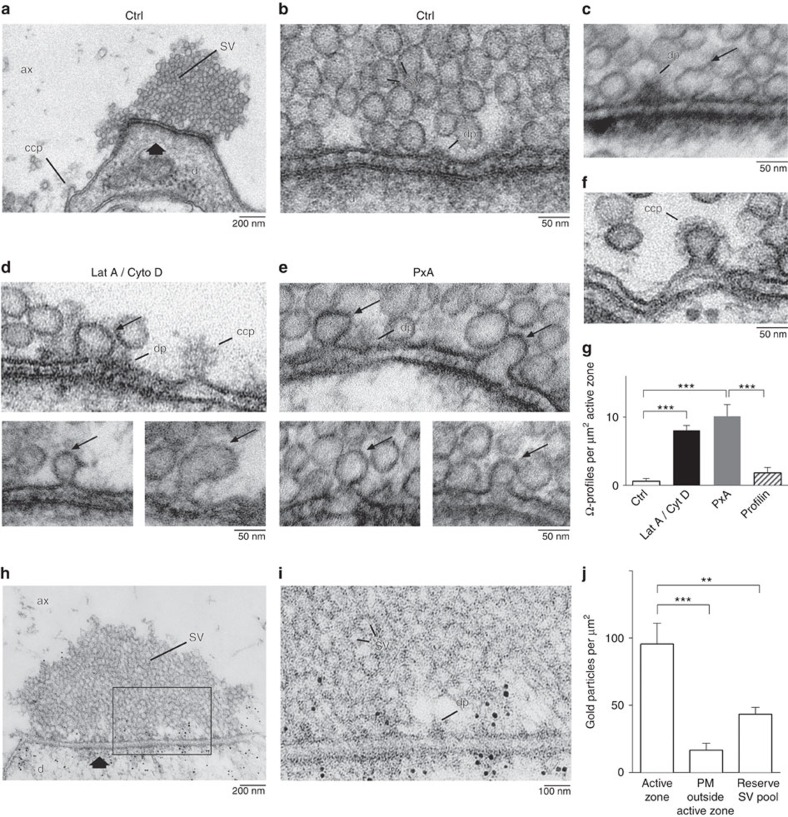
Figure 6
Actin-directed compounds induce u03a9-profiles at lamprey active zones.
( a ) Electron micrograph of an active zone with a vesicle cluster (arrow) in a control reticulospinal synapse. The axon was stimulated at 5u2009Hz for 30u2009min. A clathrin-coated pit (ccp) is prese...
Figure images are served from the NIH/NLM PubMed Central Open Access Subset or Europe PMC; copyright remains with the publishers and authors.
💬 Discussion
0 commentsNo comments yet. Be the first to start a discussion!
Leave a Comment