Abstract
Abstract The resolution of super-resolution microscopy based on single molecule localization is in part determined by the accuracy of the localization algorithm. In most published approaches to date this localization is done by fitting an analytical function that approximates the point spread function (PSF) of the microscope. However, particularly for localization in 3D, analytical functions such as a Gaussian, which are computationally inexpensive, may not accurately capture the PSF shape leading to reduced fitting accuracy. On the other hand, analytical functions that can accurately capture the PSF shape, such as those based on pupil functions, can be computationally expensive. Here we investigate the use of cubic splines as an alternative fitting approach. We demonstrate that cubic splines can capture the shape of any PSF with high accuracy and that they can be used for fitting the PSF with only a 2–3x increase in computation time as compared to Gaussian fitting. We provide an open-source software package that measures the PSF of any microscope and uses the measured PSF to perform 3D single molecule localization microscopy analysis with reasonable accuracy and speed.
🔬 Techniques
💻 Software
🧪 Sample Preparation
🏭 Microscope Brands
💻 Software Details
💾 Data Repositories
🏛️ Research Organizations (ROR)
Affiliated research institutions:
📊 Figures
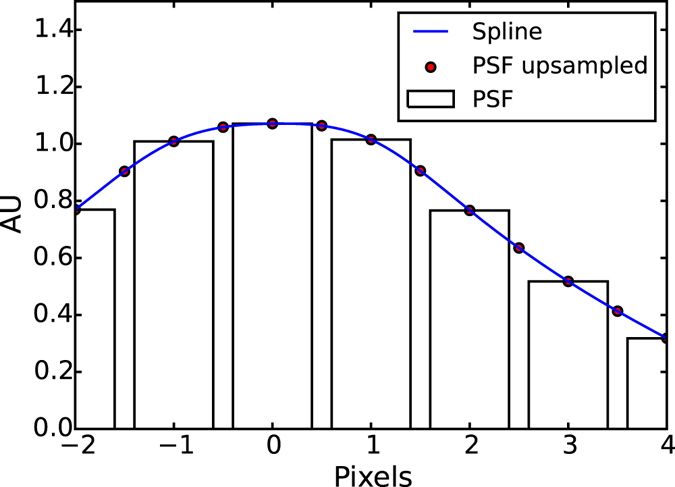
Figure 1
1D Spline example. Each cubic spline interval (the blue line) is determined such that itself and its first derivative are continuous across the red points which are the interval boundaries. The red po...
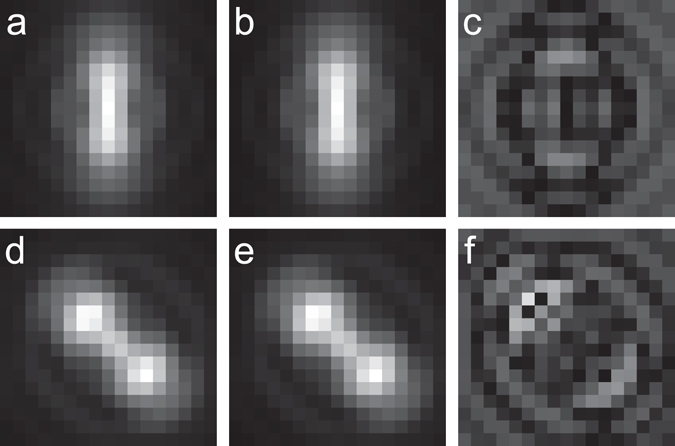
Figure 2
Analytical PSFs and their spline representations for the astigmatic PSF and saddle-point PSF. ( a ) Astigmatic PSF at zu2009=u2009u2212420u2009nm. ( b ) Cubic spline representation of ( a ). ( c ) Dif...
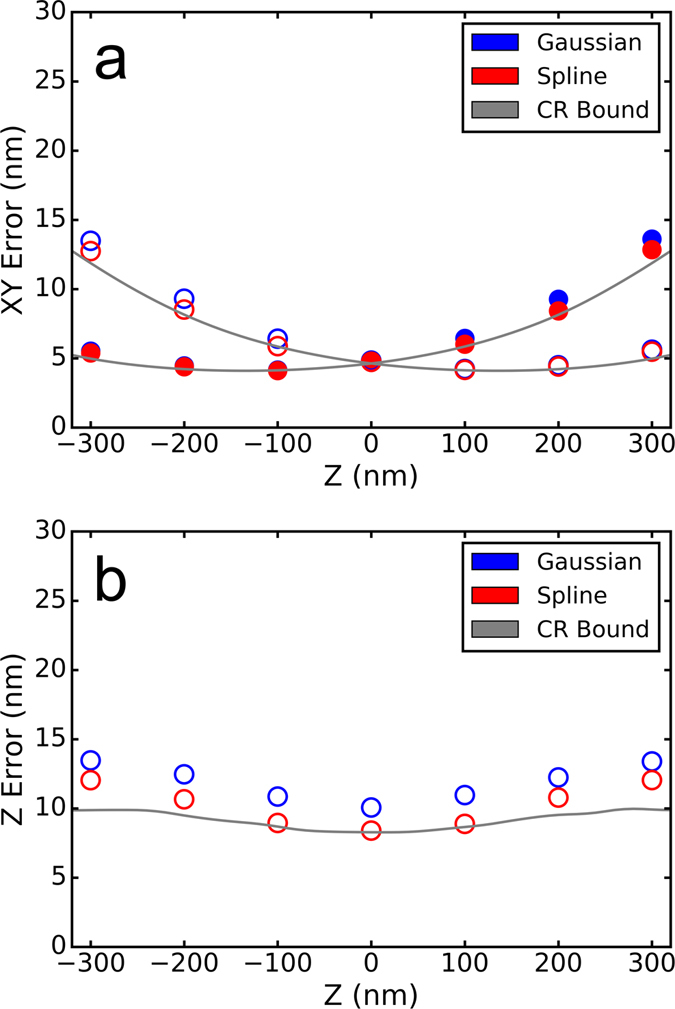
Figure 3
Astigmatic PSF fitting accuracy. ( a ) Average xy fitting error as a function of z for cubic spline versus elliptical Gaussian fitting. Ellipitical Gaussian fitting was performed with the 3D DAOSTORM ...
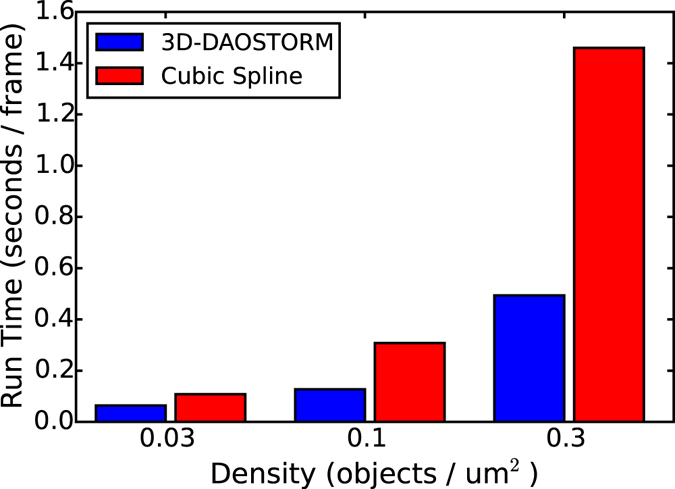
Figure 4
Fitting speed comparison. A comparison of the time it takes to analyze a single frame (256u2009u00d7u2009256 pixels) of a simulated movie with indicated emitter densities using 3D-DAOSTORM or the cubi...
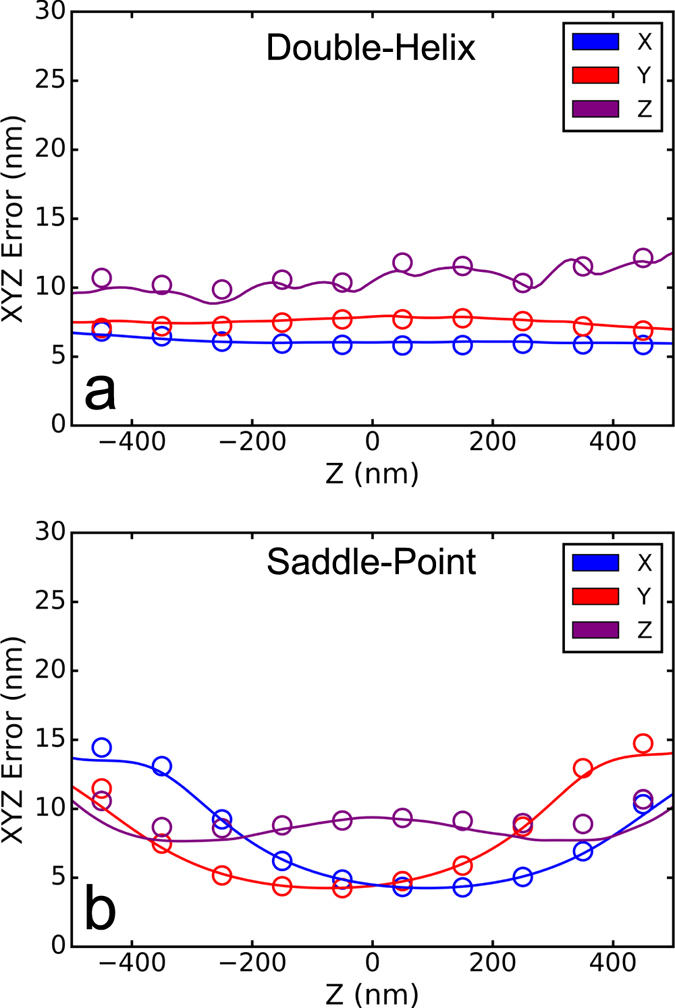
Figure 5
PSF localization accuracy. Localization errors in x, y and z are plotted as a function of z. ( a ) Double helix PSF. ( b ) Saddle-point PSF. The solid lines are the Cramer-Rao theoretical bounds calcu...
Figure images are served from the NIH/NLM PubMed Central Open Access Subset or Europe PMC; copyright remains with the publishers and authors.
💬 Discussion
0 commentsNo comments yet. Be the first to start a discussion!
Leave a Comment