Abstract
Septins perform diverse functions through the formation of filaments and higher-order structures. However, the exact architecture of septin structures remains unclear. In the budding yeast Saccharomyces cerevisiae, septins form an 'hourglass' at the mother-bud neck before cytokinesis, which is converted into a 'double ring' during cytokinesis. Here, using platinum-replica electron microscopy, we find that the early hourglass consists of septin double filaments oriented along the mother-bud axis. In the late hourglass, these double filaments are connected by periodic circumferential single filaments on the membrane-proximal side and are associated with centrally located, circumferential, myosin-II thick filaments on the membrane-distal side. The double ring consists of exclusively circumferential septin filaments. Live-cell imaging studies indicate that the hourglass-to-double ring transition is accompanied by loss of septin subunits from the hourglass and reorganization of the remaining subunits into the double ring. This work provides an unparalleled view of septin structures within cells and defines their remodelling dynamics during the cell cycle.
🔬 Techniques
🔭 Microscopes
🧬 Organisms
💻 Software
✨ Fluorophores
🧪 Sample Preparation
🏭 Microscope Brands
🧪 Reagent Suppliers
📷 Detectors
🔎 Objectives
💻 Software Details
💾 Data Repositories
🏛️ Research Organizations (ROR)
Affiliated research institutions:
📋 Methods
Yeast strains and culture conditions
All strains used in this study are listed in Supplementary Table 1 . Cells were cultured either in rich media YM-1 32 or synthetic complete (SC) minimal media lacking specific amino acid(s) 33 . New strains were made either by integrating a plasmid carrying a modified gene at a genomic locus or by transferring a deletion or tagged allele of a gene from one strain to another via PCR-amplifying and yeast transformation. Plasmid constructions All primers were purchased from Integrated DNA Technologies. Plasmid YIp211-CDC3-yEPA-GFP is the same as YIp211-CDC3-GFP 23 except that the GFP ORF (open reading frame) was replaced by yEPA-GFP ORF encoding a photo-activatable enhanced green fluorescent protein 34 , in which the codon usage was optimized for budding yeast. Plasmid YIp211-CDC3-yEPA-GFP (integrative, URA3 ) harbors an N-terminally yEPA-GFP-tagged CDC3 under the control of its own promoter. YIp211-CDC3-yEPA-GFP was used for yeast transformation after digestion with Bgl II. The plasmid is integrated at the CDC3 locus on the genome. Plasmid YIp128-CDC3-ymEos3.2 is the same as YIp128-CDC3-GFP 35 except that the GFP ORF was replaced by the ymEos3.2 ORF encoding a monomeric photo-convertible fluorescent protein mEos3.2 36 , in which the codon usage was optimized for budding yeast. Plasmid YIp128-CDC3-ymEos3.2 (integrative, LEU2 ) harbors an N-terminally ymEos3.2-tagged CDC3 under the control of its own promoter. YIp128-CDC3-ymEos3.2 was used for yeast transformation after digestion with Bgl II. The plasmid is integrated at the CDC3 locus on the genome.
Show full methods section
Yeast strains and culture conditions
All strains used in this study are listed in Supplementary Table 1 . Cells were cultured either in rich media YM-1 32 or synthetic complete (SC) minimal media lacking specific amino acid(s) 33 . New strains were made either by integrating a plasmid carrying a modified gene at a genomic locus or by transferring a deletion or tagged allele of a gene from one strain to another via PCR-amplifying and yeast transformation. Plasmid constructions All primers were purchased from Integrated DNA Technologies. Plasmid YIp211-CDC3-yEPA-GFP is the same as YIp211-CDC3-GFP 23 except that the GFP ORF (open reading frame) was replaced by yEPA-GFP ORF encoding a photo-activatable enhanced green fluorescent protein 34 , in which the codon usage was optimized for budding yeast. Plasmid YIp211-CDC3-yEPA-GFP (integrative, URA3 ) harbors an N-terminally yEPA-GFP-tagged CDC3 under the control of its own promoter. YIp211-CDC3-yEPA-GFP was used for yeast transformation after digestion with Bgl II. The plasmid is integrated at the CDC3 locus on the genome. Plasmid YIp128-CDC3-ymEos3.2 is the same as YIp128-CDC3-GFP 35 except that the GFP ORF was replaced by the ymEos3.2 ORF encoding a monomeric photo-convertible fluorescent protein mEos3.2 36 , in which the codon usage was optimized for budding yeast. Plasmid YIp128-CDC3-ymEos3.2 (integrative, LEU2 ) harbors an N-terminally ymEos3.2-tagged CDC3 under the control of its own promoter. YIp128-CDC3-ymEos3.2 was used for yeast transformation after digestion with Bgl II. The plasmid is integrated at the CDC3 locus on the genome.
Cell culture and synchronization
For unsynchronized culture, wild-type (YEF473A) and CDC3-GFP (YEF5995) cells were grown to exponential phase in rich media YM-1 containing 2% dextrose at 24°C. To synchronize cells for early-hourglass analysis, bar1Δ (YEF2497) and bar1Δ CDC3-GFP (YEF7170) cells were grown to exponential phase in SC media lacking leucine (SC-Leu) but containing 2% dextrose at 24°C and then treated with 50 ng/ml of α-factor 20 . The cells were incubated at 24°C for 2 hours until 99% of cells were synchronized in G1 as unbudded cells. Cells were washed three times with SC-Leu media without dextrose to remove pheromone and then resuspended in the same media with dextrose and incubated for another 45 minutes at 24°C. For transition-structure and double-ring analysis, cdc15-2 (DL3034) and cdc15-2 CDC3-GFP (YEF7171) cells were grown in SC media with 2% dextrose and adenine sulfate (80 mg/l) to the exponential phase at 24°C in a large volume (at least 300 ml). An equivalent volume of media pre-warmed to 37°C was added to the culture and cells were put in an air incubator at 37°C for 3 hours. Cells for analysis of the transition structures were processed at this point. Synchrony at the transition stage in cdc15-2 myo1Δ and cdc15-2 shs1Δ mutants was achieved by the same method (YEF7406, YEF7453, YEF7486, YEF7487). For double-ring analysis, cells were additionally incubated in a 24°C water bath for 40 minutes. Synchrony for early hourglass, double ring, and transition stages was assessed in CDC3-GFP strains after spheroplast processing (see below) without the addition of cell wall digesting enzyme (zymolyase) so that stage could be assessed by cell morphology and septin structure. This additionally allowed us to control for any progression through the cell cycle during the spheroplasting protocol. Spheroplasting Cells were spun at 23°C (4,300xg for 5 minutes) and resuspended in 3.5 ml TE buffer (40 mM Tris, 40 mM EDTA, pH 8.0) and 17.5 μl β-mercaptoethanol per gram of cells. Cells were incubated at 30°C for 15 minutes, then spun and washed once with spheroplast buffer (10 mM PIPES, 1 M sorbitol, pH 6.5). Cells were then spun and resuspended in 4 ml of spheroplast buffer per gram of cells. 50 U of zymolyase 100T (Amsbio, Oxfordshire, United Kingdom) was added and the cells were incubated at 30°C for an hour. Spheroplasts were then spun at 4°C and washed with chilled spheroplast buffer three times and finally resuspended at a concentration of 1–2 optical density at a wavelength of 600 nm (OD 600 ) per ml. Unroofing spheroplasts This method is adapted from Rodal et al 2005 19 . Coverslips were coated with high molecular weight poly-lysine (Sigma Aldrich, St Louis, MO) by spotting on 10 μl of 1mg/ml poly-lysine in water and incubating at 23°C for 20 minutes. For correlative light/EM, coverslips that were marked with a gold finder grid were used instead. The excess was aspirated off and the coverslip was spotted with sterile H 2 O. After aspirating off the water, the coverslip was allowed to dry for 30 minutes and was used within an hour. Coated coverslips were placed into 12 well plates and submerged in spheroplast suspension. The plate was spun at 3000 rpm for 5 minutes at 4°C. The following solutions were prepared in four petri dishes: #1 spheroplast buffer, #2 KHMgE buffer (70 mM KCl, 20 mM HEPES, 5 mM MgCl 2 , 3 mM EGTA, pH 7.5), #3 KHMgE buffer, #4 KHMgE buffer. A spheroplast-coated coverslip was gently and quickly dipped into dishes #1 and 2, then placed into #3. This was repeated with another coverslip that was inverted onto the first coverslip in dish #3 such that the spheroplasts were sandwiched in between. Light force was applied to the two coverslips for 5 seconds with forceps with care to avoid sliding between the two coverslips. The coverslips were gently separated again with care to avoid slippage and quickly dipped into dish #4 before being placed in fixative (KHMgE + 2% EM grade glutaraldehyde) in a 12 well plate. Fixed, unroofed spheroplasts were stored up to a month before immunofluorescence or EM processing. EM Sample processing for platinum-replica electron microscopy was performed as previously described 18 . In brief, glutaraldehyde-fixed, unroofed spheroplasts were further sequentially treated with tannic acid and uranyl acetate prior to ethanol dehydration and critical point drying. Dried samples were then rotary-shadowed at 45° angle with approximately 2 nm of platinum and at 90° angle with 3.5–5 nm of carbon. Coated samples were mounted on EM grids for analysis. EM samples were analyzed using a JEM 1011 transmission electron microscope (JEOL USA, Peabody, MA) operated at 100 kV. Images were captured with an ORIUS 832.10W CCD camera (Gatan, Warrendale, PA) and presented in inverted contrast. An Unsharp filter was used to sharpen EM images in the figures. Color labeling of structures of interest was performed using the Hue/Saturation tool in Adobe Photoshop to avoid obscuring structural details. For correlative light and electron microscopy, immunofluorescence was performed on glutaraldehyde-fixed cortices prepared on gold finder grid marked coverslips prior to EM processing. Antibody to Cdc11 (y-415, Santa Cruz Biotechnology, Dallas, TX) and Alexa Fluor 488 anti-rabbit IgG (A-21441, Life Technologies, Carlsbad, CA) were used at 1:100 and 1:500, respectively, diluted in PBS containing 1% BSA. Primary and secondary antibody incubations were both for 1.5 hours. Immunofluorescence imaging was performed with an Eclipse Ti-U microscope (Nikon, Tokyo, Japan) equipped with a Nikon Apo TIRF 100× NA 1.49 objective (Nikon, Tokyo, Japan). The images were acquired using Image-Pro Plus, version 7.0 (Media Cybernetics, Bethesda, MD), with an electron-multiplying charge-coupled device (EMCCD) camera (QuantEM 512SC, Photometrics, Tucson, AZ). The positions of intact rings were recorded with respect to fiducial markers so that they could be found again during EM imaging.
Quantification of EM micrographs
Filament lengths were measured by manual tracing using the segmented line tool in ImageJ. The radii of intact septin rings were determined by tracing around the ring with the segmented line tool and measuring the perimeter of the region. The radius was calculated from this rough circumference using the equation 2πr. The thickness of septin single and double filaments was determined by a 5-pixel line scan orthogonal to the filament(s) and using the Plot Profile function in ImageJ to quantify the gray values along the line. Peaks in the graph corresponded to filaments and the approximate midpoint of each peak along the y-axis ( i.e. the gray value) was used to determine the diameter of the filament. The diameter of the rough myosin filaments was determined by approximately tracing around a straight segment of filament using the polygon tool and adjusting the threshold until the entire filament was filled in. The thresholded area was measured within the traced region and divided by the length of the segment to give the average diameter of the filament.
Live-cell imaging with FRAP
Yeast strain YEF6021 ( CDC3-GFP NUP57-mCherry ) was grown to exponential phase in SC-Leu media containing 2 % dextrose at 23°C. For imaging, 1 ml of the culture was briefly centrifuged in an Eppendorf tube (~ 30 seconds, ~ 5000× g). Cell pellet was resuspended in ~ 50 μl supernatant. Approximately 3 μl of the cell suspension was taken and spotted on a 2% agarose slab containing SC media + 2% dextrose on a glass slide. A coverslip was gently pushed on top of the slab, sealed with nail polish. The slide was then used for live-cell imaging. For FRAP analysis of septin bars in shmooing cells, yeast strain YEF7170 ( bar1Δ CDC3-GFP ) was grown in SC-Leu media containing 2 % dextrose + 50 ng/ml α-factor for 3 hours at 23°C to induce shmoo formation. Cells were then concentrated by centrifugation as described above. Approximately 3 μl of the cell suspension was taken and spotted on a 2% agarose slab containing SC media + 2% dextrose on a glass slide and then processed as above for live-cell imaging. Acquisition was performed at 23°C on a spinning-disk confocal microscope system consisting of the microscope IX71 (Olympus), scanhead CSU10 (Yokogawa Corporation of America), and 100× objective (1.4 NA, Plan S-Apochromat oil immersion; Olympus) using an electron multiplying charge-coupled camera (C9100-13; ImagEM; Hamamatsu Photonics). Lasers for excitation of GFP (488 nm) or mCherry/RFP (561 nm) were housed in a Spectral Applied Research launch. A computer-controlled ablation system (MicroPoint; Photonic Instruments) equipped with a nitrogen-pumped dye laser (435 nm) was used for FRAP. MetaMorph 7.7 software (Molecular Devices) controlled microscope and equipment and was used for image acquisition. Images were taken at 1-minute intervals with a z stack consisting of 12 or 13 × 0.4–μm steps. Exposure time was set to 125 ms (GFP) or 150 ms (RFP), EM Gain to 150 (GFP) or 175 (RFP) and the Digitizer to 11 MHz.
FRAP analysis
Post-acquisition image analysis was performed in ImageJ (National Institutes of Health). An average projection for quantification or maximum projection for presentation was made. When too much cell movement occurred over the time of acquisition, stack-registration was performed (rigid-body method) in ImageJ, using the plugin StackReg 37 . For quantification, a polygon fitting the region of interest (bleached or unbleached area) was drawn and the integrated density was calculated using ImageJ. In GraphPad Prism 5, the integrated density, relative to the starting point (before bleach), was calculated and plotted.
Live-cell imaging with photo-activation and photo-conversion
For live-cell imaging with photo-activation or photo-conversion, cells were cultured in SC-dropout (a specific amino acid or uracil was omitted) media to exponential phase at 23°C. Cells were then embedded in a layer of medium solidified with 1.2% low-melting-temperature agarose (Lonza) in a poly-lysine-coated glass bottom dish (MatTek). Image acquisitions were performed on a microscope (Olympus, IX81) with a spinning-disk confocal scan head (Yokogawa, CSU-X1) and a 100× objective lens (Olympus, 1.4NA) using an EMCCD camera (Andor, iXon3). Image acquisition was controlled by MetaMorph (Molecular Devices). Two diode lasers (488 nm for GFP and 561 nm for RFP) were used for excitation illumination. Excitation laser intensities were set at 15% of the maximal output. For photo-activation and photo-conversion, 405-nm laser was used at the minimum output intensity. The 405-nm laser was controlled via a plugin (iLas 2 , Roper Scientific) installed in MetaMorph. For photo-activation, 10×10-pixel regions set in the vicinity of the target cells were illuminated by the 405-nm laser with the settings of 100 repetitions×3 times and thickness 5. For photo-conversion, 2×2-pixel regions set in the vicinity of the target cells were illuminated by the 405-nm laser with the settings of 100 repetitions×3 times and thickness 5. An on-chip EM gain setting of 200 was used for the EMCCD camera. Exposure time was set in a range from 150 to 200 ms per acquisition. Z-stacks were set as 11×0.6 μm to 11×0.7 μm. Acquisition intervals were set in a range from 1.5 to 2 minutes.
Live-cell imaging with 3D-SIM
For live-cell imaging with 3D-SIM (Three Dimensional Structured Illumination Microscopy), cells were cultured in SC-dropout media to exponential phase at 23°C. Cells were then embedded in a layer of medium solidified with 1.2% low-melting-temperature agarose (Lonza) in a poly-lysine-coated glass bottom dish (MatTek). Image acquisitions were performed on a 3D-SIM super-resolution imaging system (DeltaVision OMX, Applied Precision) with a 60× objective lens (Olympus, Plan-Apo, 1.42NA). Image acquisition was controlled by softWoRx (Applied Precision). A 488-nm laser for GFP was used for excitation illumination. Excitation laser intensities were set at 10% of the maximal output. Camera gain was set as 1. Exposure time was set as 30 ms per acquisition. Z-stacks were set as 25×0.125 μm. Acquisition intervals were set at 3 minutes.
Image processing and quantitative analysis of the photo-activation experiment
Image processing and analysis were performed using Fiji 38 . For quantification of fluorescence intensities, image sequences generated by average projection were used. For quantification of fluorescence-signal-intensity kinetics after photo-activation, three ROIs (Region Of Interest) with rectangular shape were set at photo-activated and un-photo-activated areas and an area covering both. The integrated density was measured in each ROI. After subtraction of background signal and normalization by the value after septin hourglass splitting, the kinetics of the integrated density in each ROI was plot in a graph using Microsoft Excel.
Supplementary Material 1
📊 Figures
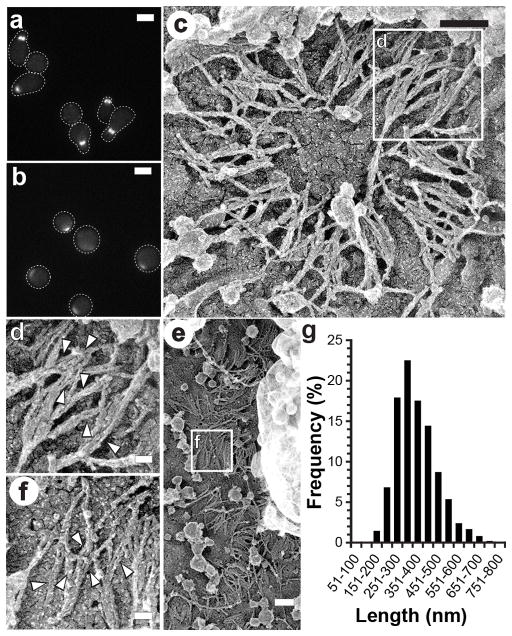
Figure 1
Double filaments parallel to the mother-bud axis make up the early hourglass structure
( a, b ) Fluorescence images of Cdc3-GFP in bar1u0394 (YEF7170) cells identically synchronized without ( a ) and with ( b ) zymolyase treatment. ( cu2013f ) Electron micrographs of cortical structures...
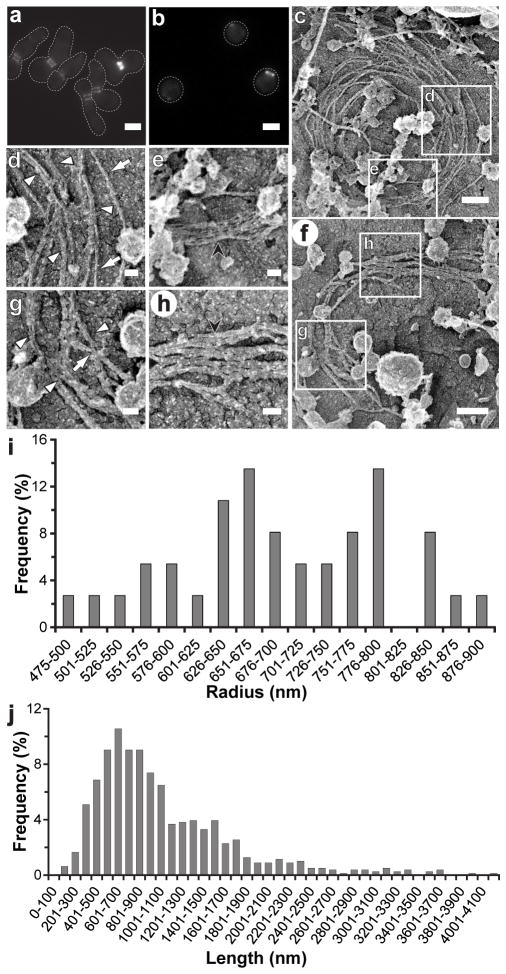
Figure 2
Circumferentially arranged filaments make up the double ring structure
( a, b ) Fluorescence images of Cdc3-GFP in cdc15-2 (YEF7171) cells identically synchronized without ( a ) and with ( b ) zymolyase treatment. ( cu2013h ) Electron micrographs of full rings ( c ) and ...
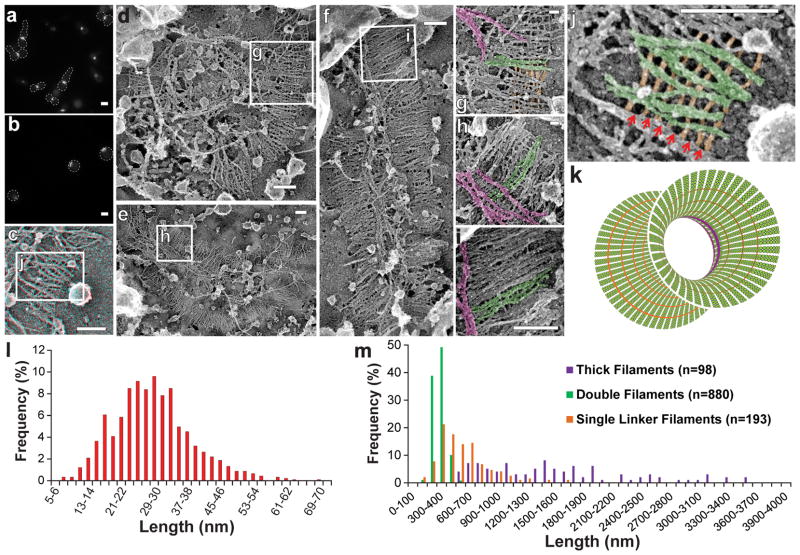
Figure 3
Three sets of filaments are present during hourglass-to-double ring transition
( a, b ) Fluorescence images of Cdc3-GFP in cdc15-2 (YEF7171) cells identically synchronized without ( a ) and with ( b ) zymolyase treatment. ( c ) Stereo pair images taken at +/u2212 10u00b0 are pre...
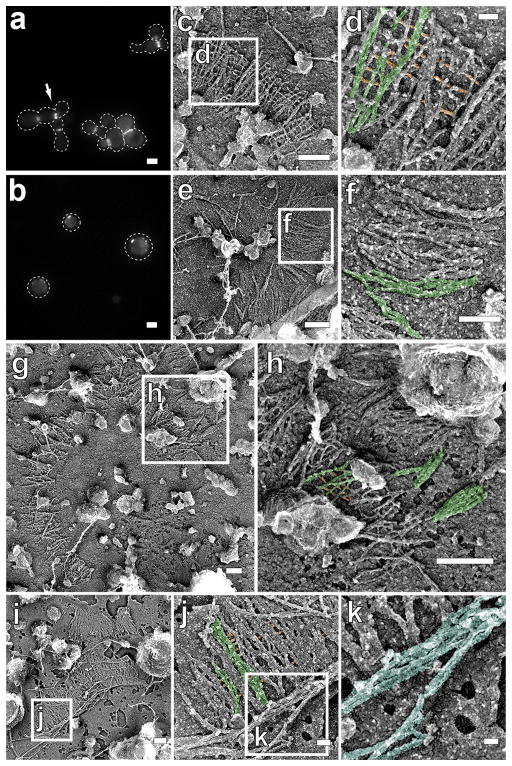
Figure 4
Thick filaments are absent in myo1u0394 cells arrested at the transition
( a , b ) Fluorescence images of Cdc3-GFP in myo1u0394 cdc15-2 (YEF7487) cells identically synchronized at the transition stage without ( a ) and with ( b ) zymolyase treatment. ( cu2013k ) Electron m...
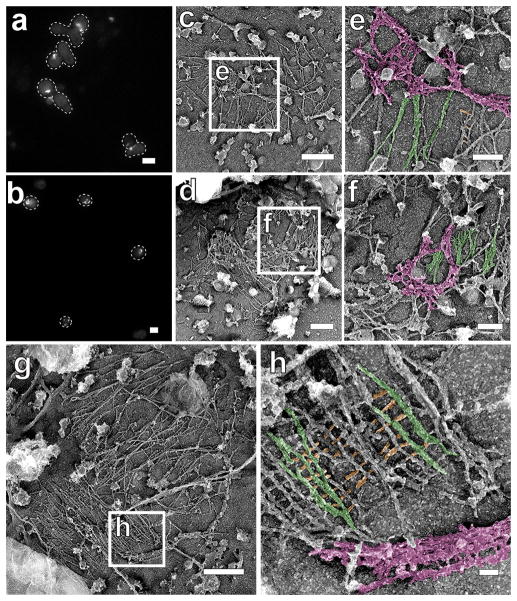
Figure 5
Transition structures are disorganized in shs1u0394 cells
( a , b ) Fluorescence images of Cdc3-GFP in shs1u0394 cdc15-2 (YEF7453) cells identically synchronized at the transition stage without ( a ) and with ( b ) zymolyase treatment. ( cu2013h ) Electron m...
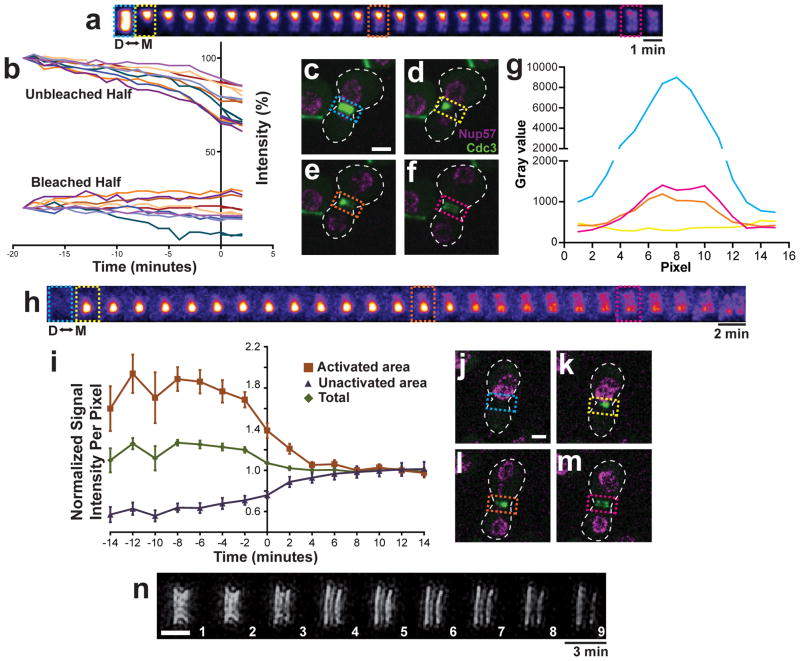
Figure 6
Septin hourglass-to-double ring conversion is accompanied by filament disassembly and reassembly
( au2013g ) Fluorescence recovery of Cdc3-GFP (YEF6021) after its photo-bleaching in one half of the hourglass in cells at anaphase. ( a ) Frames from time-lapse sequence at 1-min intervals. M and D, ...
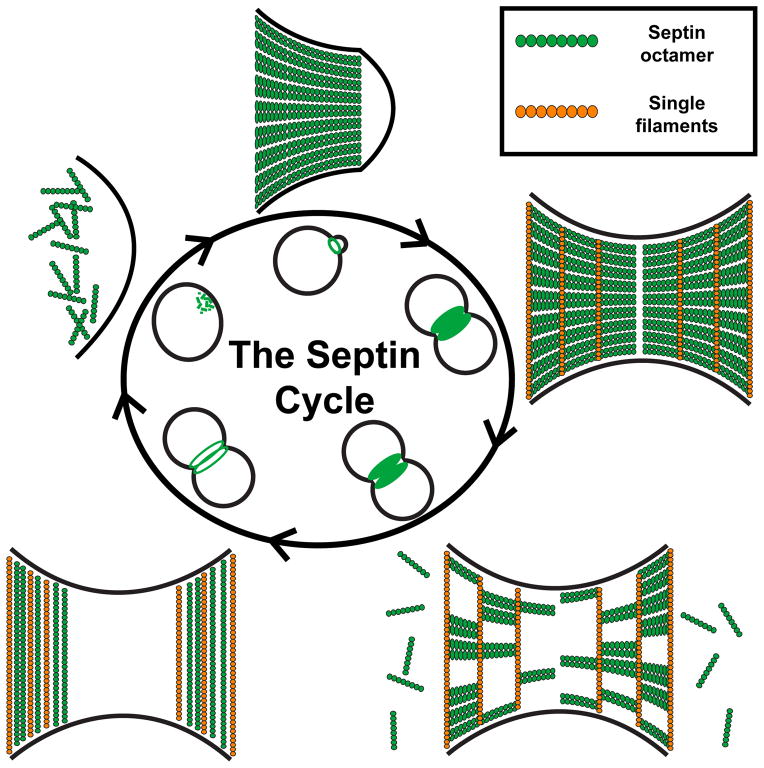
Figure 7
A model of septin architecture and remodeling dynamics during the cell cycle
See text for details.
Figure images are served from the NIH/NLM PubMed Central Open Access Subset or Europe PMC; copyright remains with the publishers and authors.
💬 Discussion
0 commentsNo comments yet. Be the first to start a discussion!
Leave a Comment