Abstract
BACKGROUND: Autophagy participates in innate immunity by eliminating intracellular pathogens. Consequently, numerous microorganisms have developed strategies to impair the autophagic machinery in phagocytes. In the current study, interactions between Leishmania major (L. m.) and the autophagic machinery of bone marrow-derived macrophages (BMDM) were analyzed. METHODS: BMDM were generated from BALB/c mice, and the cells were infected with L. m. promastigotes. Transmission electron microscopy (TEM) and electron tomography were used to investigate the ultrastructure of BMDM and the intracellular parasites. Affymetrix chip analyses were conducted to identify autophagy-related messenger RNAs (mRNAs) and microRNAs (miRNAs). The protein expression levels of autophagy related 5 (ATG5), BCL2/adenovirus E1B 19 kDa protein-interacting protein 3 (BNIP3), cathepsin E (CTSE), mechanistic target of rapamycin (MTOR), microtubule-associated proteins 1A/1B light chain 3B (LC3B), and ubiquitin (UB) were investigated through western blot analyses. BMDM were transfected with specific small interfering RNAs (siRNAs) against autophagy-related genes and with mimics or inhibitors of autophagy-associated miRNAs. The infection rates of BMDM were determined by light microscopy after a parasite-specific staining. RESULTS: The experiments demonstrated autophagy induction in BMDM after in vitro infection with L. m.. The results suggested a putative MTOR phosphorylation-dependent counteracting mechanism in the early infection phase and indicated that intracellular amastigotes were cleared by autophagy in BMDM in the late infection phase. Transcriptomic analyses and specific downregulation of protein expression with siRNAs suggested there is an association between the infection-specific over expression of BNIP3, as well as CTSE, and the autophagic activity of BMDM. Transfection with mimics of mmu-miR-101c and mmu-miR-129-5p, as well as with an inhibitor of mmu-miR-210-5p, demonstrated direct effects of the respective miRNAs on parasite clearance in L. m.-infected BMDM. Furthermore, Affymetrix chip analyses revealed a complex autophagy-related RNA network consisting of differentially expressed mRNAs and miRNAs in BMDM, which indicates high glycolytic and inflammatory activity in the host macrophages. CONCLUSIONS: Autophagy in L. m.-infected host macrophages is a highly regulated cellular process at both the RNA level and the protein level. Autophagy has the potential to clear parasites from the host. The results obtained from experiments with murine host macrophages could be translated in the future to develop innovative and therapeutic antileishmanial strategies for human patients.
🔬 Techniques
🔭 Microscopes
🧬 Organisms
💻 Software
✨ Fluorophores
🧪 Sample Preparation
🔬 Cell Lines
🏭 Microscope Brands
🧪 Reagent Suppliers
💻 Software Details
💾 Data Repositories
🏛️ Research Organizations (ROR)
Affiliated research institutions:
📋 Methods
BMDM were generated from BALB/c mice, and the cells were infected with L. m. promastigotes.
Transmission electron microscopy
(TEM) and electron tomography were used to investigate the ultrastructure of BMDM and the intracellular parasites. Affymetrix® chip analyses were conducted to identify autophagy-related messenger RNAs (mRNAs) and microRNAs (miRNAs). The protein expression levels of autophagy related 5 (ATG5), BCL2/adenovirus E1B 19 kDa protein-interacting protein 3 (BNIP3), cathepsin E (CTSE), mechanistic target of rapamycin (MTOR), microtubule-associated proteins 1A/1B light chain 3B (LC3B), and ubiquitin (UB) were investigated through western blot analyses. BMDM were transfected with specific small interfering RNAs (siRNAs) against autophagy-related genes and with mimics or inhibitors of autophagy-associated miRNAs. The infection rates of BMDM were determined by light microscopy after a parasite-specific staining.
Electronic supplementary material The online version of this article (doi:10.1186/s13071-015-0974-3) contains supplementary material, which is available to authorized users.
Methods
Nomenclature of genes and proteins The murine genes and proteins were named using the “Guidelines for Nomenclature of Genes, Genetic Markers, Alleles, and Mutations in Mouse and Rat” provided by the Mouse Genome Informatics (MGI) ( http://www.informatics.jax.org/mgihome/nomen/index.shtml ). According to these guidelines, murine gene symbols are written in italics, beginning with an uppercase letter, followed by all lowercase letters. In contrast, murine protein symbols are not italicized and use all uppercase letters. For human genes and proteins, the “Guidelines for Human Gene Nomenclature” of the Human Genome Organization (HUGO) Genome Nomenclature Committee (HGNC) were used ( http://www.genenames.org/about/guidelines ). As reported by these guidelines, human gene symbols are written in italics and use all uppercase letters, though, human protein symbols are not italicized and use all uppercase letters.
Show full methods section
BMDM were generated from BALB/c mice, and the cells were infected with L. m. promastigotes.
Transmission electron microscopy
(TEM) and electron tomography were used to investigate the ultrastructure of BMDM and the intracellular parasites. Affymetrix® chip analyses were conducted to identify autophagy-related messenger RNAs (mRNAs) and microRNAs (miRNAs). The protein expression levels of autophagy related 5 (ATG5), BCL2/adenovirus E1B 19 kDa protein-interacting protein 3 (BNIP3), cathepsin E (CTSE), mechanistic target of rapamycin (MTOR), microtubule-associated proteins 1A/1B light chain 3B (LC3B), and ubiquitin (UB) were investigated through western blot analyses. BMDM were transfected with specific small interfering RNAs (siRNAs) against autophagy-related genes and with mimics or inhibitors of autophagy-associated miRNAs. The infection rates of BMDM were determined by light microscopy after a parasite-specific staining.
Electronic supplementary material The online version of this article (doi:10.1186/s13071-015-0974-3) contains supplementary material, which is available to authorized users.
Methods
Nomenclature of genes and proteins The murine genes and proteins were named using the “Guidelines for Nomenclature of Genes, Genetic Markers, Alleles, and Mutations in Mouse and Rat” provided by the Mouse Genome Informatics (MGI) ( http://www.informatics.jax.org/mgihome/nomen/index.shtml ). According to these guidelines, murine gene symbols are written in italics, beginning with an uppercase letter, followed by all lowercase letters. In contrast, murine protein symbols are not italicized and use all uppercase letters. For human genes and proteins, the “Guidelines for Human Gene Nomenclature” of the Human Genome Organization (HUGO) Genome Nomenclature Committee (HGNC) were used ( http://www.genenames.org/about/guidelines ). As reported by these guidelines, human gene symbols are written in italics and use all uppercase letters, though, human protein symbols are not italicized and use all uppercase letters.
Strains and maintenance of Wild-Type
(WT) parasites The cloned virulent L. m. isolate (strain: MHOM/IL/81/FE/BNI), which was used for infecting BMDM, was maintained by passages in female BALB/c mice. The promastigotes were grown in vitro in blood agar cultures at 27 °C and 5 % CO 2 . The L. m. isolate (strain: MHOM/JL/80/Friedlin), which was used for infection of the RAW 264.7 macrophages, was cultivated in modified minimal Eagle’s medium (designated HOMEM, Life Technologies, 11095–080) supplemented with 10 % heat-inactivated fetal calf serum (FCS, Life Technologies, 10108–157) and 1 % penicillin streptomycin solution (Sigma-Aldrich, P4333) at 25 °C and 5 % CO 2 .
Ethical approval
The in vivo passages of L. m. parasites (strain: MHOM/IL/81/FE/BNI) in BALB/c mice were approved by the local government commission for animal protection (responsible authority: “Regierung von Unterfranken”; reference number: 55.2-2531.01-26/12). Infection of macrophages with L. m. promastigotes BMDM from female BALB/c mice (aged 7–10 weeks) were generated as previously described [ 24 ]. After the cells were cultured, BMDM were harvested and seeded in suspension culture plates with a cell concentration of 2 × 10 5 × ml −1 in Roswell Park Memorial Institute medium 1640 (RPMI, Life Technologies, 31870–025) with 10 % FCS (PAA Laboratories, A15-102), 2 mM L-glutamine (Biochrom, K0282), 10 mM 4-(2-hydroxyethyl)-1-piperazineethanesulfonic acid (Hepes, Life Technologies, 15630–056), 0.05 mM 2-mercaptoethanol (Sigma-Aldrich, M7154), 100 U × ml −1 penicillin (Sigma-Aldrich, P3032), and 50 μg × ml −1 gentamycin (Sigma-Aldrich, G1272). The cells were incubated for 4 h at 37 °C. During this time, the macrophages attached to the plastic surface of the culture dishes. Stationary-phase L. m. promastigotes (strain: MHOM/IL/81/FE/BNI) were directly harvested from the blood agar plates, washed twice with phosphate-buffered saline (PBS, Life Technologies, 14190–094) and resuspended in RPMI medium. Finally, the BMDM were infected at a ratio of 1:15 by exchanging the old culture medium with the L. m. promastigote cell suspension (3 × 10 6 × ml −1 ). Cocultures of BMDM with parasites were incubated for 1 and 24 h at 37 °C and 5 % CO 2 . For the time course analyses, BMDM were infected with L. m. promastigotes and incubated for 0.5, 1, 2, 4, 10, 24, 27, 30, and 48 h. To isolate proteins for the LC3B western blots, control and L. m. -infected macrophages were treated for 1 h with 100 nM bafilomycin A1 (Baf A1, Sigma-Aldrich, B1793) dissolved in dimethyl sulfoxide (DMSO, AppliChem, A3006) before lysis. Control cocultures for the Baf A1 experiments contained 0.5 % DMSO. RAW 264.7 macrophages were infected with L. m. promastigotes (strain: MHOM/JL/80/Friedlin) at a ratio of 1:15. Cocultures of RAW 264.7 macrophages with L. m. were incubated in RPMI medium supplemented with 10 % FCS, 2 mM L-glutamine and 50 μg × ml −1 gentamycin. The cocultures were incubated for 0.5 h or 24 h at 37 °C and 5 % CO 2 .
Induction of autophagy in BMDM with Hank’s Balanced Salt Solution
(HBSS) or rapamycin treatment BMDM were harvested and seeded in culture dishes followed by a 4 h incubation to facilitate attachment of the macrophages to the plastic surface. Finally, the medium was replaced by fresh RPMI medium containing 500 nM rapamycin (Calbiochem, 553210), or by HBSS (Life Technologies, 14175–046), to induce autophagy in BMDM. Under these conditions, BMDM were incubated for 1 h. TEM BMDM and RAW 264.7 macrophages were harvested from Petri dishes with a cell scraper and centrifuged to form a pellet (4 °C, 300 × g, 10 min). No washing steps with PBS were performed to avoid inducing autophagy in the macrophages through cell starvation. The macrophages were immediately fixed with 2.5 % glutaraldehyde solution (Sigma-Aldrich, G4004) after they were harvested. The embedding and cutting for TEM analyses was performed as recently described [ 11 ]. The contrast agents osmium tetroxide and uranyl acetate were used for TEM. The samples were imaged with an EM900 transmission electron microscope (Zeiss).
Electron tomography
Samples of L. m. -infected BMDM 24 h p.i. were processed as described in the TEM passage with the following modifications. Embedded samples were cut into approximately 250 nm thick slices. Afterwards, the sections were treated with 2.5 % uranyl acetate in ethanol for 15 min and lead citrate for 10 min before the sections were coated with carbon. Then, the sections were treated with 12 nm ProtA-Au-beads to provide fiducials for automated image alignment. A tilt image series was conducted from +70° to −70° with 1° increments at 200 kV with a JEM-2100 TEM (JEOL) and a TemCam-F416 camera (TVIPS) using the SerialEM software (Boulder Laboratory; ( http://bio3d.colorado.edu/SerialEM/ )) for automation [ 25 ]. The ETomo/IMOD software package (Boulder Laboratory; ( http://bio3d.colorado.edu/imod/ )) was used for the tilt image series alignment and tomographic reconstruction [ 26 ]. The reconstructed tomograms were exported as mp4-files using ImageJ version 1.49 g (National Institutes of Health [NIH]).
Assessment of autophagy in BMDM by TEM
The formation of vacuoles and the development of MLS are hallmarks of autophagy [ 15 , 16 , 18 – 22 ]. A semiquantitative score was applied to assess the autophagic phenotypes in L. m. -infected BMDM and control macrophages. First, the macrophages were imaged with 1600 × magnification by TEM. The area occupied by vacuoles and the presence of MLS were analyzed in sections from 50 individual macrophages. Scores between 0 and 3 were used to distinguish between different rates of vacuolization: 0 (light vacuolization) = 0–25 % of the cytoplasm area contained vacuoles, 1 (medium vacuolization) = 26–50 % of the cytoplasm area contained vacuoles, 2 (strong vacuolization) = 51–75 % of the cytoplasm area contained vacuoles, and 3 (heavy vacuolization) = more than 75 % of the cytoplasm area contained vacuoles. The presence of MLS was also assessed with a scoring system: 0 = no MLS detected in the investigated cell section, and 1 = detection of MLS in the cell section. The total autophagy score was calculated as the sum of vacuolization and presence of MLS scores. Therefore, the highest possible total autophagy score was 4. For each sample, the average of the total autophagy score for 50 analyzed BMDM samples was calculated. Additionally, the frequency of MLS in L. m. -infected and uninfected control BMDM was calculated by dividing the numbers of BMDM samples with MLS by the total number of MLS observed. Statistical analyses to compare total autophagy scores, or the frequency of MLS of analyzed samples, were performed by using the Mann–Whitney U test in SPSS software version 20.0.0 (IBM). Determining infection rates and nucleus-kinetoplast distances BMDM were infected as described above. The L. m. -infected BMDM and control BMDM were incubated for time points ranging from 0.5 to 48 h. After incubation, 2 × 10 5 BMDM were transferred to Cytospin tubes (Thermo Scientific). BMDM were attached to object slides by centrifugation at 1500 rpm for 5 min with a Shandon Cytospin3 (Thermo Scientific). Afterwards, the slides were fixed and stained with a Diff-Quik kit (Medion Diagnostics, 130832) according to the manufacturer’s protocol. The slides were analyzed with an Eclipse 50i light microscope (Nikon) using NIS Elements software version 3.22.11 (Nikon). To calculate the average infection rates, the number of intracellular parasites per individual macrophage for each analyzed sample was determined. For each sample, 50 individual macrophages were analyzed. During differentiation of L. m. promastigotes (0 h p.i.) to amastigotes (24 h p.i.), the nucleus-kinetoplast distance shortened significantly from approximately 4 μm to 1.8 μm. The average nucleus-kinetoplast distances were determined by measuring the distances of 50 individual intracellular parasites with an Eclipse 50i light microscope (Nikon) and NIS Elements software version 3.22.11 (Nikon). Statistical significance for the average infection rates, or the average nucleus-kinetoplast distances, was tested with a t -test in SPSS software version 20.0.0 (IBM). RNA isolation, Affymetrix® chip hybridization, and analyses of expression data Total RNA from L. m. -infected BMDM and uninfected control BMDM was isolated with the RNeasy Mini kit (Qiagen, 74104) and homogenized with QIAshredder (Qiagen, 79656) for the analyses of differential mRNA expression.
Isolation of total
RNA was performed according to the manufacturer’s protocol. On-column DNase digestion was performed with the RNase-Free DNase Set (Qiagen, 79254). The samples for miRNA transcriptomic analysis were isolated with Trizol (Life Technologies, 15596–026) according to the manufacturer’s instructions. The concentrations of the RNA isolates were measured with NanoDrop spectrophotometry (NanoDrop 1000, Thermo Scientific). Samples were aliquoted and stored at −80 °C until they were used. RNA degradation was assessed with a Bioanalyzer 2100 (Agilent), and the observed RNA integrity numbers (RINs) ranged between 8.8 and 9.5. 10 is the highest possible RIN. For mRNA analyses, 100 ng total RNA was transcribed in vitro , biotin-labeled (IVT-Express kit, Affymetrix, 901229) and hybridized to GeneChip Mouse Genome 430 2.0 microarrays (Affymetrix, 900497). The samples for hybridization with GeneChip miRNA 3.0 (Affymetrix, 902018) were processed with the FlashTag biotin HSR RNA Labeling kit (Affymetrix, 901910) using 1 μg total RNA as starting material. The signals from streptavidin-phycoerythrin stains were detected with a GeneChip Scanner 3000 7G (Affymetrix). The microarray readout from the mRNA probes with a sequence match in the L. m. genome were excluded from the analysis to avoid confounding the host expression values due to cross-hybridization with parasite transcripts [ 27 ]. The raw microarray signals were normalized with variance stabilization (mRNA) or quantiles normalization (miRNA) and summarized to probe set expression values using the Robust Multi-array Average (RMA) algorithm [ 28 , 29 ]. Prior to comparing the infected versus control BMDM samples, the probe sets exclusively displaying expression changes between the uninfected control samples taken at 1 and 24 h p.i. were excluded from the analysis to minimize the detection of effects from culture conditions. Statistical significance was tested using the false discovery rate (FDR) according to the Benjamini and Hochberg method. The genes displaying globally significant expression changes (FDR < 0.05) after L. m. infection of BMDM were subjected to category enrichment analyses. For these analyses the Kyoto Encyclopedia of Genes and Genomes (KEGG) and the Gene Ontology (GO) databases were used ( http://www.genome.jp/kegg/ , http://geneontology.org/ ). The KEGG database provides information about genes and biological pathway maps for transcriptomic analyses. Moreover, the GO database can be used to classify genes into different categories. Therefore, differentially expressed genes of L. m. -infected BMDM 24 h p.i. could be compared to KEGG pathway maps to identify significantly regulated pathways (FDR < 0.05). Additionally, differentially expressed genes of L. m. -infected BMDM 24 h p.i. were classified into GO categories to identify their roles in biological processes and their molecular function. The data preprocessing, visualization and detection of differentially expressed genes were performed with the Expression Console v1.2.1.20 (Affymetrix), and in the R environment ( http://www.r-project.org ) using the Bioconductor packages “affy”, “limma”, “made4”, and “vsn” (available at ( http://www.bioconductor.org )). The over-representation of gene expression changes in the KEGG pathways and GO categories (“category enrichment analyses”) were detected with the Gene Set Enrichment Analysis (GSEA) [ 30 ]. The raw and preprocessed microarray data were deposited in MIAME compliant form at the Gene Expression Omnibus (GEO; ( http://www.ncbi.nlm.nih.gov/geo )) in entries GSE52624 (mRNA) and GSE58369 (miRNA). The autophagy-related protein-protein interaction data were recently published by Behrends and colleagues and were retrieved from the original publication as well as the cited database ([ 31 ], http://besra.hms.harvard.edu/ipmsmsdbs/comppass.html ). The miRNA target interactions were examined with the TargetScan v6.2 database [ 32 ]. Cytoscape v3.1.0 was used for network visualization [ 33 ].
Western blot analyses Proteins from L. m. -infected
BMDM and control macrophages were isolated with RIPA buffer (Cell Signaling Technology, 9806) for western blot analyses of ATG5, BNIP3, CTSE, β-Actin (ACTB), macrophage migration inhibitory factor (MIF), MTOR, phosphorylated MTOR (p-MTOR), ribosomal protein S6 (RPS6), phosphorylated RPS6 (p-RPS6), and UB. The samples isolated with RIPA buffer were processed according to the manufacturer’s protocol. For LC3B western blot analyses, proteins were isolated with Laemmli buffer according to a protocol developed to investigate LC3B lipidation [ 34 ]. Finally, all samples were aliquoted and stored at −20 °C until they were used. The proteins were size-separated by sodium dodecyl sulfate polyacrylamide gel electrophoresis (SDS-PAGE). Western blots were performed according to the datasheets of the individual primary antibodies. Antibodies, including ACTB (#4970), ATG5 (#12994), BNIP3 (#3769), LC3B (#3868), MTOR (#2972), p-MTOR (#2971), p-RPS6 (#2211), RPS6 (#2217), and UB (#3936), were purchased from Cell Signaling Technology. The antibodies against CTSE (sc-30055) and MIF (sc-20121) were purchased from Santa Cruz Biotechnology. The secondary antibodies for all primary antibodies were horse radish peroxidase (HRP)-conjugated (Cell Signaling Technology [#7074] for the primary antibodies from Cell Signaling Technology, and secondary antibodies from Santa Cruz Biotechnology [sc-2030] were used for the primary antibodies from Santa Cruz Biotechnology. Subsequently, the binding of secondary antibodies was detected with HRP luminal substrate (Merck Millipore Corporation, WBKLS0100). The luminescence was monitored with Luminescent Image Analyzer ImageQuant LAS 4000 (GE Healthcare Life Sciences). The signal intensities were analyzed with ImageJ version 1.45 s software (NIH). ACTB was the internal loading control for all western blot experiments. Statistical significance was tested using a one-tailed t -test in Excel 2013 software (Microsoft).
Transfection of L. m. -infected
BMDM with siRNAs, or miRNA mimics or inhibitors BMDM were transfected using the Amaxa Mouse Macrophage Nucleofector Transfection kit (Lonza, VPA-1009) and the Nucleofector 2b Device (Lonza) according to the manufacturer’s protocol. To analyze infection rates after specific downregulation of ATG5, MTOR, and UB by RNA interference, BMDM were transfected 4 h prior to infection directly after the cells were harvested from suspension plates. Specific siRNAs were purchased from Santa Cruz Biotechnology ( Atg5 siRNA [sc-41446], Mtor siRNA [sc-35410], Ub siRNA [sc-36770] as well as a negative control siRNA [sc-37007]). To confirm downregulation of corresponding proteins, duplicate samples were isolated with RIPA buffer (Cell Signaling) 2, 8, and 20 h p.i. (6, 12, and 24 h after transfection). Western blots of the respective proteins were performed as described above. Transfections of L. m. -infected BMDM with specific siRNAs to downregulate Bnip3 (sc-37452, Santa Cruz) or Ctse (sc-41474, Santa Cruz) were performed 20 h p.i.. Downregulation of BNIP3 and CTSE was confirmed with western blot analyses (see above) at 26, 32, and 44 h p.i. (6, 12, and 24 h after transfection). To investigate the role of differentially expressed miRNAs identified by Affymetrix ® chip analyses, L. m. -infected BMDM were transfected 20 h p.i.. For upregulated miRNAs, L. m. -infected BMDM were transfected with miRNA inhibitors (mmu-miR-155-5p: MIN0000165, Qiagen; mmu-miR-210-5p: MIN0017052, Qiagen). For downregulated miRNAs, L. m. -infected BMDM were transfected with miRNA mimics (mmu-miR-101c: MSY0019349, Qiagen; mmu-miR-129-5p: MSY0000209, Qiagen). The negative control for the miRNA mimics or inhibitors was purchased from Qiagen (1027271). The infection rates of all transfected L. m. -infected BMDM were determined 48 h p.i. as described above. The cytotoxicity of siRNAs and miRNAs against BMDM were tested by alamarBlue® cytotoxicity assay as described previously [ 24 ]. Transfection of BMDM with the siRNAs and miRNA mimics or inhibitors had no cytotoxic effects on BMDM (Additional file 2 : Figure S2). Determination of half maximal Inhibitory Concentration (IC 50 ) values IC 50 s for Baf A1 and rapamycin against L. m. amastigotes and BMDM were determined using the amastigote drug screening assay as previously described [ 24 ]. Statistical significance was tested using a one-tailed t -test in Excel 2013 software (Microsoft).
📊 Figures
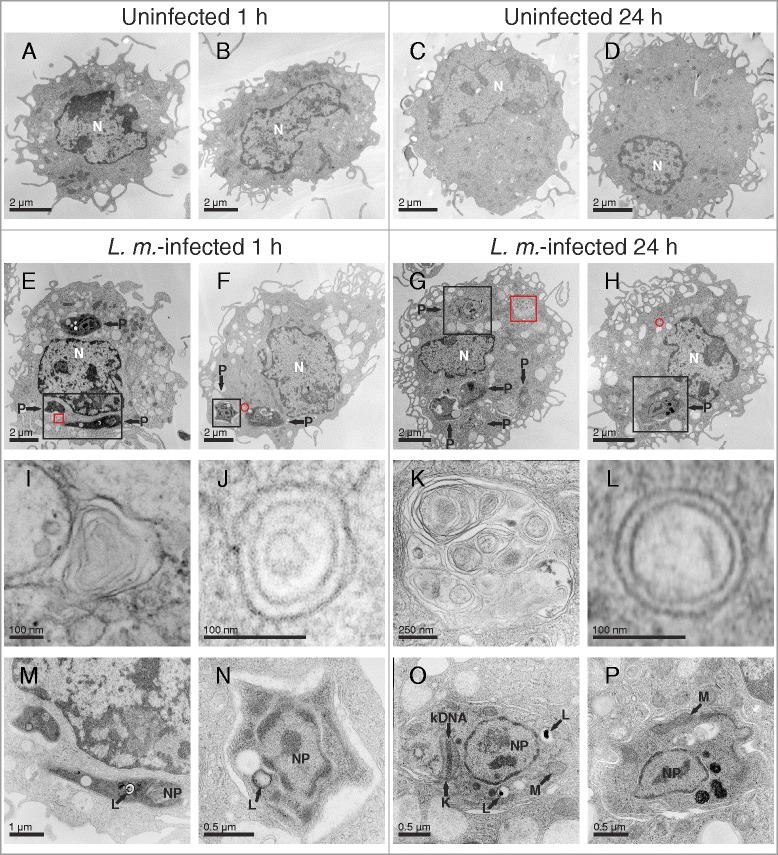
Fig. 1
Ultrastructural investigation of autophagy induction in L. m. -infected BMDM with TEM. Methods: BMDM from BALB/c mice were infected with L. m. promastigotes for ( e , f , i , j , m , n ) 1u00a0h and (...
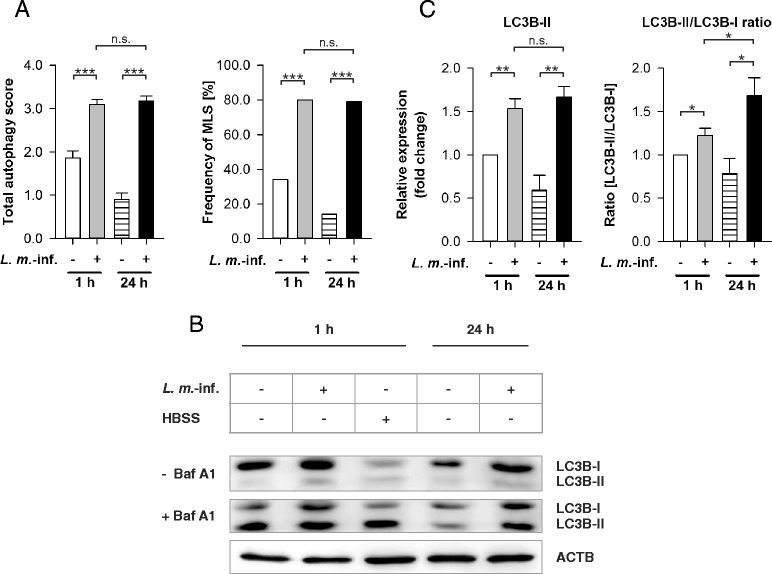
Fig. 2
Autophagy assessment in L. m. -infected BMDM with TEM and LC3B western blot analyses. Methods: ( a u2013 c ) BMDM from BALB/c mice were infected with L. m. promastigotes for 1u00a0h or 24u00a0h. Uninf...
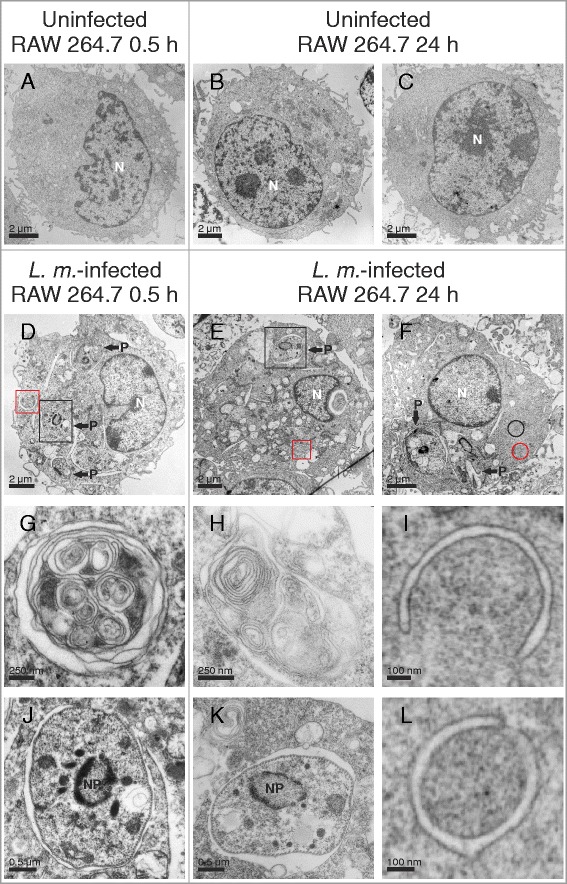
Fig. 3
Ultrastructural investigation of autophagy induction in L. m. -infected RAW 264.7 macrophages with TEM. Methods: RAW 264.7 macrophages were infected with L. m. promastigotes for ( d , g , j ) 0.5u00a0...
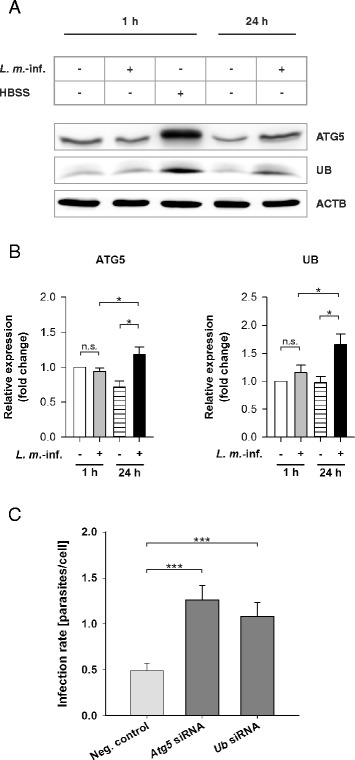
Fig. 4
ATG5 and UB western blot analyses with protein extracts from L. m. -infected and HBSS-starved BMDM as well as determination of the infection rates of L. m. -infected BMDM after ATG5 and UB downregulat...
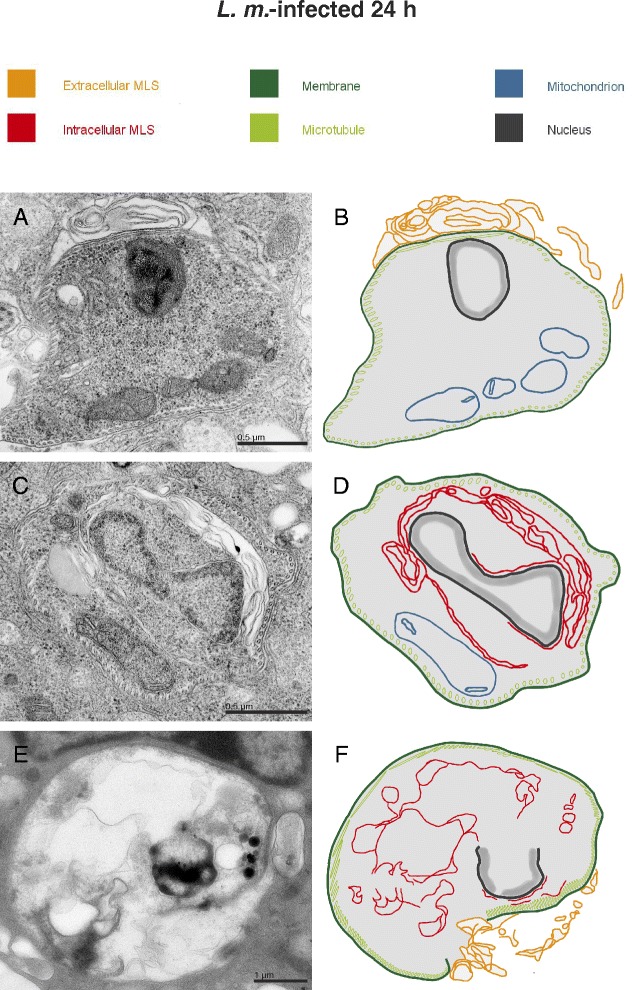
Fig. 5
Ultrastructural investigation of parasite-associated localization of MLS with TEM. Methods: BMDM from BALB/c mice were infected with L. m. promastigotes for 24u00a0h and subjected to TEM analyses. Res...
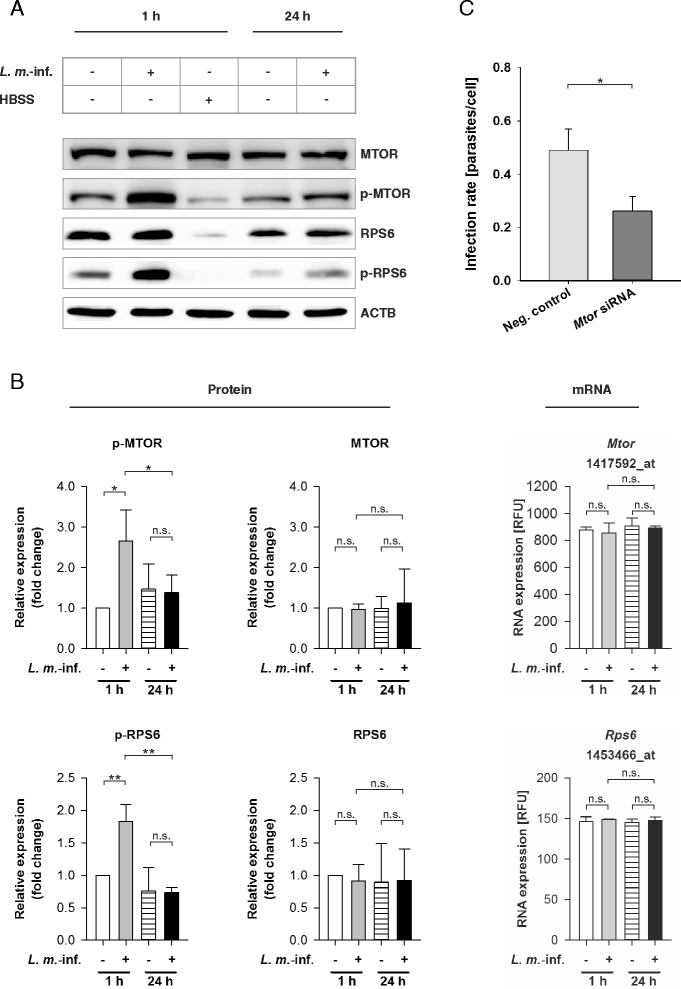
Fig. 6
MTOR and RPS6 transcriptomic and western blot analyses with RNAs and protein extracts from L. m. -infected and HBSS-starved BMDM, and determination of infection rates of L. m. -infected BMDM after MTO...
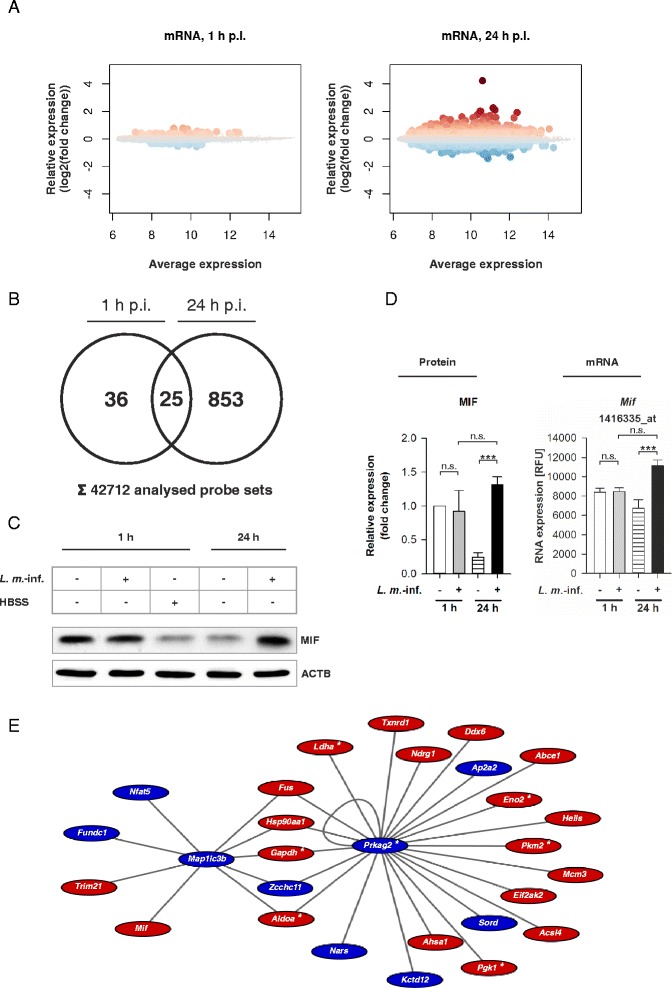
Fig. 7
Global analysis of differentially expressed mRNAs in L. m. -infected BMDM and MIF western blot analyses with protein extracts from L. m. -infected and HBSS-starved BMDM. Methods: ( a u2013 e ) BMDM fr...
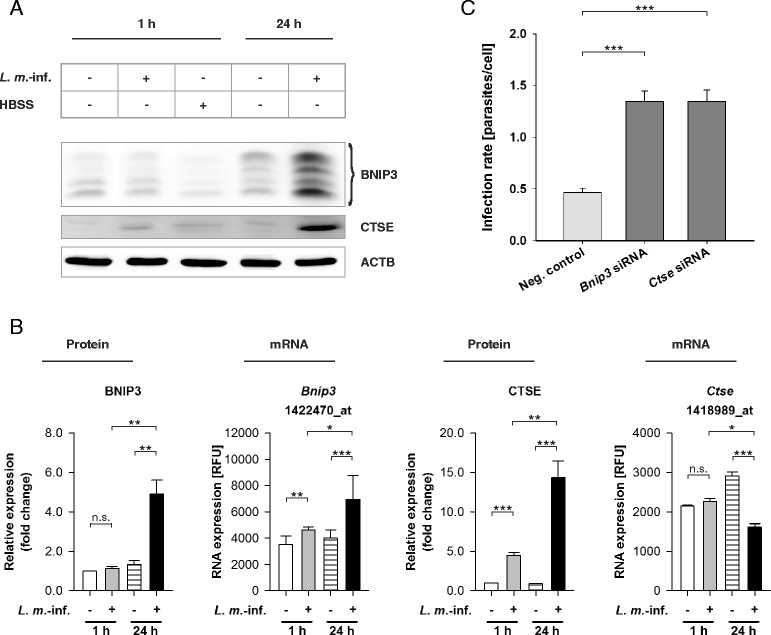
Fig. 8
BNIP3 and CTSE transcriptomic and western blot analyses with RNAs and protein extracts from L. m. -infected and HBSS-starved BMDM as well as determination of the infection rates of L. m. -infected BMD...
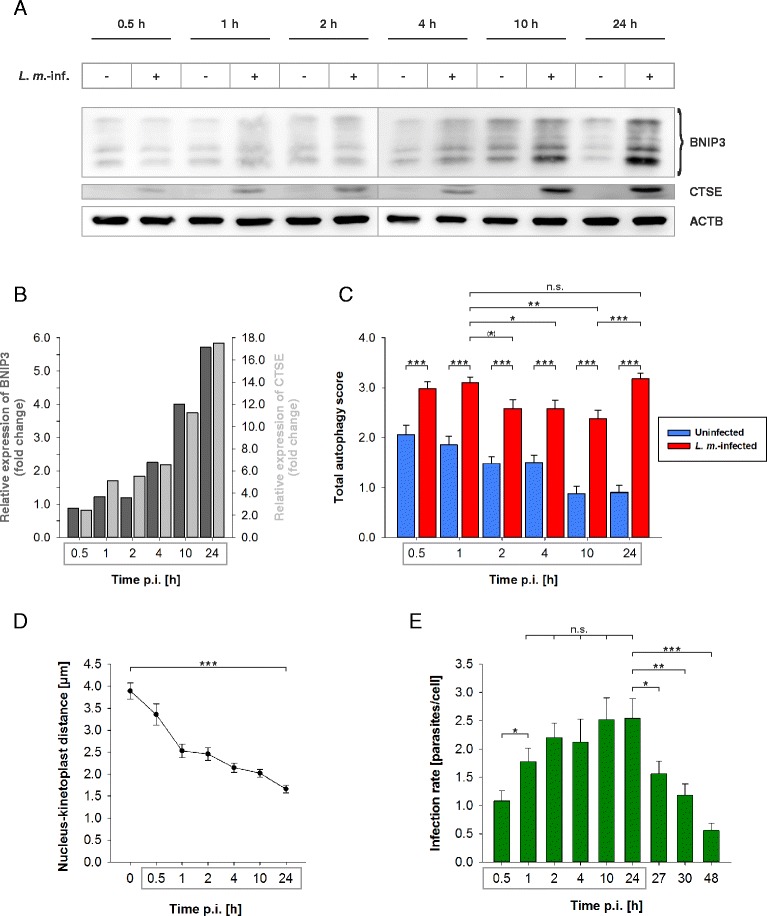
Fig. 9
Time course experiments of BNIP3 and CTSE western blot analyses with protein extracts from L. m. -infected BMDM, total autophagy scores, determination of the nucleus-kinetoplast distances, and infecti...
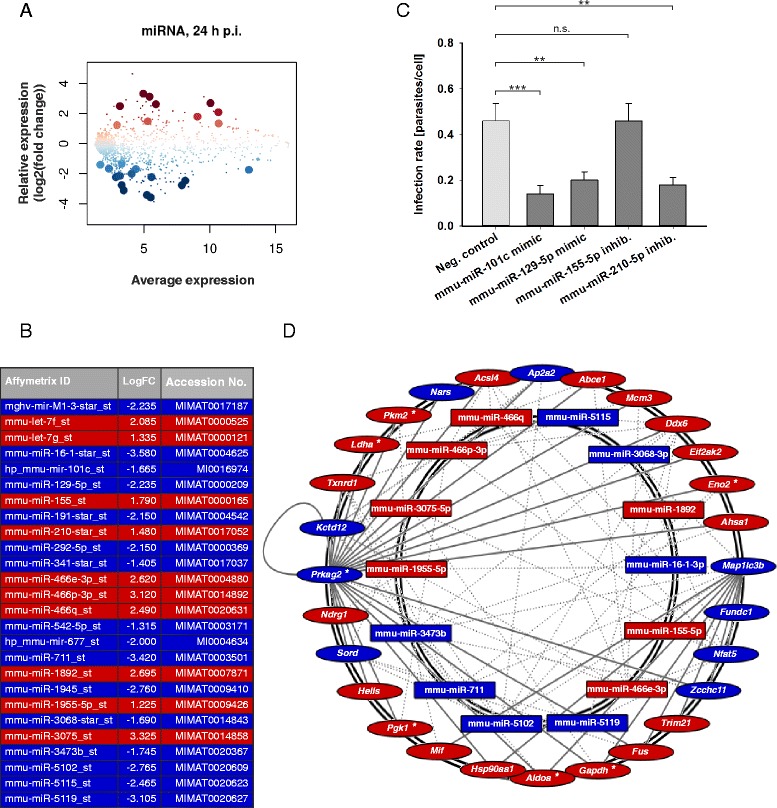
Fig. 10
Global analysis of differentially expressed miRNAs in L. m. -infected BMDM, bioinformatical prediction of miRNA interactions with LISA, and infection rates of L. m. -infected BMDM after transfection w...
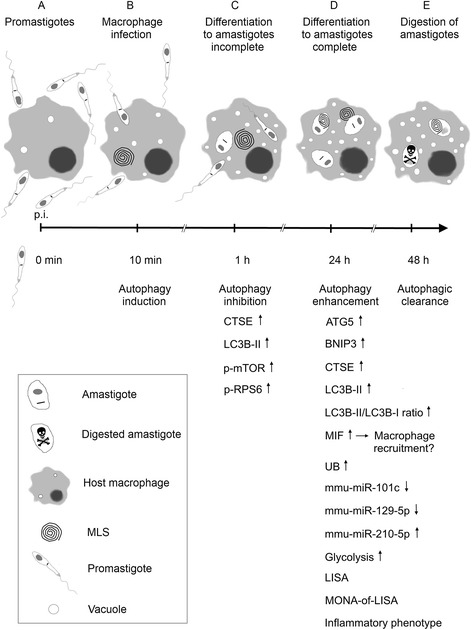
Fig. 11
Schematic summary of results. a 0u00a0h p.i.: macrophages were infected with L. m. promastigotes. b 10u00a0min p.i.: promastigotes attached to macrophages and were phagocytosed by the cells. c 1u00a0h...
Figure images are served from the NIH/NLM PubMed Central Open Access Subset or Europe PMC; copyright remains with the publishers and authors.
💬 Discussion
0 commentsNo comments yet. Be the first to start a discussion!
Leave a Comment