Abstract
Coordination of ciliary beating is essential to ensure mucus clearance in the airway tract. The orientation and synchronization of ciliary motion responds in part to the organization of the underlying cytoskeletal networks. Using electron tomography on mouse trachea, we show that basal bodies are collectively hooked at the cortex by a regular microtubule array composed of 4-5 microtubules. Removal of galectin-3, one of basal-body components, provokes misrecruitment of γ-tubulin, disorganization of this microtubule framework emanating from the basal-foot cap, together with loss of basal-body alignment and cilium orientation, defects in cilium organization and reduced fluid flow in the tracheal lumen. We conclude that galectin-3 plays a crucial role in the maintenance of the microtubule-organizing centre of the cilium and the 'pillar' microtubules, and that this network is instrumental for the coordinated orientation and stabilization of motile cilia.
🔬 Techniques
🔭 Microscopes
💻 Software
✨ Fluorophores
🧪 Sample Preparation
🔬 Cell Lines
🏭 Microscope Brands
🧪 Reagent Suppliers
📷 Detectors
💻 Software Details
💾 Data Repositories
🏛️ Research Organizations (ROR)
Affiliated research institutions:
📋 Methods
Reagents and antibodies
Rat (dilution 1:50) and rabbit polyclonal (1:100) antibodies directed against Galectin-3 were kindly provided by Dr. H. Leffler (Lund University, Sweden) and Dr. H.P. Elsässer (Philipps University, Marburg), respectively. Monoclonal anti-acetylated α-tubulin (clone 6-11B-1, 1:200) and γ-tubulin (clone GTU-88, 1:50) were from Sigma (Saint-Louis, MO) and Abcam (Cambridge), respectively. Rabbit polyclonal IFT88 (1:100) was from Proteintech (Chicago, IL). Anti-mouse Alexa-488 and anti-rabbit Alexa-568 secondary antibodies (1:250) were from Life Technologies (Paisley, UK).
Animals
Wt and Galectin-3 null mutant ( gal3-/-) 36 mice used here were of the 129Sv background. The animals were maintained in a specific pathogen-free animal house facility, and handled in accordance with the French regulation for animal care. A total of N = 43 wt and N = 43 gal3-/- male adult mice were used. All samples were number coded for blind experiments. Three-month old mice were killed by cervical dislocation. After the thorax was opened, the submandibular gland and the infrahyoid musculature were removed. The trachea was cut at the borders between the larynx and the bronchial bifurcation, and processed as follows.
Immunohistochemistry and immunofluorescence microscopy
Two fixation procedures were used. Samples were incubated overnight at 4°C in Carnoy fixative (60% ethanol, 30% chloroform, 10% acetic acid) and stored in 70% ethanol. Alternatively, samples were fixed overnight at 4°C in 70% methanol, followed by one day at 4°C in 100% methanol, and then stored at -20°C in methanol. N=8 wt and N=8 gal3-/- tracheas were paraffin-embedded for sectioning. Sections (5μm) were de-waxed in a xylene bath, rehydrated once in isopropanol, then in decreasing ethanol solutions, and were processed for either immunohistochemistry or immunostaining. Mucus was detected by Alcian blue staining, and nuclei were then detected by Nuclear Fast Red incubation. Images were acquired using an Eclipse 90i Upright microscope and a cool SNAP HQ2 CCD color camera (Nikon, Tokyo). For immunostaining, de-waxed tissue sections were blocked in 1.5% donkey serum (Sigma) for 1h. Primary antibody incubations were performed at 4°C for 12h, and secondary antibody incubations at room temperature for 2h, both in 1.5% donkey serum solution. Hoechst 33342 staining (Life Sciences) was used to detect nuclei. Tissue sections were mounted in Mowiol488 solution. Confocal images of fixed cells were acquired on a Leica TCS SP5 microscope using a 63x and a 100x lens (Leica Microsystems, Wetzlar, Germany).
Show full methods section
Reagents and antibodies
Rat (dilution 1:50) and rabbit polyclonal (1:100) antibodies directed against Galectin-3 were kindly provided by Dr. H. Leffler (Lund University, Sweden) and Dr. H.P. Elsässer (Philipps University, Marburg), respectively. Monoclonal anti-acetylated α-tubulin (clone 6-11B-1, 1:200) and γ-tubulin (clone GTU-88, 1:50) were from Sigma (Saint-Louis, MO) and Abcam (Cambridge), respectively. Rabbit polyclonal IFT88 (1:100) was from Proteintech (Chicago, IL). Anti-mouse Alexa-488 and anti-rabbit Alexa-568 secondary antibodies (1:250) were from Life Technologies (Paisley, UK).
Animals
Wt and Galectin-3 null mutant ( gal3-/-) 36 mice used here were of the 129Sv background. The animals were maintained in a specific pathogen-free animal house facility, and handled in accordance with the French regulation for animal care. A total of N = 43 wt and N = 43 gal3-/- male adult mice were used. All samples were number coded for blind experiments. Three-month old mice were killed by cervical dislocation. After the thorax was opened, the submandibular gland and the infrahyoid musculature were removed. The trachea was cut at the borders between the larynx and the bronchial bifurcation, and processed as follows.
Immunohistochemistry and immunofluorescence microscopy
Two fixation procedures were used. Samples were incubated overnight at 4°C in Carnoy fixative (60% ethanol, 30% chloroform, 10% acetic acid) and stored in 70% ethanol. Alternatively, samples were fixed overnight at 4°C in 70% methanol, followed by one day at 4°C in 100% methanol, and then stored at -20°C in methanol. N=8 wt and N=8 gal3-/- tracheas were paraffin-embedded for sectioning. Sections (5μm) were de-waxed in a xylene bath, rehydrated once in isopropanol, then in decreasing ethanol solutions, and were processed for either immunohistochemistry or immunostaining. Mucus was detected by Alcian blue staining, and nuclei were then detected by Nuclear Fast Red incubation. Images were acquired using an Eclipse 90i Upright microscope and a cool SNAP HQ2 CCD color camera (Nikon, Tokyo). For immunostaining, de-waxed tissue sections were blocked in 1.5% donkey serum (Sigma) for 1h. Primary antibody incubations were performed at 4°C for 12h, and secondary antibody incubations at room temperature for 2h, both in 1.5% donkey serum solution. Hoechst 33342 staining (Life Sciences) was used to detect nuclei. Tissue sections were mounted in Mowiol488 solution. Confocal images of fixed cells were acquired on a Leica TCS SP5 microscope using a 63x and a 100x lens (Leica Microsystems, Wetzlar, Germany).
Ex vivo analyses of tracheal epithelial cells
Tracheal explants were prepared from N=7 wt and N=7 gal3-/- mice according to Delmotte and Sanderson (2006), with minor modifications. The trachea were removed and sliced into 0.5mm-wide rings. The rings were washed three times in pre-warmed DMEM 4.5g/l glucose medium (Life Technologies) complemented with 25mM HEPES (pH 7.4) and mounted in a home made chamber, in the same medium. This experiment was carried out using three tracheal explants per animal. Video acquisitions of cilium beating profile were performed using a LEICA DMI6000, a high-resolution camera CoolSnap HQ2 (Photometrics, Tucson, AZ) and MetaMorph 6 software (Molecular Devices, Sunnyvale, CA). It was performed on N=7 wt and N=7 gal3-/- mice, using three tracheal explants per animal. To record ciliary flow, suspensions of 0.2μm fluorescent polystyrene beads (Sigma) were applied on N=6 wt and N=6 gal3-/- tracheal rings. Automatic bead tracking and movement calculations were performed using IMARIS 7.0 (Bitplane, Zurich). EM analyses For TEM analyses, tissue samples were isolated from N=8 wt and N=7 gal3-/- mouse tracheas, cut into small rings of about 1mm and immersion-fixed overnight at 4°C in 1.6% glutaraldehyde in Milloning buffer (0.1M Na 2 HPO 4 , 0.1M NaH 2 PO 4 , pH 7.3). Standard procedures for dehydration and embedding in Epon-Araldite (Electron Microscopy Sciences, Hatfield, PA) were used 37 . Semi-thin sections were stained with methylene blue and azur II. The ciliary length was measured on semi-thin sections of N = 3 wt and N = 3 gal3-/- mice, n (wt) = 74 cells, n ( gal3-/- ) = 101 cells. Ultrathin sections were stained with uranyl acetate and lead citrate solutions before examination using a Tecnai T12 microscope (FEI, Eindhoven, Netherlands). For SEM, N=4 wt and N=4 gal3-/- longitudinal trachea sections were immersion-fixed overnight at 4°C in 1.6% glutaraldehyde in Milloning buffer. The samples were dehydrated by passing through a graded series of ethanol solutions, then dried by the CO 2 critical-point method and coated with a 20-40nm gold thin layer using Scancoat Six (HHV, Crawley, UK). Acquisitions were performed using a Cambridge Stereoscan 260 (Cambridge Instruments, Somerville, MA). N=4 wt and N=4 gal3-/- tracheas were processed for immunogold experiments and TEM analyses. Tissue samples were fixed overnight in 1% formaldehyde, 0.1% glutaraldehyde, 0.1M cacodylate buffer, pH 7.4 and then embedded in Lowicryl K4M resin (Polysciences Ltd., Warrington, PA). Ultrathin sections were treated with 1% BSA before incubation in rat monoclonal anti-Galectin-3 or in mouse monoclonal anti-γ-tubulin antibody, followed by 10nm immunogold-conjugated goat anti-rat or anti-mouse antibody solution (British Biocell International, Cardiff, UK), respectively. Tomographic analyses Sections (300nm) from mouse tracheal Epon blocks of N=3 wt and N=3 gal3-/- were cut using a Leica UC7 microtome (Leica Microsystems, Milton Keynes, UK). The sections were mounted on formvar-coated copper 133 mesh finder grids (Agar, Stansted, UK), which were subsequently coated on both sides with 10nm protein-A gold (EMS, Hatfield, PA). Dual axis tilt series were collected from -66° to +66° at 2° intervals with SerialEM 38 at a magnification of 19,000x using a defocus of -0.5μm on Tecnai F20 microscope (FEI) equipped with a Gatan 4k CCD camera (UltraScan 4000) (Gatan, Abingdon Oxon, UK). The tilt series were aligned and reconstructed using IMOD software 39 , 31 ( http://bio3d.colorado.edu/imod/ ). The reconstructions were then filtered using nonlinear anisotropic diffusion 40 implemented in IMOD. The segmentation of the tomograms shown in Figure 4 E and Supplementary Figure 3 was performed manually in IMOD. Differences between microtubules and actin were based on fiber diameter.
Measurement of axoneme and basal body orientation
Axoneme orientation was assessed by measuring central pair orientation in individual cells on TEM acquisitions. Statistical analyses were performed with MATLAB software (MathWorks) and displayed in circular plots bidirectionally. N (wt)=8 mice, with n (wt)=338 axonemes and N ( gal3-/-) = 7 mice with n ( gal3-/- ) = 411 axonemes. Basal body orientation was assessed as previously reported 9 . Tracheas were orientated according the lung-mouth axis during fixation. After TEM acquisitions, statistical analyses were performed using Oriana2.0 software (Kovach Computing Services, UK). Results are shown in circular plots in which each black vector represents the mean orientation of basal bodies in individual cells. Length of the black vector (r cell ) is the complement of the circular variance and illustrates basal body coordination. The red vector illustrates the intercellular coordination of orientation across the trachea and its length (r trachea ) the complement of the variance of individual cell mean orientation (black vector orientation). N (wt) = 3 mice, n (wt) = 40 cells and n (wt) = 284 basal bodies; N ( gal3-/- ) = 3 mice, n ( gal3-/- ) = 52 cells and n ( gal3-/- ) = 343 basal bodies.
Supplementary Material Supplementary information accompanies this paper at http://www.nature.com/naturecomunications . Supplementary Figures Supplementary Movie 1 Supplementary Movie 2 Supplementary Movie 3 Supplementary Movie 4 Supplementary Movie 5 Supplementary Movie 6 Supplementary Movie 7 Supplementary Movie 8
📊 Figures
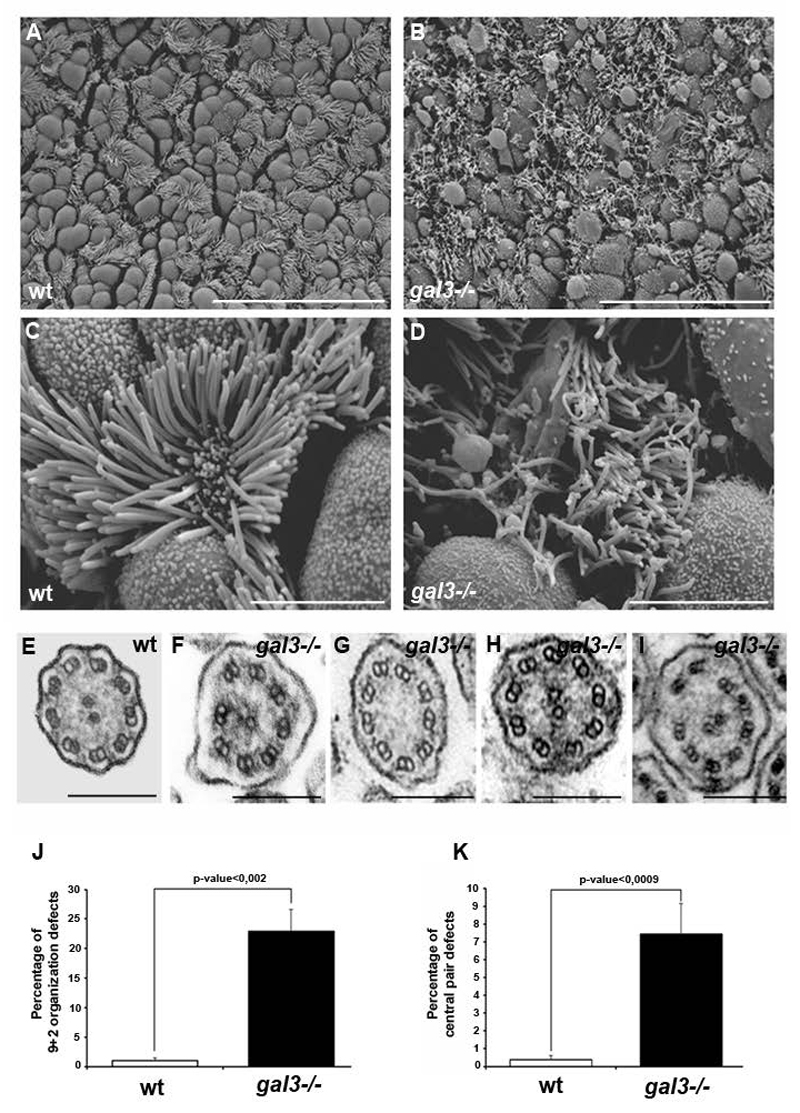
Figure 1
Defective motile cilium organization in mouse gal3-/- tracheas.
A-D , the luminal surface of wt ( A and C ) ( N = 4 wt mice ) and gal3-/- ( B and D ) ( N = 4 gal3-/- mice ) tracheal epithelium was analyzed using SEM. Low magnifications ( A and B ) and high magnifi...
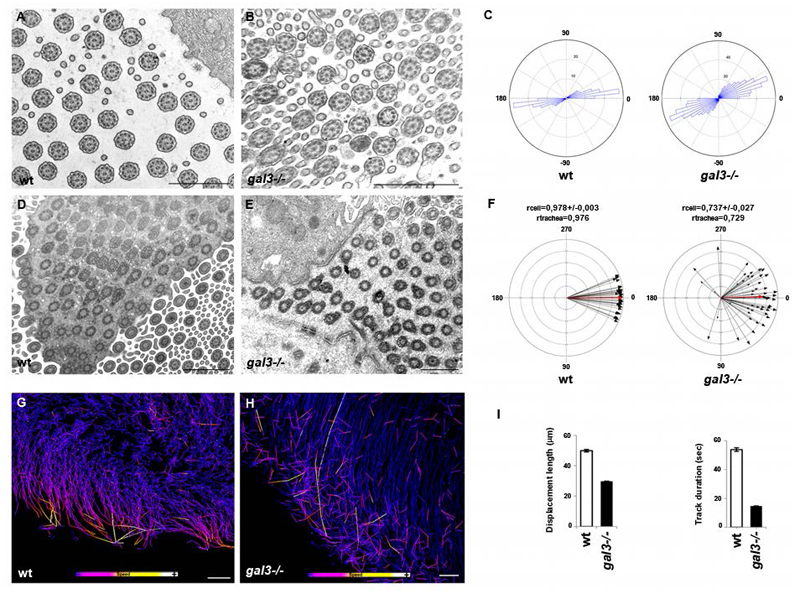
Figure 2
Cilium organization and flow directionality are lost in mouse gal3-/- ciliated cells.
TEM ultrastructural analysis of axonemal ( A and B ) andnBB ( D and E ) transversal sections in wt and gal3-/- mouse tracheas. Scale bars, A , B , D and E , 1u03bcm. C , statistical analyses of centra...
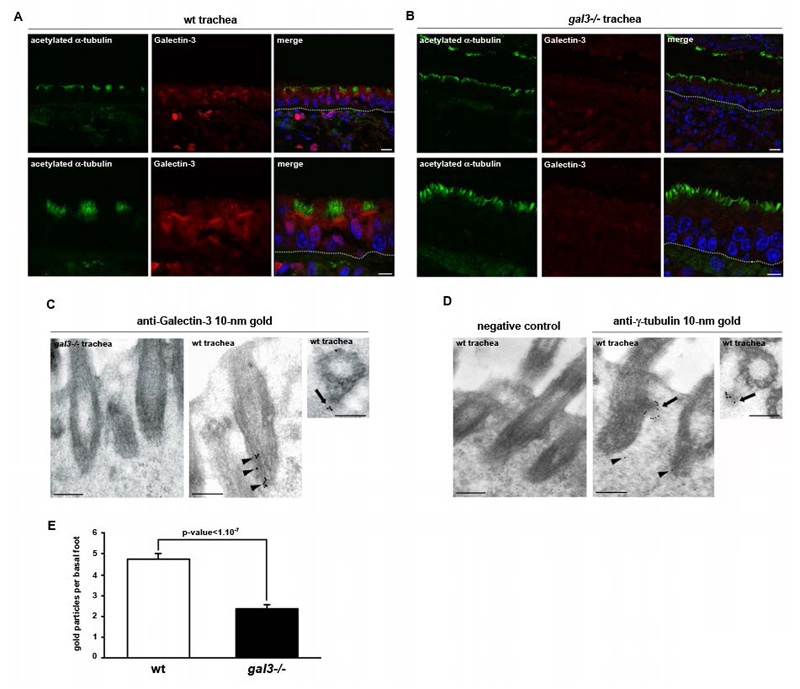
Figure 3
Galectin-3 is present at the basal foot cap and ciliary rootlet of motile cilium in tracheal epithelial cells.
A , confocal microscopy analysis of Galectin-3 distribution in mousentracheal cells. Longitudinal paraffin sections were immunostained withnmonoclonal anti-acetylated u03b1-tubulin (green) and polyclo...
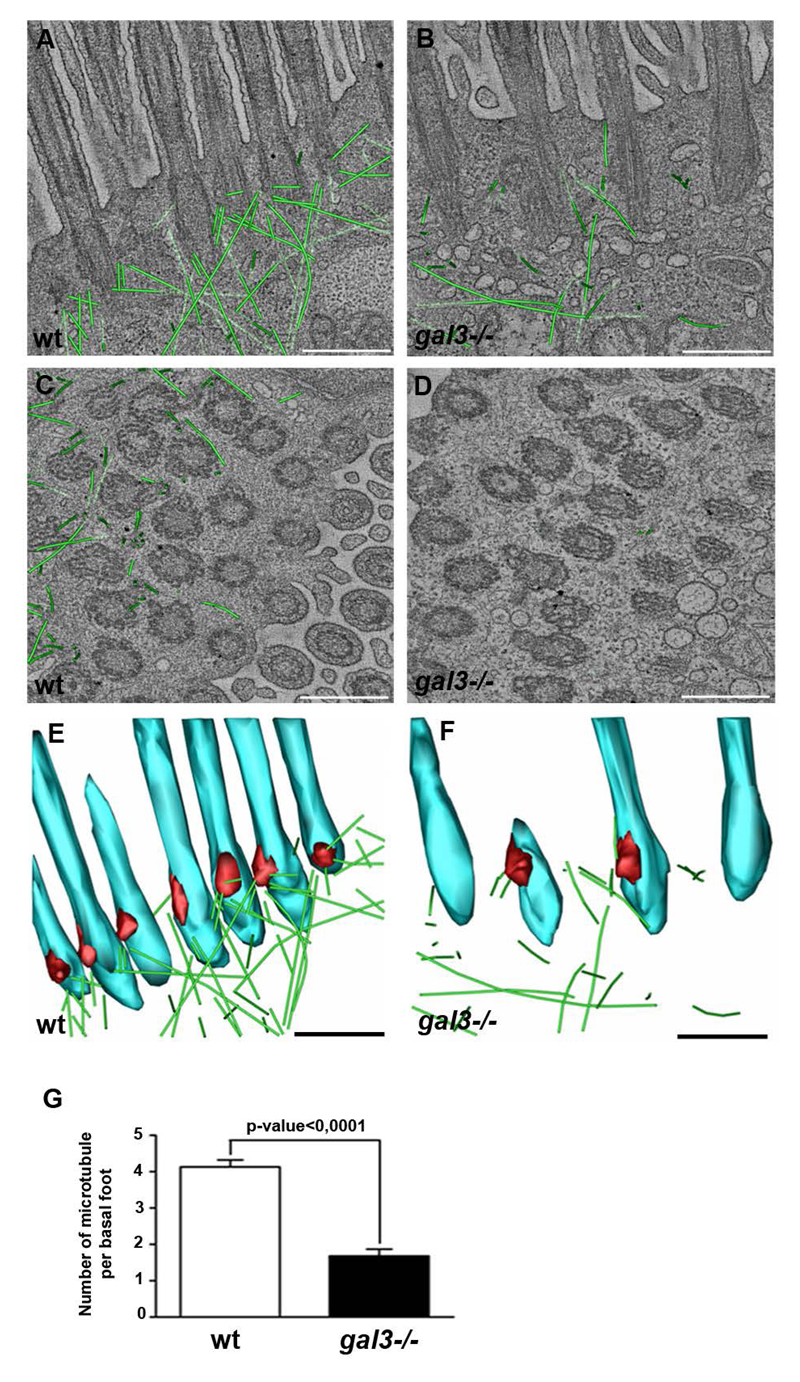
Figure 4
Association of MTs with basal feet is severely disrupted in gal3-/- mouse tracheas.
Representative EM tomographic slices, generated by averaging 5 z-sections of thenreconstructed filtered volume, of the cortical domain of wt ( A and C ) and gal3-/- ( B and D ) ciliated cells are pres...
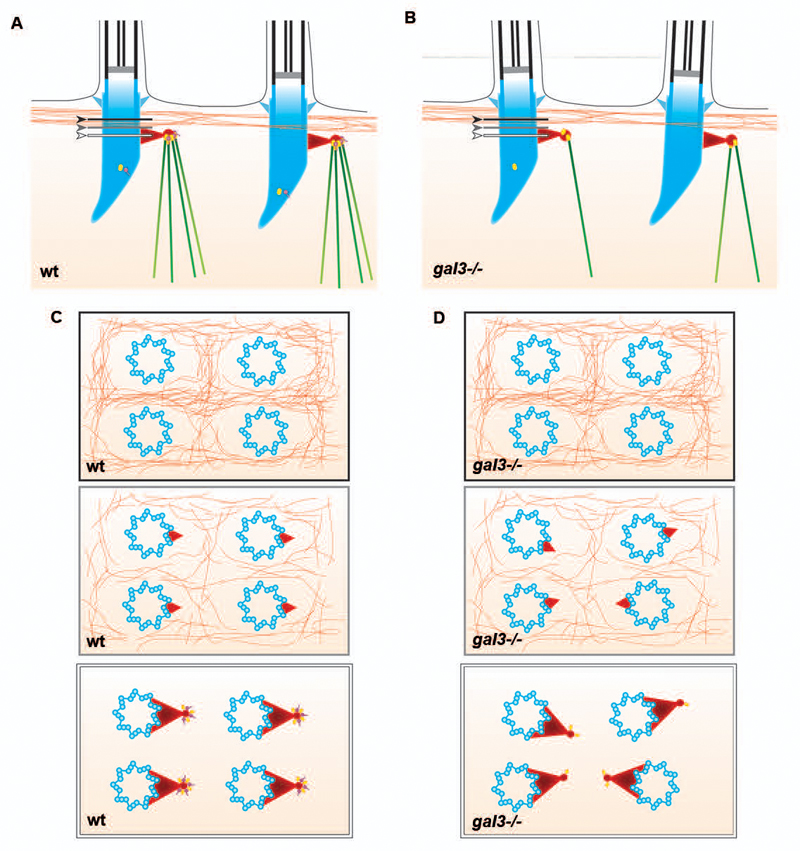
Figure 5
Schemes showing the predicted association of the MT network and the actin cytoskeleton with the basal bodies of motile cilia from the acquired tomograms in wt (A and C) and in gal3-/- (B and D) ciliated cells, in side (A and B) or top (C and D) views.
MTs (green), actin cables (orange), Galectin-3 (purple) and u03b3-tubulinn(yellow) are represented at the BBs (blue) and at the basal foot cap (red). Thenrelative position of the actin cytoskeleton to...
Figure images are served from the NIH/NLM PubMed Central Open Access Subset or Europe PMC; copyright remains with the publishers and authors.
💬 Discussion
0 commentsNo comments yet. Be the first to start a discussion!
Leave a Comment