Abstract
Abstract IP 3 receptors (IP 3 Rs) release Ca 2+ from the ER when they bind IP 3 and Ca 2+ . The spatial organization of IP 3 Rs determines both the propagation of Ca 2+ signals between IP 3 Rs and the selective regulation of cellular responses. Here we use gene editing to fluorescently tag endogenous IP 3 Rs, and super-resolution microscopy to determine the geography of IP 3 Rs and Ca 2+ signals within living cells. We show that native IP 3 Rs cluster within ER membranes. Most IP 3 R clusters are mobile, moved by diffusion and microtubule motors. Ca 2+ signals are generated by a small population of immobile IP 3 Rs. These IP 3 Rs are licensed to respond, but they do not readily mix with mobile IP 3 Rs. The licensed IP 3 Rs reside alongside ER-plasma membrane junctions where STIM1, which regulates store-operated Ca 2+ entry, accumulates after depletion of Ca 2+ stores. IP 3 Rs tethered close to ER-plasma membrane junctions are licensed to respond and optimally placed to be activated by endogenous IP 3 and to regulate Ca 2+ entry.
🔬 Techniques
🔭 Microscopes
💻 Software
✨ Fluorophores
🧪 Sample Preparation
🔬 Cell Lines
🏭 Microscope Brands
🧪 Reagent Suppliers
📷 Detectors
🎨 Filters
💻 Software Details
💾 Data Repositories
🏛️ Research Organizations (ROR)
Affiliated research institutions:
📋 Methods
Materials BAPTA was from Molekula. Cal-590 AM, Cal-520 AM and Fluo-8 AM were from AAT Bioquest. Ciliobrevin D, EGTA-AM, human fibronectin and nocodazole were from Merck Millipore. A membrane-permeant form of caged-IP 3 (ci-IP 3 /PM : d -2,3- O -isopropylidene-6- O -(2-nitro-4,5-dimethoxy)benzyl- myo -inositol 1,4,5-trisphosphate hexakis(propionoxymethyl) ester) was from SiChem. Mycalolide B was from Santa Cruz Biotechnology. Rapamycin was from Cell Guidance Systems. Histamine and carbachol were from Sigma-Aldrich. Bovine serum albumin (BSA) was from Europa Bio-Products. Sources of plasmids encoding the following proteins were: mCherry-EB3 (Addgene #55038); mCherry-C1 (Clontech #632524); GFP-ER memb (GFP targeted to ER membranes via the ER-targeting sequence of yeast UBC6 protein) 36 ; p50-mCherry (dominant-negative cytoplasmic dynein tagged with mCherry) 36 ; RFP-KHC-CT (dominant-negative kinesin-1 tagged with RFP) 36 ; pBa-KIF5C 559-tdTomato-FKBP (kinesin-1 tagged with tandem dimer Tomato and FKBP to allow dimerization with Lyn11-FRB-CFP via rapamycin) (Addgene #64211) 38 ; GFP-TPC2 58 ; mCherry-ER (Addgene #55041); Lyn11-FRB-CFP (PM-targeted FRB tagged with CFP to allow dimerization with FKBP via rapamycin) (Addgene #38003); LAMP1-mCherry 59 ; LAMP1-AcGFP 59 ; STIM1-mCherry 60 ; CFP-STIM1 (Addgene #18858); mCherry-tubulin (Addgene #26768); GFP-MAPPER 46 and Orai1-CFP (Addgene #19757). The mCherry-MAPPER construct was generated by amplifying mCherry from pmCherry-C1 (Clontech) by PCR using forward (CGCTAGCGCTACCGGTC) and reverse (AGACTAGTTGATCCGGACTTGTACAGCTCGTC) primers, digesting the resulting product with Age I/ Spe I and inserting the product into similarly digested GFP-MAPPER. For the mCherry-Orai1 construct, human Orai1 was amplified by PCR from hOrai1-pcDNA6 61 using forward (GGAGGGGGATCTATGCATCCGGAGCCCG) and reverse (AGCGGCCGCCACTGTGCTGGATATCTGCAGCTAGGCATAGTGGCTGCCG) primers, and mCherry was amplified from pmCherry-C1 (Clontech) using forward (CGTTTAAACTTAAGCTTGGTACCGAGCTCAAGCTTGCCACCATGGTGAGCAAGGGCGAG) and reverse (CGGGCTCCGGATGCATAGATCCCCCTCCCTTGTACAGCTCGTCCATGCC) primers. The resulting PCR products were introduced by Gibson assembly (Gibson Assembly Master Mix; New England Biolabs) into pcDNA3.1+ digested with Bam HI/ Eco RI. Primers used for sequencing and amplification were from ThermoFisher: forward mCherry (mCherry PF: ATGGTGAGCAAGGGCGAG); reverse itpr1 (P5R: GGGGCCTCACTACTCCTTTC); forward itpr1 (P2F: GGGTGACATGCGTACAGTTG); reverse itpr1 (P4R: GAACGTCACCGTTTTACTTGG); forward itpr3 (P13F: CTCCAAGCCTGAGCACTTTC); reverse itpr3 (P16R: CCCGATAGAGGCCTGGAC). The TALENs used are listed in Supplementary Fig. 1b . Antibodies (for Western blotting, WB; immunoprecipitation, IP) were from the following suppliers: β-actin (WB 1:1,000; Abcam, ab6276), dynein, mouse monoclonal (IP and WB 1:1,000, Abcam, ab23905); GFP (WB 1:1,000, ChromoTek, #3H9); GFP Tag-Alexa Fluor-647 (STORM 1:400, ThermoFisher, #31852); GFP-Trap, anti-GFP V H H coupled to magnetic beads (IP 100 µl per 200 µl lysate, ChromoTek, #gtm20); IP 3 R1 (rabbit, C-terminal peptide, WB 1:1,000) 62 ; IP 3 R2 (rabbit, C-terminal peptide GFLGSNTPHENHHMPPH, WB 1:1,000, Pocono Rabbit Farm and Laboratory); IP 3 R3 (WB 1:1,000, BD Transduction Laboratories, #610313); kinesin-1 (WB 1:1,000, IP 1:400, Abcam, ab62104); mCherry (WB 1:1,000, Abcam, ab167453); STIM1 (New England Biolabs, D88E10); RFP-Trap, anti-RFP V H H coupled to magnetic beads (IP 100 µl per 200 µl lysate, ChromoTek, #rtm10); donkey anti-rabbit IgG-HRP (WB 1:5,000, Santa Cruz, SC-2313); donkey anti-mouse IgG-HRP (WB 1:2,000, Santa Cruz, SC-2314); goat anti-rat IgG-HRP (WB 1:5,000, Santa Cruz, SC-2020); goat anti-rabbit Alexa Fluor-594 (ThermoFisher, A11012). Additional sources of materials are provided within the relevant methods.
Show full methods section
Materials BAPTA was from Molekula. Cal-590 AM, Cal-520 AM and Fluo-8 AM were from AAT Bioquest. Ciliobrevin D, EGTA-AM, human fibronectin and nocodazole were from Merck Millipore. A membrane-permeant form of caged-IP 3 (ci-IP 3 /PM : d -2,3- O -isopropylidene-6- O -(2-nitro-4,5-dimethoxy)benzyl- myo -inositol 1,4,5-trisphosphate hexakis(propionoxymethyl) ester) was from SiChem. Mycalolide B was from Santa Cruz Biotechnology. Rapamycin was from Cell Guidance Systems. Histamine and carbachol were from Sigma-Aldrich. Bovine serum albumin (BSA) was from Europa Bio-Products. Sources of plasmids encoding the following proteins were: mCherry-EB3 (Addgene #55038); mCherry-C1 (Clontech #632524); GFP-ER memb (GFP targeted to ER membranes via the ER-targeting sequence of yeast UBC6 protein) 36 ; p50-mCherry (dominant-negative cytoplasmic dynein tagged with mCherry) 36 ; RFP-KHC-CT (dominant-negative kinesin-1 tagged with RFP) 36 ; pBa-KIF5C 559-tdTomato-FKBP (kinesin-1 tagged with tandem dimer Tomato and FKBP to allow dimerization with Lyn11-FRB-CFP via rapamycin) (Addgene #64211) 38 ; GFP-TPC2 58 ; mCherry-ER (Addgene #55041); Lyn11-FRB-CFP (PM-targeted FRB tagged with CFP to allow dimerization with FKBP via rapamycin) (Addgene #38003); LAMP1-mCherry 59 ; LAMP1-AcGFP 59 ; STIM1-mCherry 60 ; CFP-STIM1 (Addgene #18858); mCherry-tubulin (Addgene #26768); GFP-MAPPER 46 and Orai1-CFP (Addgene #19757). The mCherry-MAPPER construct was generated by amplifying mCherry from pmCherry-C1 (Clontech) by PCR using forward (CGCTAGCGCTACCGGTC) and reverse (AGACTAGTTGATCCGGACTTGTACAGCTCGTC) primers, digesting the resulting product with Age I/ Spe I and inserting the product into similarly digested GFP-MAPPER. For the mCherry-Orai1 construct, human Orai1 was amplified by PCR from hOrai1-pcDNA6 61 using forward (GGAGGGGGATCTATGCATCCGGAGCCCG) and reverse (AGCGGCCGCCACTGTGCTGGATATCTGCAGCTAGGCATAGTGGCTGCCG) primers, and mCherry was amplified from pmCherry-C1 (Clontech) using forward (CGTTTAAACTTAAGCTTGGTACCGAGCTCAAGCTTGCCACCATGGTGAGCAAGGGCGAG) and reverse (CGGGCTCCGGATGCATAGATCCCCCTCCCTTGTACAGCTCGTCCATGCC) primers. The resulting PCR products were introduced by Gibson assembly (Gibson Assembly Master Mix; New England Biolabs) into pcDNA3.1+ digested with Bam HI/ Eco RI. Primers used for sequencing and amplification were from ThermoFisher: forward mCherry (mCherry PF: ATGGTGAGCAAGGGCGAG); reverse itpr1 (P5R: GGGGCCTCACTACTCCTTTC); forward itpr1 (P2F: GGGTGACATGCGTACAGTTG); reverse itpr1 (P4R: GAACGTCACCGTTTTACTTGG); forward itpr3 (P13F: CTCCAAGCCTGAGCACTTTC); reverse itpr3 (P16R: CCCGATAGAGGCCTGGAC). The TALENs used are listed in Supplementary Fig. 1b . Antibodies (for Western blotting, WB; immunoprecipitation, IP) were from the following suppliers: β-actin (WB 1:1,000; Abcam, ab6276), dynein, mouse monoclonal (IP and WB 1:1,000, Abcam, ab23905); GFP (WB 1:1,000, ChromoTek, #3H9); GFP Tag-Alexa Fluor-647 (STORM 1:400, ThermoFisher, #31852); GFP-Trap, anti-GFP V H H coupled to magnetic beads (IP 100 µl per 200 µl lysate, ChromoTek, #gtm20); IP 3 R1 (rabbit, C-terminal peptide, WB 1:1,000) 62 ; IP 3 R2 (rabbit, C-terminal peptide GFLGSNTPHENHHMPPH, WB 1:1,000, Pocono Rabbit Farm and Laboratory); IP 3 R3 (WB 1:1,000, BD Transduction Laboratories, #610313); kinesin-1 (WB 1:1,000, IP 1:400, Abcam, ab62104); mCherry (WB 1:1,000, Abcam, ab167453); STIM1 (New England Biolabs, D88E10); RFP-Trap, anti-RFP V H H coupled to magnetic beads (IP 100 µl per 200 µl lysate, ChromoTek, #rtm10); donkey anti-rabbit IgG-HRP (WB 1:5,000, Santa Cruz, SC-2313); donkey anti-mouse IgG-HRP (WB 1:2,000, Santa Cruz, SC-2314); goat anti-rat IgG-HRP (WB 1:5,000, Santa Cruz, SC-2020); goat anti-rabbit Alexa Fluor-594 (ThermoFisher, A11012). Additional sources of materials are provided within the relevant methods.
Cell culture and transient transfection
HEK293 and HeLa cells (both from ATCC) were cultured in Dulbecco’s modified Eagle’s medium/F-12 with GlutaMAX (ThermoFisher) supplemented with fetal bovine serum (FBS, 10%, Sigma). The cells were maintained at 37 °C in humidified air with 5% CO 2 , and passaged every 3–4 days using Gibco TrypLE Express (ThermoFisher). For imaging, cells were grown on 35-mm glass-bottomed dishes (#P35G-1.0-14-C, MatTek) coated with human fibronectin (10 µg ml −1 ). HeLa cells and EGFP-IP 3 R1 HeLa cells were transfected, according to the manufacturer’s instructions, using TransIT-LT1 (GeneFlow) and ViaFect (Promega) reagents, respectively (1 µg DNA per 2.5 µl reagent). Short tandem repeat profiling was used to authenticate HeLa cells (Eurofins, Germany) and HEK293 cells (Public Health England). Screening confirmed that all cells were free of mycoplasma infection. Gene editing of IP 3 R1 in HeLa cells The methods are summarized in Supplementary Fig. 1 . TALENs were designed to target the first coding exon (exon 3) of the human itpr1 gene at the 3p26.1 locus. A double-stranded donor DNA was synthesized (ThermoFisher) with homology regions for recombination with the itpr1 gene (~300 bp either side of the TALEN cleavage site, with Sal I and Xho I restriction sites at the 5′ and 3′ ends, respectively) flanking a sequence encoding EGFP mutated (A206K) to ensure the expressed protein was monomeric. The donor DNA was cloned into the pENTR1A-dual selection vector (ThermoFisher), excised from it with Sal I and Xho I, and purified to provide the donor DNA used for transfection. HeLa cells (75-cm 2 flask, ~60% confluence) were cotransfected with double-stranded donor DNA (9 μg) and the TALENs (6 μg of each) using TransIT-LT1. Cells were harvested after 48–72 h using trypsin, washed in phosphate-buffered saline (PBS: 1.06 mM KH 2 PO 4 , 155 mM NaCl, 3 mM Na 2 HPO 4 , pH 7.3) containing FBS (1%) and re-suspended (~10 7 cells ml −1 ) in sorting buffer (PBS with 1 mM EDTA, 25 mM HEPES, 1% FBS, pH 7.0). Cells were sorted by fluorescence-activated cell sorting (FACS, excitation 488 nm, emission 525 nm) using a modular flow multilaser sorter flow cytometer (DakoCytomation, Beckmann Coulter). Cells with the most intense EGFP fluorescence (top ~1%) were collected into growth medium containing penicillin (100 μg ml −1 ), streptomycin (100 µg ml −1 ), amphotericin B (0.25 µg ml −1 , all from ThermoFisher) and FBS (20%). Polyclonal cells were cultured in this medium for two passages, and then in normal growth medium without antibiotics. Two further rounds of FACS were used to enrich the EGFP-IP 3 R1-expressing cells, which were then sorted as single cells into 96-well plates and cultured in the antibiotic-containing medium to select monoclonal cell lines (Supplementary Fig. 1c ). Five monoclonal EGFP-IP 3 R1 HeLa cell lines were propagated, one of which was used for the work reported here. The sequences of the edited itpr1 locus of the five monoclonal EGFP-IP 3 R1 HeLa cell lines was determined by isolating genomic DNA using a Quick-gDNA MiniPrep kit (Zymo Research). The itpr1 locus of the genomic DNA was amplified by PCR using primers P2F and P4R, and the sequences were determined using the same primers. Sequencing confirmed the appropriate attachment of the EGFP sequence to IP 3 R1 (Supplementary Fig. 2a ). Karyotype analysis of G-banded metaphase spreads of EGFP-IP 3 R1 HeLa cells was performed by Cell Guidance Systems (Cambridge, UK) (Supplementary Fig. 2b ). Measurements of [Ca 2+ ] c in cell populations EGFP-IP 3 R1 HeLa cells were plated in clear-bottomed 96-well plates (Greiner Bio-One) coated with fibronectin (10 µg ml −1 ). Cells were transfected with siRNA directed against GFP (50 nM, #AM4626, ThermoFisher) or a nonsilencing control siRNA (50 nM, #AM4611, ThermoFisher) using siPORT NeoFX transfection reagent (ThermoFisher, 220 ng siRNA per µl reagent). After 72 h, cells were washed with HEPES-buffered saline (HBS: 135 mM NaCl, 5.9 mM KCl, 1.2 mM MgCl 2 , 1.5 mM CaCl 2 , 11.6 mM HEPES, 11.5 mM glucose; pH 7.3), loaded with Fluo-8 by incubation in HBS with Fluo-8 AM (2 µM, 60 min, 20 °C), washed and incubated in HBS (60 min, 20 °C) before experiments. A FlexStation 3 microplate reader (Molecular Devices) was used to measure Fluo-8 fluorescence at 20 °C. After addition of BAPTA in Ca 2+ -free HBS (final BAPTA and CaCl 2 concentrations = 2.5 and 0.75 mM, respectively; free [Ca 2+ ]40 nm between successive frames (100 ms) to be mobile because in fixed cells, we detected a mean displacement of particles between frames of 40 nm. TraJClassifier (Fiji plugin), which has been extensively validated using computational models and experimental data 74 , was used to classify the mobility of single-particle trajectories (Fig. 5g and Supplementary Fig. 10 ). This algorithm uses a random forest ensemble learning approach to classify trajectories into diffusive, sub-diffusive, confined and directed trajectories. When a particle changes its behaviour during the recording, TraJClassifier splits its trajectory into sub-trajectories. Only 133 of the 4,492 trajectories analysed were split into sub-trajectories. Hence, only 3% of puncta changed their form of motion during the >3 s recording. A minimum trajectory of 30 frames (3 s) was used for analysis to minimize the problems associated with analysis of very short trajectories 35 . We note that this automated algorithm does not separate immobile puncta from those (sub-diffusive) that move more slowly than diffusing puncta. Single-step photobleaching analysis Time-lapse TIRFM images were captured while alternating (50 ms each) between wide-field (to accelerate bleaching) and TIRF illumination. The TIRFM images were then used for analysis of single-step photobleaching of EGFP-IP 3 R1. We attempted automated stepwise photobleaching analysis using the Progressive Idealization and Filtering (PIF) algorithm 75 , but this systematically underestimated the number of bleaching events in the brightest puncta (not shown). We therefore performed manual analysis of photobleaching on randomly selected puncta using Fiji Time Series Analyser, v.2.0. The number of bleaching steps was computed from the initial fluorescence intensity of each punctum and the amplitude of the final bleaching step (Fig. 1e ). We confirmed that neither fixation nor selection of particles in which the final bleaching step could be resolved affected the distribution of fluorescence intensities of the puncta (Supplementary Fig. 5 ). Analysis of IP 3 Rs at ER-PM junctions EGFP-IP 3 R1 HeLa cells transfected with plasmid encoding STIM1-mCherry were used 24 h after transfection. TIRFM images (EGFP, 488 nm; mCherry, 561 nm) were acquired (6 frames min −1 , 15 min) before and after addition of thapsigargin (1 µM) in HBS. After correction for background fluorescence (MetaMorph), immobile IP 3 R puncta were identified (see FRAP section). The intensity of STIM1-mCherry was calculated (Fiji Time Series Analyser, v.2.0) 76 before and after thapsigargin treatment for circular ROIs centred on mobile or immobile IP 3 R puncta and with twice the radius (2 r ) of the IP 3 R puncta ( r = 0.32–0.48 µm). For visualizing histamine-evoked STIM1 puncta, EGFP-IP 3 R1 HeLa cells were transfected with plasmid encoding CFP-STIM1, and TIRFM images (CFP, 425 nm; EGFP, 488 nm) were acquired 24 h after transfection. We confirmed, using four-colour beads (TetraSpeck microspheres, 0.1 µm), that chromatic aberration did not contribute to the non-overlapping localization of EGFP-IP 3 R1 and STIM1-mCherry, immunostained STIM1 or CFP-STIM1. Numbers of STIM1 puncta were calculated using Fiji TrackMate.
Statistics
Most results are presented as mean ± SEM from n independent analyses.
Statistical comparisons used paired or unpaired
Student’s t -tests, or analysis of variance with the Bonferroni correction used for multiple comparisons. Significance levels are shown as * P < 0.05, ** P < 0.01, *** P < 0.001 and **** P < 0.0001.
Data availability
The authors declare that all data supporting the findings reported are presented within the article and associated Supplementary Information files. The data and materials are available on request from the corresponding authors.
Materials BAPTA was from Molekula. Cal-590 AM, Cal-520 AM and Fluo-8 AM were from AAT Bioquest. Ciliobrevin D, EGTA-AM, human fibronectin and nocodazole were from Merck Millipore. A membrane-permeant form of caged-IP 3 (ci-IP 3 /PM : d -2,3- O -isopropylidene-6- O -(2-nitro-4,5-dimethoxy)benzyl- myo -inositol 1,4,5-trisphosphate hexakis(propionoxymethyl) ester) was from SiChem. Mycalolide B was from Santa Cruz Biotechnology. Rapamycin was from Cell Guidance Systems. Histamine and carbachol were from Sigma-Aldrich. Bovine serum albumin (BSA) was from Europa Bio-Products. Sources of plasmids encoding the following proteins were: mCherry-EB3 (Addgene #55038); mCherry-C1 (Clontech #632524); GFP-ER memb (GFP targeted to ER membranes via the ER-targeting sequence of yeast UBC6 protein) 36 ; p50-mCherry (dominant-negative cytoplasmic dynein tagged with mCherry) 36 ; RFP-KHC-CT (dominant-negative kinesin-1 tagged with RFP) 36 ; pBa-KIF5C 559-tdTomato-FKBP (kinesin-1 tagged with tandem dimer Tomato and FKBP to allow dimerization with Lyn11-FRB-CFP via rapamycin) (Addgene #64211) 38 ; GFP-TPC2 58 ; mCherry-ER (Addgene #55041); Lyn11-FRB-CFP (PM-targeted FRB tagged with CFP to allow dimerization with FKBP via rapamycin) (Addgene #38003); LAMP1-mCherry 59 ; LAMP1-AcGFP 59 ; STIM1-mCherry 60 ; CFP-STIM1 (Addgene #18858); mCherry-tubulin (Addgene #26768); GFP-MAPPER 46 and Orai1-CFP (Addgene #19757). The mCherry-MAPPER construct was generated by amplifying mCherry from pmCherry-C1 (Clontech) by PCR using forward (CGCTAGCGCTACCGGTC) and reverse (AGACTAGTTGATCCGGACTTGTACAGCTCGTC) primers, digesting the resulting product with Age I/ Spe I and inserting the product into similarly digested GFP-MAPPER. For the mCherry-Orai1 construct, human Orai1 was amplified by PCR from hOrai1-pcDNA6 61 using forward (GGAGGGGGATCTATGCATCCGGAGCCCG) and reverse (AGCGGCCGCCACTGTGCTGGATATCTGCAGCTAGGCATAGTGGCTGCCG) primers, and mCherry was amplified from pmCherry-C1 (Clontech) using forward (CGTTTAAACTTAAGCTTGGTACCGAGCTCAAGCTTGCCACCATGGTGAGCAAGGGCGAG) and reverse (CGGGCTCCGGATGCATAGATCCCCCTCCCTTGTACAGCTCGTCCATGCC) primers. The resulting PCR products were introduced by Gibson assembly (Gibson Assembly Master Mix; New England Biolabs) into pcDNA3.1+ digested with Bam HI/ Eco RI. Primers used for sequencing and amplification were from ThermoFisher: forward mCherry (mCherry PF: ATGGTGAGCAAGGGCGAG); reverse itpr1 (P5R: GGGGCCTCACTACTCCTTTC); forward itpr1 (P2F: GGGTGACATGCGTACAGTTG); reverse itpr1 (P4R: GAACGTCACCGTTTTACTTGG); forward itpr3 (P13F: CTCCAAGCCTGAGCACTTTC); reverse itpr3 (P16R: CCCGATAGAGGCCTGGAC). The TALENs used are listed in Supplementary Fig. 1b . Antibodies (for Western blotting, WB; immunoprecipitation, IP) were from the following suppliers: β-actin (WB 1:1,000; Abcam, ab6276), dynein, mouse monoclonal (IP and WB 1:1,000, Abcam, ab23905); GFP (WB 1:1,000, ChromoTek, #3H9); GFP Tag-Alexa Fluor-647 (STORM 1:400, ThermoFisher, #31852); GFP-Trap, anti-GFP V H H coupled to magnetic beads (IP 100 µl per 200 µl lysate, ChromoTek, #gtm20); IP 3 R1 (rabbit, C-terminal peptide, WB 1:1,000) 62 ; IP 3 R2 (rabbit, C-terminal peptide GFLGSNTPHENHHMPPH, WB 1:1,000, Pocono Rabbit Farm and Laboratory); IP 3 R3 (WB 1:1,000, BD Transduction Laboratories, #610313); kinesin-1 (WB 1:1,000, IP 1:400, Abcam, ab62104); mCherry (WB 1:1,000, Abcam, ab167453); STIM1 (New England Biolabs, D88E10); RFP-Trap, anti-RFP V H H coupled to magnetic beads (IP 100 µl per 200 µl lysate, ChromoTek, #rtm10); donkey anti-rabbit IgG-HRP (WB 1:5,000, Santa Cruz, SC-2313); donkey anti-mouse IgG-HRP (WB 1:2,000, Santa Cruz, SC-2314); goat anti-rat IgG-HRP (WB 1:5,000, Santa Cruz, SC-2020); goat anti-rabbit Alexa Fluor-594 (ThermoFisher, A11012). Additional sources of materials are provided within the relevant methods.
Electronic supplementary material Supplementary Information Descriptions of Additional Supplementary Files Peer Review File Supplementary Movie 1 Supplementary Movie 2 Supplementary Movie 3 Supplementary Movie 4 Supplementary Movie 5 Supplementary Movie 6 Supplementary Movie 7 Supplementary Movie 8 Supplementary Movie 9
📊 Figures
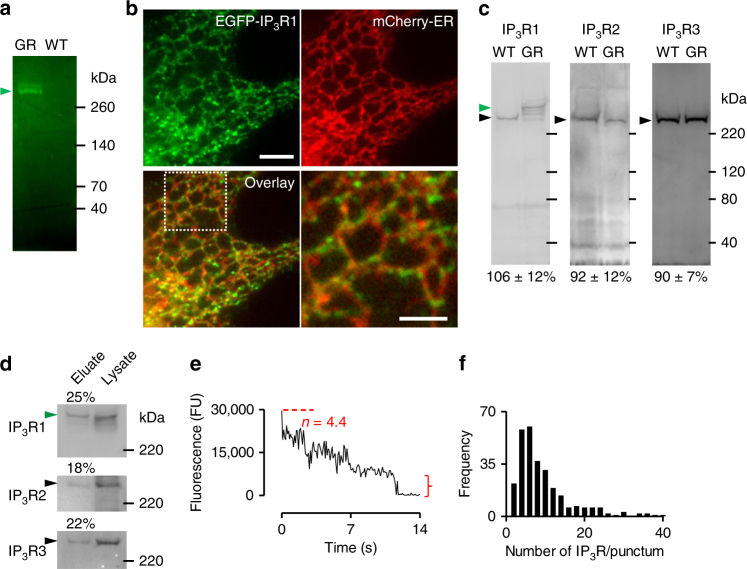
Fig. 1
Endogenous IP 3 R1s form puncta. a In-gel fluorescence of lysates from EGFP-IP 3 R1 HeLa cells (GR) and control (WT) cells demonstrates that the only fluorescence is associated with EGFP-IP 3 R1 (gree...
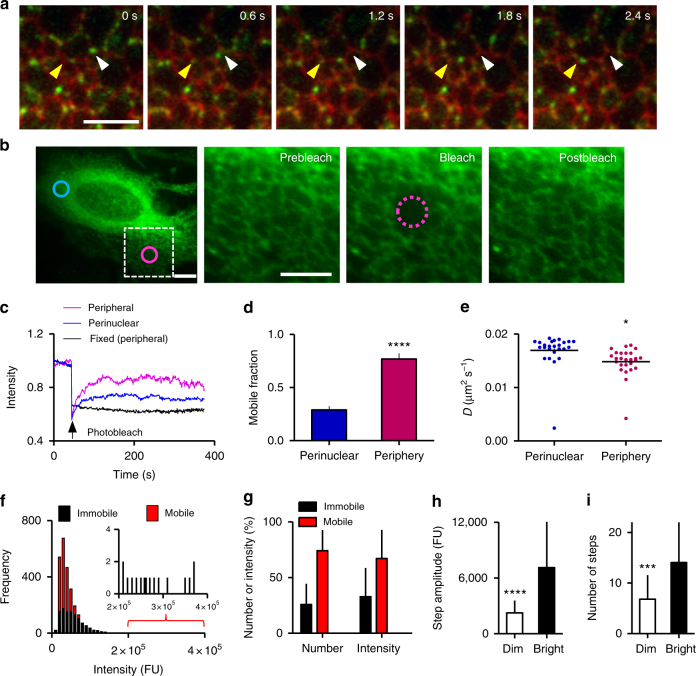
Fig. 2
IP 3 Rs form mobile and immobile puncta. a Time-lapse TIRFM images (0.6-s intervals) of EGFP-IP 3 R1 in cells expressing mCherry-ER. Track of a single particle, with the first and last positions shown...
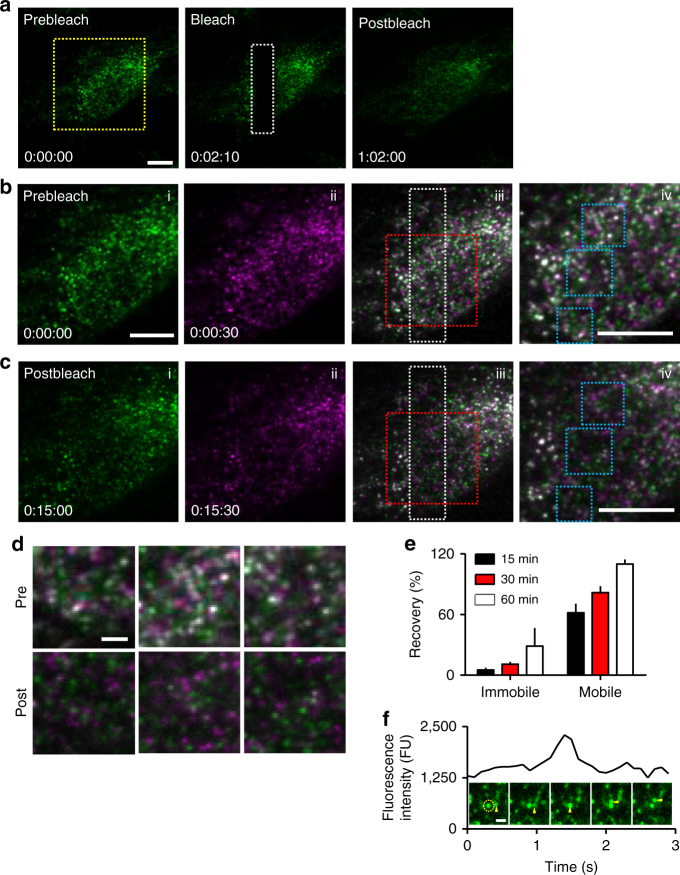
Fig. 3
IP 3 Rs within mobile puncta do not exchange with immobile puncta. a TIRFM images of FRAP experiment show images before, immediately after and 60u2009min after bleaching. Bleached area shown by white ...
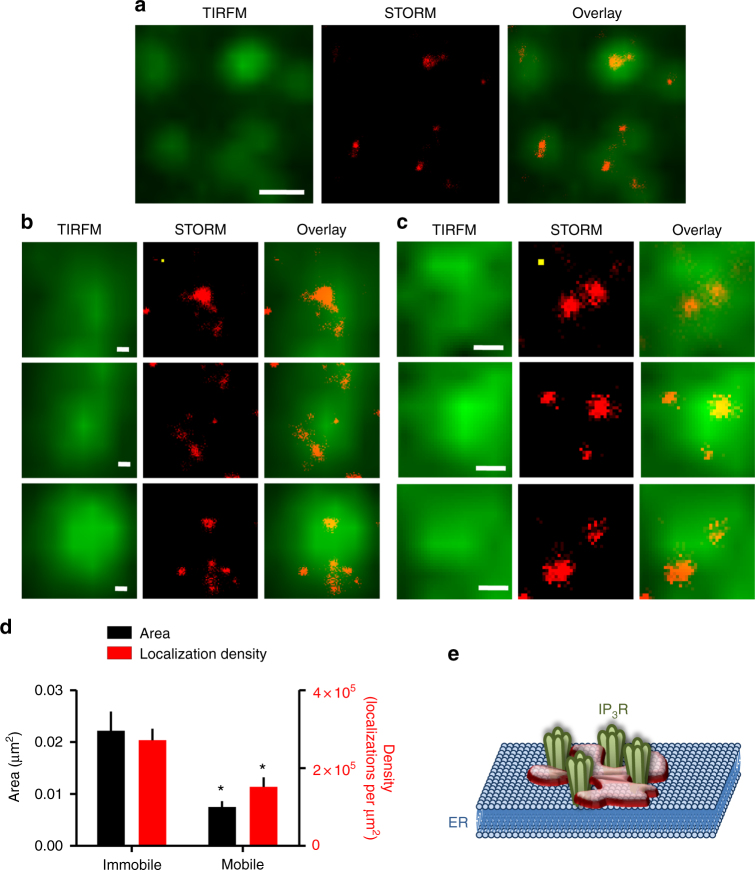
Fig. 4
EGFP-IP 3 Rs are diffusely distributed within puncta. a Examples of TIRFM and subsequent STORM images of EGFP-IP 3 R1 puncta. Scale baru2009=u20090.5u2009u00b5m. b , c Before STORM, mobile and immobil...
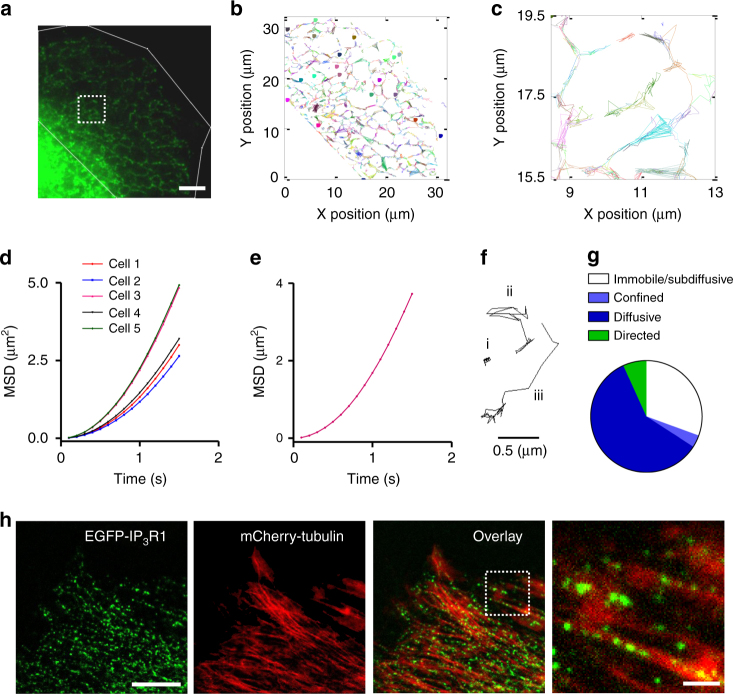
Fig. 5
IP 3 Rs move by diffusion and by directed motion along microtubules. a TIRFM image used for single-particle tracking shows characteristic reticular ER. Scale baru2009=u20095u2009u00b5m. b Trajectories...
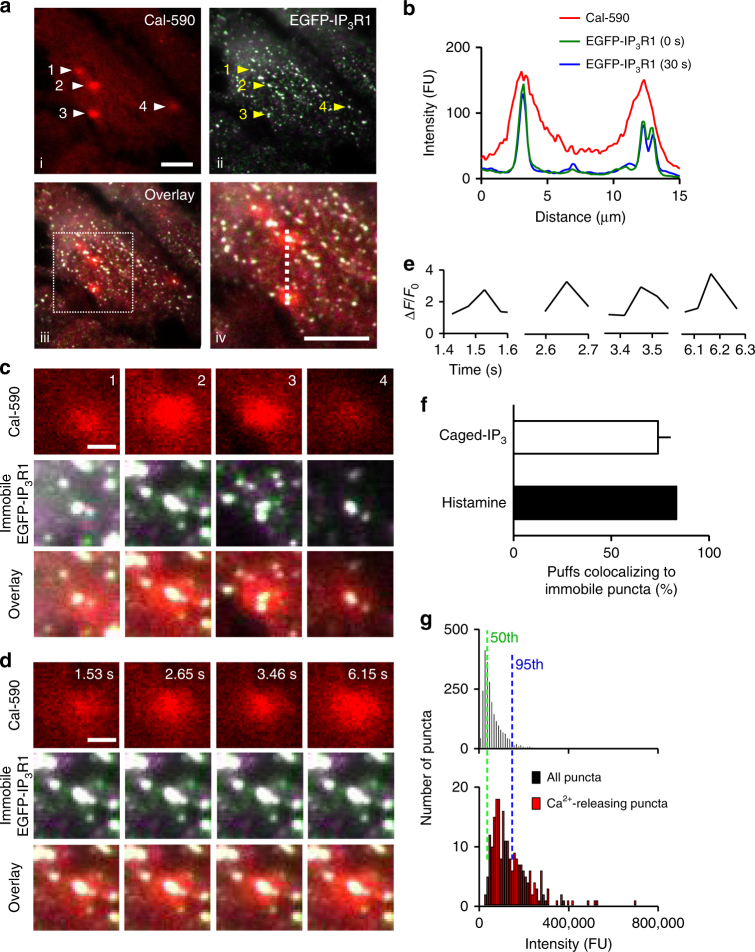
Fig. 6
Ca 2+ puffs evoked by photolysis of caged-IP 3 occur at immobile IP 3 Rs. a TIRFM image of a single cell loaded with EGTA and Cal-590 shows immobile IP 3 Rs (white, see Supplementary Fig. 7 ) and Ca 2...
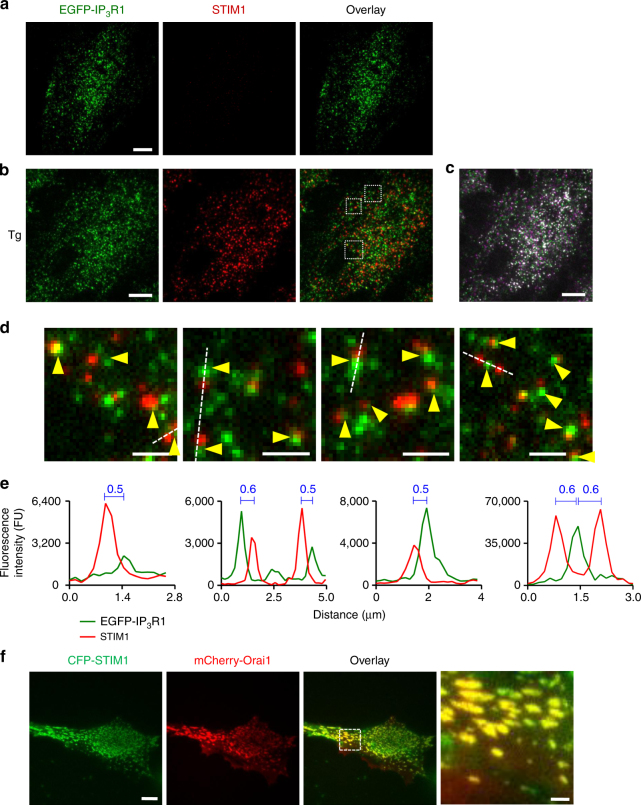
Fig. 7
Depletion of ER Ca 2+ stores causes native STIM1 to accumulate at functional ER-PM junctions adjacent to immobile IP 3 R puncta. a , b Representative TIRFM images of EGFP-IP 3 R1 HeLa cells fixed and ...
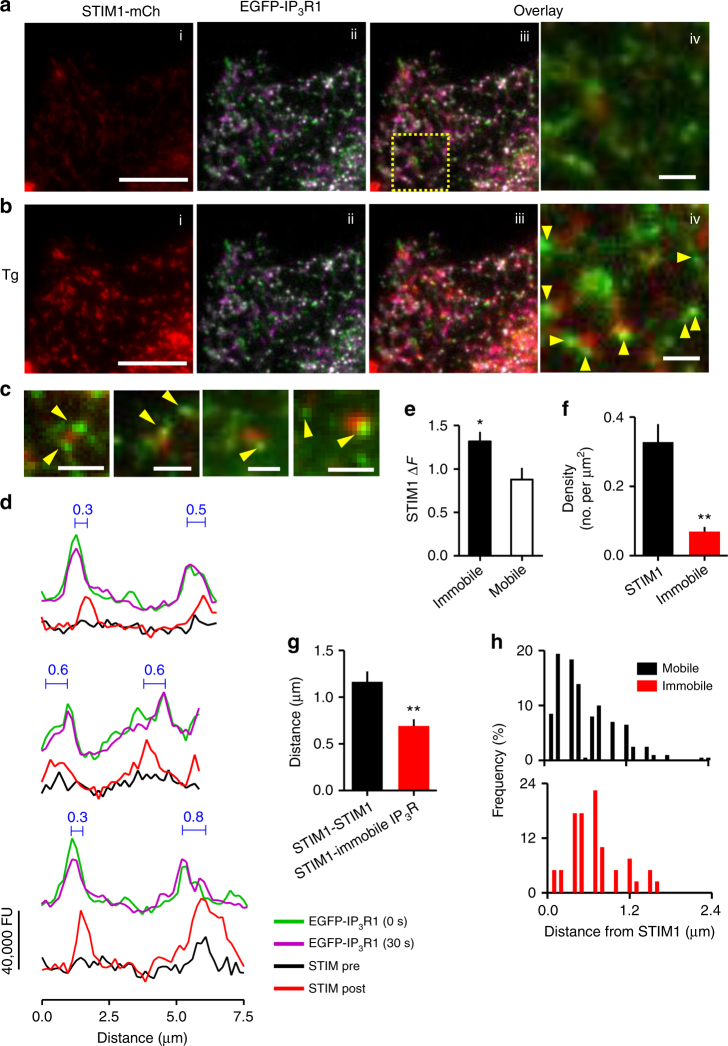
Fig. 8
STIM1 translocates to ER-PM junctions adjacent to immobile IP 3 R puncta. a , b TIRFM images show that thapsigargin (Tg, 1u2009u00b5M, 5u2009min) causes formation of STIM1-mCherry puncta at ER-PM junc...
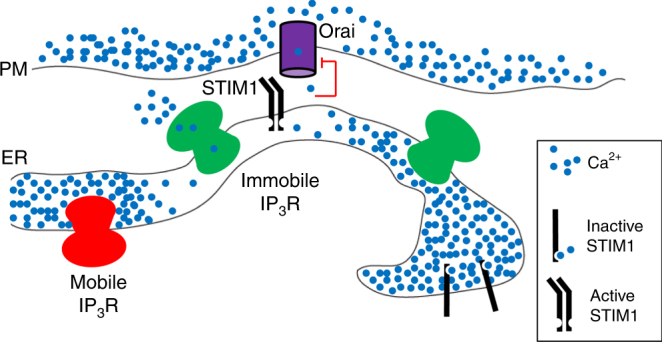
Fig. 9
Ca 2+ signals evoked by SOCE occur alongside immobile IP 3 Rs. Clustered IP 3 Rs evoke Ca 2+ puffs when they bind IP 3 and then respond to Ca 2+ released by a neighbouring IP 3 R. Only a small fractio...
Figure images are served from the NIH/NLM PubMed Central Open Access Subset or Europe PMC; copyright remains with the publishers and authors.
💬 Discussion
0 commentsNo comments yet. Be the first to start a discussion!
Leave a Comment