Abstract
Chlamydiae are obligate intracellular bacterial pathogens that replicate within a specialized membrane-bound compartment, termed an 'inclusion'. The inclusion membrane is a critical host-pathogen interface, yet the extent of its interaction with cellular organelles and the origin of this membrane remain poorly defined. Here we show that the host endoplasmic reticulum (ER) is specifically recruited to the inclusion, and that key rough ER (rER) proteins are enriched on and translocated into the inclusion. rER recruitment is a Chlamydia-orchestrated process that occurs independently of host trafficking. Generation of infectious progeny requires an intact ER, since ER vacuolation early during infection stalls inclusion development, whereas disruption post ER recruitment bursts the inclusion. Electron tomography and immunolabelling of Chlamydia-infected cells reveal 'pathogen synapses' at which ordered arrays of chlamydial type III secretion complexes connect to the inclusion membrane only at rER contact sites. Our data show a supramolecular assembly involved in pathogen hijack of a key host organelle.
🔬 Techniques
🔭 Microscopes
✨ Fluorophores
🧪 Sample Preparation
🔬 Cell Lines
🏭 Microscope Brands
🧪 Reagent Suppliers
📷 Detectors
🎨 Filters
💻 Software Details
🏛️ Research Organizations (ROR)
Affiliated research institutions:
📋 Methods
Cells, bacterial strains and reagents Cell lines (HeLa and RL-95.2) were routinely cultured as recommended by American Type Culture Collection, in 75 cm 2 tissue culture flasks, 24-well plates or in Lab-Tek (Nunc) chamber slides, as appropriate. C. trachomatis serovar LGV2 and D and C. muridarum were initially provided by Dr Philippe Verbeke (Institut Jacques Monod, Universite Paris 7-Diderot, France). Bacteria were routinely propagated in HeLa cells as previously described and stored at −80°C in sucrose–phosphate–glucose (SPG) medium for later use ( 38 ).
Bacterial inclusion-forming units
(IFU) were determined as described ( 38 ). Culture media (DMEM and HAM's F12), foetal calf serum and gentamycin were purchased from Invitrogen. Brefeldin A (BFA), nocodazole (NZ), chloramphenicol (CHP), ionomycin and valinomycin were from Sigma-Aldrich. Turbofect was from Fermentas. Pro-aerolysin was a generous gift from Professor Gisou van der Goot (Ecole Polytechnique Fédérale de Lausannes, Switzerland). ER blue-white live probe, Mitotracker Orange, WGA-Alexa 594 and Texas Red-conjugated phalloidin were from Invitrogen. Primary antibodies against Chlamydia were from Argene, anti-calreticulin, -CERT, -PDI, -RER1, -Derlin-1 were from Sigma, anti-giantin and-HA from Covance and secondary antibodies coupled to different AlexaFluor dyes were from Invitrogen. Goat anti-rabbit secondary coupled to 10 nm gold bead was from British Biocell International. Expression plasmids encoding Rtn4b-HA and DP1-HA were a generous gift from Professor Tom Rapoport (Harvard University, Boston, USA). Infection of cultured cells with Chlamydia Cells were seeded at 70% confluence and infected 24 h later by diluting bacterial stock in medium containing gentamycin (infection medium) to give 0.9–1 IFU. Cells were centrifuged (160 × g , 10 min, room temperature) to synchronize the infection, and incubated (80 min, 37°C, 5% CO 2 ). The infection medium is then exchanged and cells incubated further until fixation or are prepared for titration. Infection of transiently transfected cells with Chlamydia Cells were seeded at 50% confluence and transfected 24 h later using 50 μL of DMEM containing 0.7 μL Turbofect and 150 ng of plasmid DNA per 500 μL of infection medium. The transfection mixture was initially incubated (15 min, room temperature), then mixed with infection medium and subsequently added to cultured cells. Cells are recovered (24 h, 37°C, 5% CO 2 ) and infection performed as previously described.
Show full methods section
Cells, bacterial strains and reagents Cell lines (HeLa and RL-95.2) were routinely cultured as recommended by American Type Culture Collection, in 75 cm 2 tissue culture flasks, 24-well plates or in Lab-Tek (Nunc) chamber slides, as appropriate. C. trachomatis serovar LGV2 and D and C. muridarum were initially provided by Dr Philippe Verbeke (Institut Jacques Monod, Universite Paris 7-Diderot, France). Bacteria were routinely propagated in HeLa cells as previously described and stored at −80°C in sucrose–phosphate–glucose (SPG) medium for later use ( 38 ).
Bacterial inclusion-forming units
(IFU) were determined as described ( 38 ). Culture media (DMEM and HAM's F12), foetal calf serum and gentamycin were purchased from Invitrogen. Brefeldin A (BFA), nocodazole (NZ), chloramphenicol (CHP), ionomycin and valinomycin were from Sigma-Aldrich. Turbofect was from Fermentas. Pro-aerolysin was a generous gift from Professor Gisou van der Goot (Ecole Polytechnique Fédérale de Lausannes, Switzerland). ER blue-white live probe, Mitotracker Orange, WGA-Alexa 594 and Texas Red-conjugated phalloidin were from Invitrogen. Primary antibodies against Chlamydia were from Argene, anti-calreticulin, -CERT, -PDI, -RER1, -Derlin-1 were from Sigma, anti-giantin and-HA from Covance and secondary antibodies coupled to different AlexaFluor dyes were from Invitrogen. Goat anti-rabbit secondary coupled to 10 nm gold bead was from British Biocell International. Expression plasmids encoding Rtn4b-HA and DP1-HA were a generous gift from Professor Tom Rapoport (Harvard University, Boston, USA). Infection of cultured cells with Chlamydia Cells were seeded at 70% confluence and infected 24 h later by diluting bacterial stock in medium containing gentamycin (infection medium) to give 0.9–1 IFU. Cells were centrifuged (160 × g , 10 min, room temperature) to synchronize the infection, and incubated (80 min, 37°C, 5% CO 2 ). The infection medium is then exchanged and cells incubated further until fixation or are prepared for titration. Infection of transiently transfected cells with Chlamydia Cells were seeded at 50% confluence and transfected 24 h later using 50 μL of DMEM containing 0.7 μL Turbofect and 150 ng of plasmid DNA per 500 μL of infection medium. The transfection mixture was initially incubated (15 min, room temperature), then mixed with infection medium and subsequently added to cultured cells. Cells are recovered (24 h, 37°C, 5% CO 2 ) and infection performed as previously described.
Labelling of infected cells with Mitotracker Orange
Cultured cells were infected as previously described ( 38 ). At the desired point 50 n m of Mitotracker Orange was diluted into the culture medium and cells incubated (45 min, 37°C, 5% CO 2 ). Cells were fixed with DMEM containing 4% (w/v) buffered paraformaldehyde (30 min, 37°C, 5% CO 2 ). Cells were stained for Chlamydia as described. Live ER imaging ER-Tracker Blue-White DPX probe HeLa cells were seeded into Lab-Tek chambers and infected with C. trachomatis LGV2 as described; 24 hpi Lab-Tek were transferred onto the microscope stage (Leica DMI 6000), and ER-Tracker Blue-White DPX probe added to the media to a final concentration of 830 n m , and the samples imaged using a filter cube with excitation 340–380 nm, dichroic 400 nm and emission LP 405. An image was captured every 5 seconds for 15 min. Grey levels of inclusions (I), nuclei (N), cytosol (ER) and areas where no cells are present (background) were determined. An intensity ratio was calculated from these values for each time point according to the following formula: (grey level ER/I − mean grey level background )/(grey level N − mean grey level background ). This ratio accounts for photobleaching, variation in probe uptake between cells and intracellular auto-fluorescence. Ratios were determined for each infected cell and the average and standard deviation (shading) calculated. DsRed-ER HeLa cells were transiently transfected with pcDNA-DsRed-ER, a plasmid encoding DsRed fused to the ER-targeting sequencing of calreticulin at the 3′ end and the ER retention signal (KDEL) at the 5′ end, and infected as previously described; 24 hpi Lab-Tek were transferred onto the microscope stage and inserted into a pre-warmed environmental chamber (Olympus TIRF). A multi-positioning (four positions), z-stack (0.5 µm section depth), time-lapse (every 30 min) experiment was performed for 12 h and images collected using the 60× objective (laser excitation 559 nm, collecting emission 580–700 nm). Data were processed with ImageJ software and a movie frames assembled from maximum intensity projections of confocal stacks at each time point. Treatment of infected cells with chemicals and aerolysin Cells were infected as described previously ( 38 ). At appropriate time points (12 or 24 hpi) cells were treated by addition of pro-aerolysin (0.5 n m ), valinomycin (2 μ m ) or ionomycin (2 μ m ) for 30 min. After 6 h, cells were fixed or samples collected for subsequent titration assays. For drug and antibiotic treatments, agents were added at appropriate time points and concentrations: CHX (12 hpi, 1 or 5 μ m ), CHP (12 hpi, 5 or 15 μ m ), NZ (14 hpi, 10 or 20 ng/mL) and BFA (14 hpi, 10 or 20 µg/mL). Cells were fixed at 24 hpi with medium containing 4% (w/v) buffered paraformaldehyde.
Titration assay
At the time point of interest and after appropriate treatments when necessary, cell layers and supernatants from infected cells were collected in SPG and samples stored at −80°C. HeLa cells were plated at 70% confluence on coverslips. After 24 h, previously collected samples were diluted in infection media and used to infect cells as described. At 24 hpi, cells were fixed as described. Coverslips were immunolabelled using anti- Chlamydia antibodies as described, and Hoechst. Coverslips were observed using a fluorescent microscope (Zeiss, Axioskop plus, DAPI cube – Excitation G365/Dichoric FT 395/Emission LP 420, FITC – Zeiss filter set 10 – Excitation BP450–490/ Dichoric FT510/ Emission BP 515–565). Random fields of view were scored to quantify inclusion-forming units per mL (IFU/mL). An average of 400 cells were counted per condition.
Fluorescence microscopy
For anti-calreticulin, anti-PDI and anti-HA staining, cells were fixed with 4% (w/v) buffered paraformaldehyde in PBS (30 min), and quenched with the same volume of 50 m m NH 4 Cl in PBS. For anti-derlin1, anti-RER1 and anti-giantin staining, cells were fixed with cold methanol (3 min, on ice), before washing with PBS. Cells were permeabilized with methanol/ethanol (5 min, on ice), and non-specific binding blocked by incubation (30 min) with 1% (w/v) BSA in PBS prior to labelling with antibodies diluted appropriately in this blocking buffer. Primary antibodies were incubated (2 h, room temperature or overnight, 4°C), depending on the antibody. Secondary antibodies were incubated (1 h 30 min, room temperature) or for anti- Chlamydia conjugated to FITC (1 h, room temperature). When required, Hoechst staining was performed (15 min, room temperature). Alternatively, Texas Red-conjugated phalloidin was used to stain F-actin (30 min, room temperature) after permeabilization, and WGA-Alexa 594 was added prior to permeabilization (15 min, room temperature). Coverslips were mounted on MoWiol.
Confocal microscopy
Coverslips were observed using a confocal microscope (TCS Sp5 AOBS; Leica). For FITC and Alexa 488, laser at 488 nm was used and emission collected from 498 to 548 nm, for Alexa 546, laser at 543 nm was selected and emission was collected from 555 to 633 nm, for Alexa 594, laser at 594 nm was selected and emission was collected from 605 to 751 nm and for Alexa 633, laser at 633 nm was used and emission collected from 660 to 746 nm. When Hoechst labelling was performed, a Leica spE AOBS inverted microscope was used. Hoechst was excited at 405 nm, and emission was collected from 388 to 517 nm; Alexa 488 was exited at 488 nm and emission was collected from 493 to 619 nm. Each channel was acquired sequentially. Every experiment was performed, acquired and analysed similarly and each duplicate experiment repeated three times.
Analysis of confocal images
Calreticulin recruitment was analysed using automated quantification in ImageJ ( 39 ). Segmentation of the compartment of interest was achieved by applying grey level thresholding on wavelet-transformed images. B-Spline wavelets ‘à trous’ were used for convolution. A mask was created with the ‘Fill Holes’ option selected for the green channel leading to the creation of a volume that represents the inclusion (i.e. the inclusion membrane and the lumen). The proportion of FITC ( Chlamydia ) co-stained with Alexa 568 (calreticulin) or Mitotracker Orange was then determined using the ImageJ Manders coefficient function. To quantify markers at the inclusion periphery, HeLa cells were infected with C. trachomatis LGV2 and fixed 24 hpi prior to triple staining for CERT, calreticulin and Chlamydia , as described. Ten inclusions were randomly selected from independent samples and 30 z-views acquired in each channel: CERT (green), calreticulin (red) and Chlamydia (blue) spanning the entirety of each inclusion. For every five z-planes (z-depth 0.33 µm; i.e. 6 per inclusion), a single pixel-width trace is made manually around the inclusion edge and the plot profile of each channel saved individually. Grey level values were extracted for each pixel in every channel using Excel and transformed into binary code where 1 > 10 and 0 < 10 (10 was determined to be the background signal in these experiments). The resulting data allow every pixel along each trace to be described as an RGB triplet binary code (e.g. calreticulin+, CERT+, Chlamydia − = 110). Pixels representing each subpopulation are summed and expressed as a percentage of the total number of pixels per inclusion (on average 2500 pixels were considered per inclusion). The average and standard deviation are obtained by comparison of populations from independent inclusions. Three-dimensional (3D) rendering was performed using the 3D viewer plugin in ImageJ . When iso-surface was used to generate a model, a threshold of 50 U was used with a transparency of 52% in each channel.
Transmission electron microscopy
HeLa cells were grown and infected directly on gold-coated copper membrane carriers for HPF with a 100-µm well depth (Leica 707898). At 24 hpi, the membrane carriers containing infected material were transferred to the Leica EM HPM100, where they were rapidly frozen using liquid nitrogen and a pressure of 2100 bar (cooling rate of the sample was approximately 25 000 K/s). The frozen samples were stored in liquid nitrogen until they were freeze-substituted. Freeze substitution (FS) was performed using the Leica EM AFS2, as described ( 40 ). Briefly, membrane carriers were freeze-substituted in dry acetone containing 0.2% uranyl acetate by warming from −160°C to −90°C. The sample was further warmed to −50°C while the FS cocktail was removed and the sample washed in ethanol. The sample was then infiltrated with HM20 resin and the resin polymerized using UV. Finally, the sample was warmed to room temperature and the blocks sectioned in a microtome (Leica UC7).
Immunogold labelling
Fifty-nanometre sections were incubated for 30 min in blocking buffer [Hanks' balanced salt solution (HBSS) containing 0.2% (v/v) Tween-20, 8% (w/v) BSA, 4.5% (w/v) fish gelatin], followed by incubation with primary antibodies diluted in blocking buffer (1 h, room temperature). Sections were washed once with HBSS containing 0.2% (v/v) Tween-20 and then with HBSS alone, prior to incubation with a goat anti-rabbit secondary conjugated with 10-nm gold beads (45 min, room temperature). Samples were post-fixed with 0.5% (w/v) glutaraldehyde in HBSS and washed extensively.
Electron tomography
Two hundred-nanometre sections were labelled with protein A coupled to 10 nm gold beads (EMS) as fiducial markers. Dual axis tomograms were collected with SerialEM ( 41 ) at a magnification of either 14 000× or 29 000× using a defocus of −1.5 µm on a Tecnai F20 microscope (FEI) equipped with a Gatan 4k CCD camera (Gatan). The tomographic tilt series were collected from −58 to +58 at 2° intervals. Immunolabelled sections were imaged at magnifications ranging from 2000× to 15 000× using Tecnai T10 or T12 microscopes, both equipped with Gatan 1k CCD cameras. Tomograms were aligned and reconstructed using IMOD ( 42 , 43 ). The reconstructions were filtered using nonlinear anisotropic diffusion ( 44 ) implemented in IMOD. Tomogram segmentation shown in Figure 5 A was performed manually in IMOD.
Statistical analyses
Data are presented as the mean ± standard deviation of ‘ n ’ experiments, and p-values were calculated using a two-tailed two-sample equal variance Student's t -test. A p-value of less than 0.05 was considered statistically significant.
Supporting Information Additional Supporting Information may be found in the online version of this article: Figure S1: Calreticulin labels the entire Chlamydia inclusion. HeLa cells were infected with C . trachomatis LGV2 and fixed 24 hpi. Calreticulin (red) and Chlamydia sp . (green) were immunolabelled. Images show a typical confocal z-stack acquired sequentially with a z-step of 0.33 μm. Scale bar, 5 μm. Figure S2: xz-view of calreticulin recruitment into the Chlamydia inclusion. HeLa cells were infected with C. trachomatis LGV2 and fixed 24 hpi. Texas Red-conjugated phalloidin was used to detect F-actin. Calreticulin (red) and Chlamydia (green) were immunolabelled. Confocal y-stacks were acquired sequentially with a y-step of 0.5 μm. Left panels show calreticulin in contact with Chlamydia in the inclusion. In contrast, phalloidin staining is excluded from the inclusion. This confirms that the calreticulin signal observed in the lumen in the xy-sections of Figures 1 and S1 is not due to deformation of the inclusion. Scale bar, 5 μm. Figure S3: ER live probe labels the Chlamydia inclusion. HeLa cells were cultured in Lab-Tek chambers and infected with C. trachomatis LGV2. At 24 hpi, chambers containing live infected cells were positioned on the microscope stage, and images acquired every 5 seconds after the addition of the probe to the media. At the end of the acquisition, a differential interference contrast (DIC) image was acquired to confirm the location of the nucleus and inclusions. A) Individual frame from the movie at 470 milliseconds when the probe is incorporated at steady state. Right, selected area from the central image focusing on an infected cell. N, nucleus; I, inclusion. Scale bar, 5 μm. B) Grey level of inclusions (I), nuclei (N), cytosol (ER) and areas where no cells are present (background) were determined. An intensity ratio was calculated from these values for each time point according to the following formula: (grey level ER/I – mean grey level background )/(grey level N – mean grey level background ). This ratio accounts for photobleaching, variation in probe uptake between cells and intracellular auto-fluorescence. Ratios were determined for each infected cell and the average and standard deviation (shading) calculated. As this probe is >520 Da, it will not be taken up passively into the inclusion ( 10 ). The graph illustrates that inclusions at 24 hpi are permeable to the ER probe, uptake kinetics of the inclusion are similar to the ER but that inclusions accumulate less probe than the cellular ER. Figure S4: 3D rendering of chlamydial inclusions illustrates CERT and calreticulin distribution. 3D rendering of a representative inclusion formed 24 hpi of HeLa cells with C. trachomatis LGV2. Fixed cells were immunolabelled for CERT (green), calreticulin (red) and Chlamydia (AlexaFluor 633 pseudocoloured blue). Left and right panels show volume rendering and iso-surface projections of the confocal z-stack, respectively. Figure S5: Manual segmentation and model building from tomograms. HeLa cells were cultured directly on high pressure freezing (HPF) carriers and infected with C. trachomatis LGV2. After freeze substitution, Lowicryl HM20 embedded samples were sectioned; 200-nm thick sections were used to record tomograms. Manual segmentation of entire tomograms was performed. An example for tracing is shown (left panel), together with the model superimposed onto a single section (right panel). Modelled structures are colour-coded: eukaryotic ribosomes (red), prokaryotic ribosomes (white), RB outer membrane (purple), RB inner membrane (purple), T3SS (brown), inclusion membrane (bright blue), ER (dark blue), ribosome free membranes (smooth ER, IC, Golgi; green), microtubules (yellow), actin filaments (white). Scale bar, 200 nm. Movie S1: Recruitment of DsRed-ER to the Chlamydia inclusion in live cells. HeLa cells transfected with DsRed-ER were infected with C. trachomatis LGV2 in Lab-Tek chambers. At 24 hpi, chambers containing live infected cells were transferred onto the microscope stage. Images were acquired every 30 min. Movie S2: Uptake of a live ER probe by the Chlamydia inclusion. HeLa cells were infected with C. trachomatis LGV2 in Lab-Tek chambers. At 24 hpi, chambers containing live infected cells were transferred onto the microscope stage. After finding the correct focal plane an image (each frame) was acquired every 5 seconds. Movie S3: 3D volume rendering of a representative chlamydial inclusion to examine CERT and calreticulin localization. HeLa cells were fixed 24 hpi after infection with C. trachomatis LGV2, then immunostained for CERT (green), calreticulin (red) and Chlamydia (AlexaFluor 633 pseudocoloured blue). A confocal z-stack was acquired with a z-dept of 330 nm. Volume rendering was performed using the imagej plugin 3D viewer. Movie S4: 3 D iso-surface rendering of a representative chlamydial inclusion to examine CERT and calreticulin localisation. HeLa cells were fixed 24 hpi after infection with C. trachomatis LGV2, then immunostained for CERT (green), calreticulin (red) and Chlamydia (AlexaFluor 633 pseudocoloured blue). A confocal z-stack was acquired with a z-depth of 330 nm. Iso-surface rendering was performed using the imagej pugin 3D viewer with a threshold of 50 U for each channel. Movie S5: Tomogram and model of the ER interaction with the inclusion membrane and the ‘pathogen synapse’. The first section steps through the z-stacks used to reconstruct the tomograms presented in 4 . This is followed by the model superimposed onto a z-section followed by a rotation to present the three-dimensional volume. Modelled structures are color-coded: eukaryotic ribosomes (red), prokaryotic ribosomes (white), RB outer membrane (purple), RB inner membrane (purple), T3SS (brown), inclusion membrane (bright blue), ER (dark blue), ribosome free membranes (smooth ER, IC, Golgi; green), microtubules (yellow), actin filaments (white). Movies S6: Going through the ‘pathogen synapse’. Video showing stepping through the z-stacks used to assemble the tomograms presented in panels of Figures 9 and 11 . Movies S7: Going through the ‘pathogen synapse’. Video showing stepping through the z-stacks used to assemble the tomograms presented in panels of Figures 9 and 11 . Movies S8: Going through the ‘pathogen synapse’. Video showing stepping through the z-stacks used to assemble the tomograms presented in panels of Figures 9 and 11 .
📊 Figures
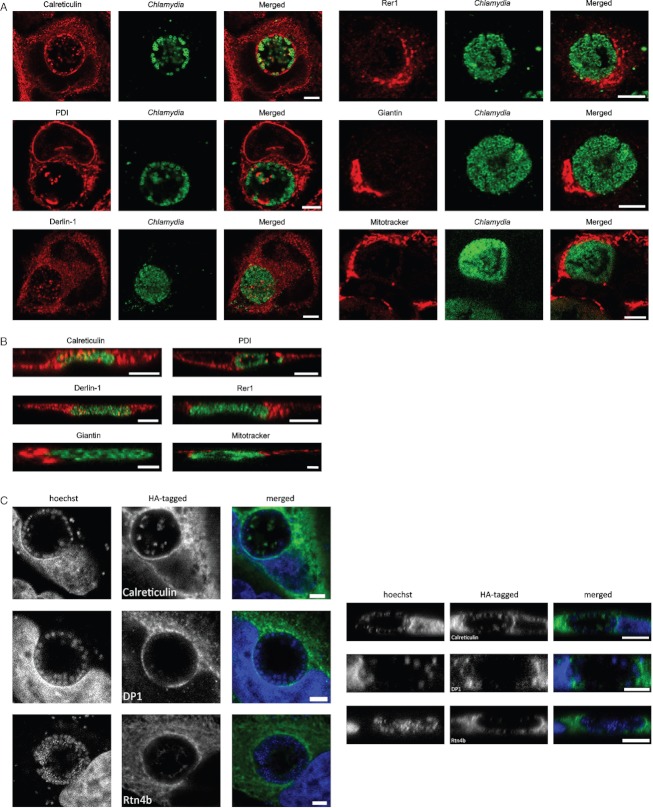
Figure 1
The Chlamydia inclusion specifically recruits ER markers
A) Confocal xy-sections of HeLa cells after infection with C. trachomatis LGV2 and fixed 24 hpi. Cells were immunolabelled for ER, intermediate compartment or Golgi markers, or incubated with Mitotrac...
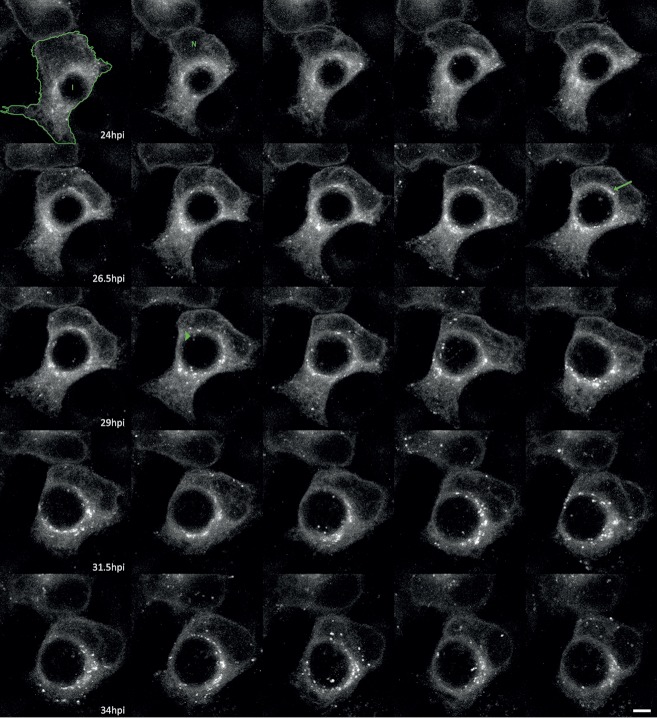
Figure 2
DsRed-ER is recruited to the chlamydial inclusion in live cells
HeLa DsRed-ER transfectants were infected with C. trachomatis LGV2 and individual cells imaged by confocal microscopy beginning 24 hpi. Panels show maximum intensity projections of confocal stacks of ...
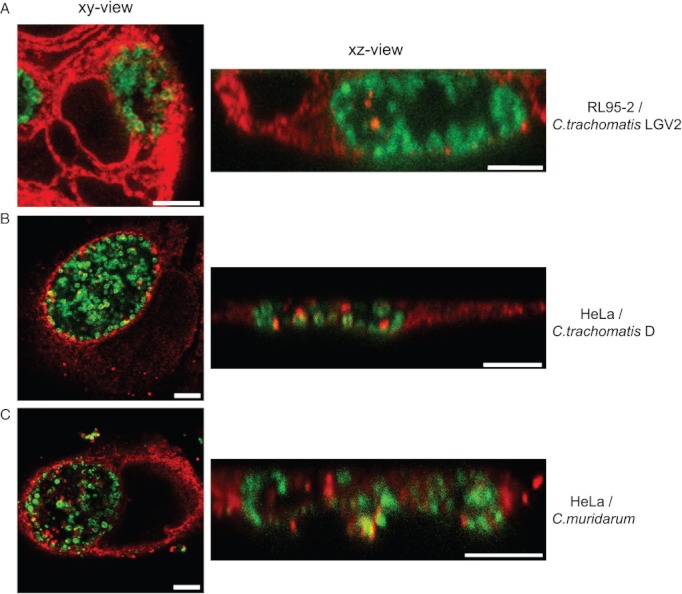
Figure 3
Calreticulin recruitment is independent of cell type and Chlamydia species/serovar
For each cell type and Chlamydia strain, fixation was performed at 24 hpi followed by immunolabelling for calreticulin (red) and Chlamydia (green). xy- and xz-stacks were acquired by confocal microsco...
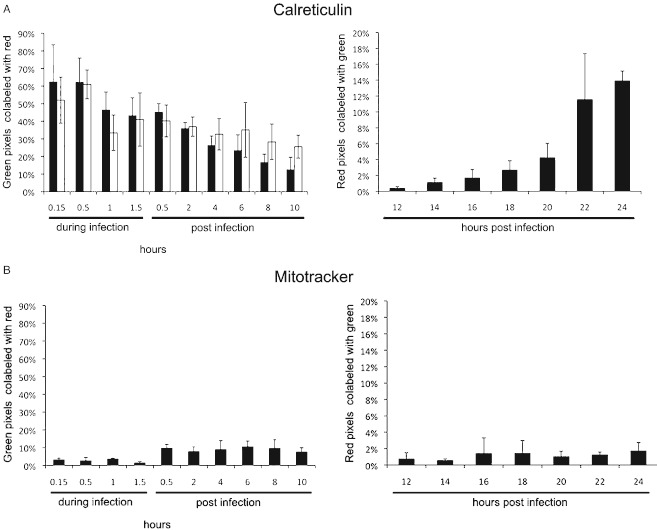
Figure 4
Biphasic recruitment of ER during the Chlamydia infection cycle
A) Quantitative analysis of calreticulin recruitment during the Chlamydia infection cycle. HeLa cells were infected with C. trachomatis LGV2 and fixed at different times post-infection. Left plot show...
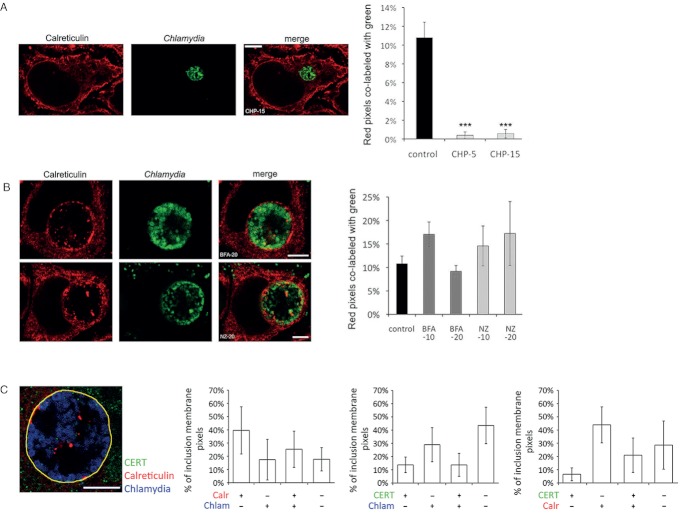
Figure 5
Calreticulin recruitment requires bacterial protein synthesis, but occurs independently of ER-Golgi trafficking
A) HeLa cells were infected with C. trachomatis LGV2, treated with chloramphenicol 12 hpi (5 or 15 u00b5g/mL; CHP-5, CHP-15), and fixed 24 hpi. Calreticulin (red) and Chlamydia (green) were immunolabe...
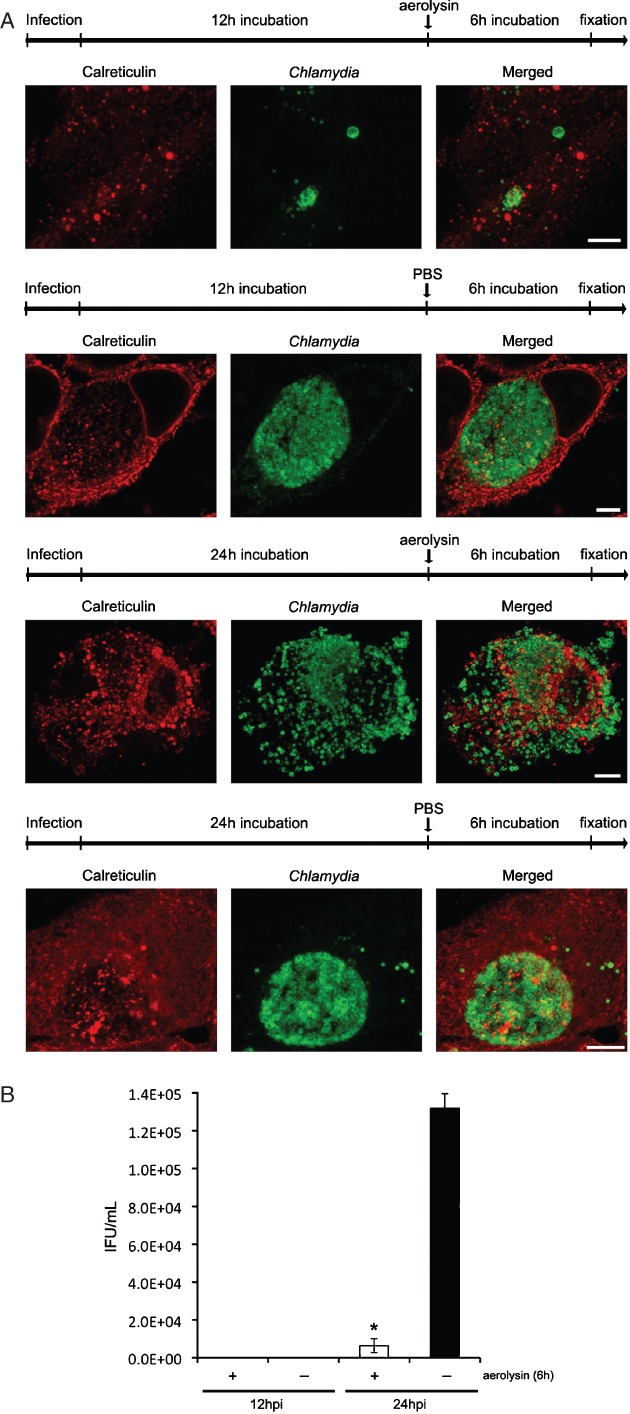
Figure 6
Aerolysin treatment disturbs inclusion biogenesis and abolishes infectivity
A) HeLa cells were infected with C. trachomatis LGV2. At 12 or 24 hpi, cells were treated (30 min) with pro-aerolysin (0.5 n m ) and fixed 6 h later for immunolabelling for calreticulin (red) and Chla...
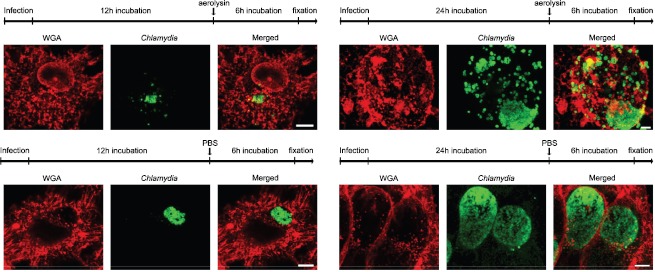
Figure 7
Aerolysin treatment arrests inclusion growth but maintains cell integrity
HeLa cells were infected with C. trachomatis LGV2. At 12 or 24 hpi, cells were treated 30 min with 0.5 n m pro-aerolysin and fixed for immunolabelling 6 h later. AlexaFluor 594-coupled wheat germ aggl...
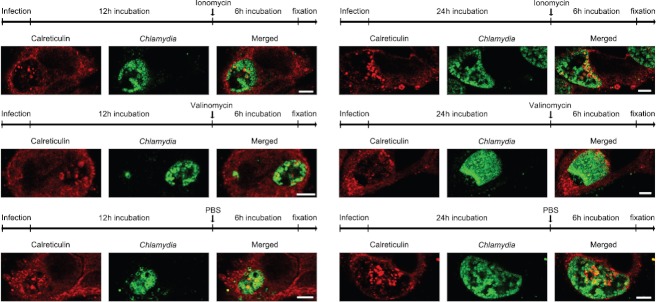
Figure 8
Ionophores do not affect Chlamydia growth or inclusion membrane integrity
HeLa cells were infected with C. trachomatis LGV2. At 12 or 24 hpi, cells were treated 30 min with 2 u03bc m of ionomycin or valinomycin, calcium and potassium ionophores, respectively. After 6 h, cel...
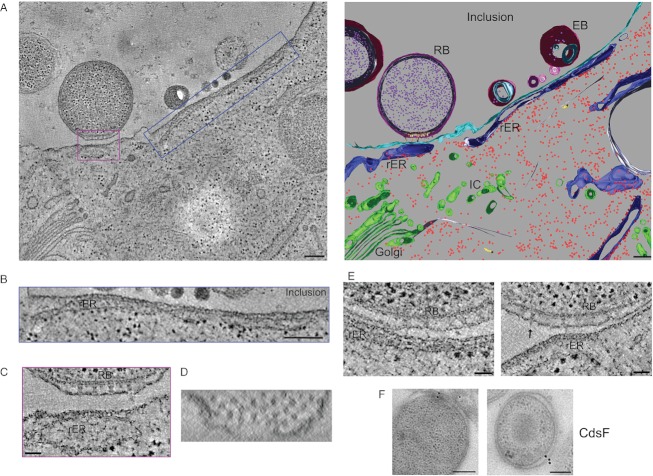
Figure 9
Electron tomography reveals a pathogen synapse involving the ER
HeLa cells were infected with C. trachomatis LGV2 and high pressure frozen at 24 hpi. Tomograms were recorded from 200 nm thick sections of the freeze-substituted, embedded samples. A) Left panel show...
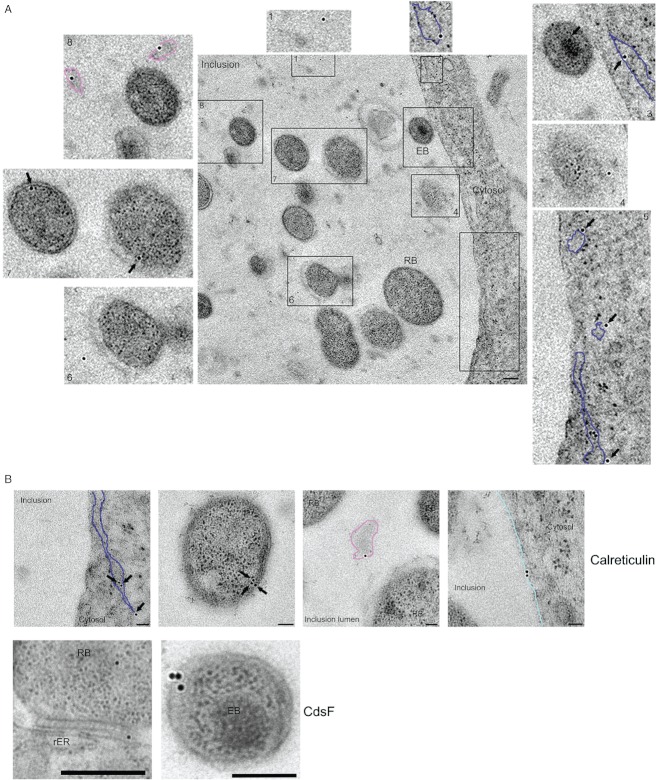
Figure 10
Immunogold labelling reveals a pathogen synapse with the inclusion membrane apposed to the rER
A) Lower magnification overview of part of a Chlamydia inclusion showing immunogold labelling of calreticulin (10 nm). Labelling is specifically observed at the ER membrane (blue tracing; panels 2, 3 ...
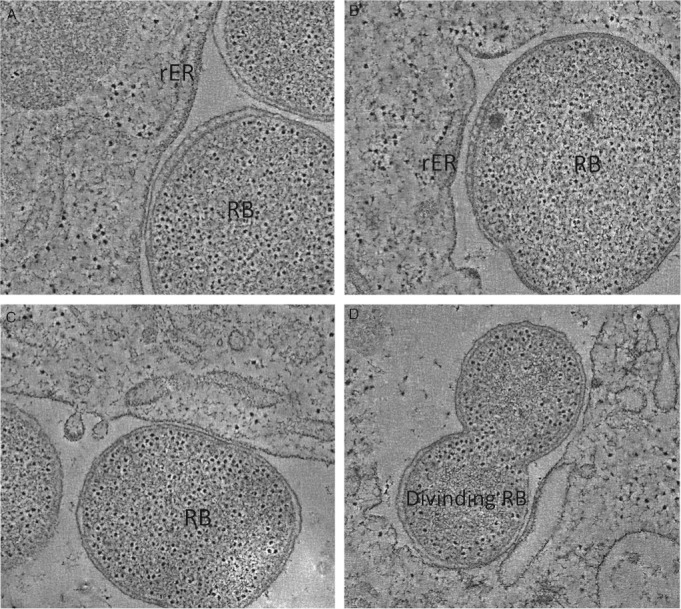
Figure 11
T3SS assemblies at rER-inclusion contact sites with luminal RBs
HeLa cells were infected with C. trachomatis LGV2 and high pressure frozen at 24 hpi. Tomograms of 200 nm sections, showing RBs in contact with the inclusion membrane. T3SS complexes are observed when...
Figure images are served from the NIH/NLM PubMed Central Open Access Subset or Europe PMC; copyright remains with the publishers and authors.
💬 Discussion
0 commentsNo comments yet. Be the first to start a discussion!
Leave a Comment