Abstract
AbstractThe possibility of detecting and classifying living cells in a label-free and non-invasive manner holds significant theranostic potential. In this work, Hyperspectral Imaging (HSI) has been successfully applied to the analysis of macrophagic polarization, given its central role in several pathological settings, including the regulation of tumour microenvironment. Human monocyte derived macrophages have been investigated using hyperspectral reflectance confocal microscopy, and hyperspectral datasets have been analysed in terms of M1 vs. M2 polarization by Principal Components Analysis (PCA). Following PCA, Linear Discriminant Analysis has been implemented for semi-automatic classification of macrophagic polarization from HSI data. Our results confirm the possibility to perform single-cell-level in vitro classification of M1 vs. M2 macrophages in a non-invasive and label-free manner with a high accuracy (above 98% for cells deriving from the same donor), supporting the idea of applying the technique to the study of complex interacting cellular systems, such in the case of tumour-immunity in vitro models.
🔬 Techniques
💻 Software
✨ Fluorophores
🧪 Sample Preparation
🔬 Cell Lines
🏭 Microscope Brands
🧪 Reagent Suppliers
🔴 Lasers
🔎 Objectives
💻 Software Details
🏛️ Research Organizations (ROR)
Affiliated research institutions:
📋 Methods
Cell isolation and differentiation
MDM differentiation and polarization were performed slightly modifying the protocol described by Mantovani et al . 46 . Buffy coats from male healthy donors were obtained at the Blood Donor Centre at Policlinico Universitario Campus Bio-Medico after written informed consent, according to the institutional guidelines.
Human peripheral blood mononuclear cells
(PBMCs) were isolated from buffy coats by Lympholyte®-H density gradient (Cedarlane Laboratories). Monocytes were sorted by magnetic activated cell sorting (MACS) using magnetic beads conjugated with anti-human CD14 (Miltenyi Biotech) and cultured for 6 days in RPMI 1640 culture medium (Euroclone) supplemented with 10% foetal bovine serum (Hyclone, Thermo Fisher Scientific), 5% human serum (Sigma-Aldrich), 100 units/mL penicillin, 100 mg/mL streptomycin (Euroclone), 2 mM l -glutamine (Euroclone) and 25 ng/mL colony stimulating factor 1 (CSF-1) (alias Macrophage CSF, M-CSF, PeproTech) to differentiate them into non-polarized (Mϕ) MDM. M1 polarization was achieved by supplementation with interferon-γ (IFN-γ, 10 ng/mL, PeproTech) and lipopolysaccharides from E . Coli (LPS, 100 ng/mL, Sigma-Aldrich) for 48 hours, whereas M2 polarization was obtained by supplementing cells with interleukin-4 (IL-4, 20 ng/mL, PeproTech) for 48 hours. After polarization, M1 and M2 populations were split into different subsamples to perform molecular, flow cytometry and spectroscopic characterizations.
Fluorescence Imaging
MDMs were fixed in 4% PFA for 10 min and permeabilised with 0.1% Triton X-100 (Sigma-Aldrich). After washing, cytoskeletal actin was labelled with FITC-phalloidin (Sigma-Aldrich, 1:400 in PBS for 45 min), and nuclei were counterstained with DAPI (Thermo Fisher Scientific, 1:10000 in PBS for 15 min).
Show full methods section
Cell isolation and differentiation
MDM differentiation and polarization were performed slightly modifying the protocol described by Mantovani et al . 46 . Buffy coats from male healthy donors were obtained at the Blood Donor Centre at Policlinico Universitario Campus Bio-Medico after written informed consent, according to the institutional guidelines.
Human peripheral blood mononuclear cells
(PBMCs) were isolated from buffy coats by Lympholyte®-H density gradient (Cedarlane Laboratories). Monocytes were sorted by magnetic activated cell sorting (MACS) using magnetic beads conjugated with anti-human CD14 (Miltenyi Biotech) and cultured for 6 days in RPMI 1640 culture medium (Euroclone) supplemented with 10% foetal bovine serum (Hyclone, Thermo Fisher Scientific), 5% human serum (Sigma-Aldrich), 100 units/mL penicillin, 100 mg/mL streptomycin (Euroclone), 2 mM l -glutamine (Euroclone) and 25 ng/mL colony stimulating factor 1 (CSF-1) (alias Macrophage CSF, M-CSF, PeproTech) to differentiate them into non-polarized (Mϕ) MDM. M1 polarization was achieved by supplementation with interferon-γ (IFN-γ, 10 ng/mL, PeproTech) and lipopolysaccharides from E . Coli (LPS, 100 ng/mL, Sigma-Aldrich) for 48 hours, whereas M2 polarization was obtained by supplementing cells with interleukin-4 (IL-4, 20 ng/mL, PeproTech) for 48 hours. After polarization, M1 and M2 populations were split into different subsamples to perform molecular, flow cytometry and spectroscopic characterizations.
Fluorescence Imaging
MDMs were fixed in 4% PFA for 10 min and permeabilised with 0.1% Triton X-100 (Sigma-Aldrich). After washing, cytoskeletal actin was labelled with FITC-phalloidin (Sigma-Aldrich, 1:400 in PBS for 45 min), and nuclei were counterstained with DAPI (Thermo Fisher Scientific, 1:10000 in PBS for 15 min).
Flow cytometry
MDMs were stained with monoclonal mouse anti-human CD68, CD80, CD86, CD163, and CD206 (mannose receptor, MR) antibodies (eBioscience, Affymetrix). Cells were suspended in PBS at a concentration of 1 × 10 5 cells/mL. Non-specific antigens were blocked by 5% BSA buffer. For intracellular CD68, fixation in 4% PFA and permeabilisation with 0.1% Triton X-100 were achieved prior to staining. Cells were analysed using a BD FACSCanto II flow cytometer (BD Biosciences). Non-specific mouse Igs were used as an isotype control.
Gene expression
Gene expression levels were evaluated by two-step Quantitative Reverse Transcription PCR (RT-qPCR). Isolation and purification of mRNA were performed using TRI Reagent (Sigma-Aldrich). Extracted mRNA was quantified by spectrophotometric technique (Nanodrop, Thermo Fisher Scientific). 1 μg of total RNA was reverse-transcribed using High Capacity cDNA Reverse Transcription Kit (Life Technologies) according to the manufacturer’s instructions. Amplification was performed on 50 ng of cDNA in a total reaction volume of 20 μL, using TaqMan Universal MasterMix II (Life Technologies) and primers (TaqMan Gene Expression Assay, Life Technologies) for the following genes: interleukin-10 (IL10, Hs00961622_m1), interleukin-12 (IL12A, Hs00168405_m1), arginase (ARG1, Hs00968979_m1), inducible nitric oxide synthetase (NOS2, Hs01075529_m1), tumour necrosis factor-α (TNFA, Hs01113624_g1), and CD206 (MRC1, Hs00267207_m1). Beta-actin (ACTB, Hs01060665_g1), glyceraldehyde 3-phosphate dehydrogenase (GAPDH, Hs02758991_g1) and cyclophilin A (PPIA, Hs04194521_s1) were used as a set of endogenous controls (following their validation with Bestkeeper software 47 ).
Statistical analysis
Statistical analysis of flow cytometric and gene expression data was performed using GraphPad Prism ver. 6.0 suite (GraphPad Software). Conditions of normality were checked and met. Student’s t-test was used for means comparison between M1- and M2-polarised cells. Significance was set at the 0.05 level.
HSI and multivariate analysis
After polarization induction, MDMs were transferred to dedicated culture chambers 43 , composed of a circular glass coverslip (170 μm thickness, 40 mm diameter), surmounted by a 2-mm-thick plasma-bonded annular polydimethylsiloxane gasket. After overnight incubation, chambers were closed with a glass coverslip lid and mounted on a sample holder which was then fixed on the microscope stage. Specimens were observed under a custom built hyperspectral confocal reflectance microscope, equipped with a supercontinuum white light laser (SuperK, NKT Photonics). Details on the microscope design and optical performance are provided elsewhere 42 , 43 . The hyperspectral microscope was equipped with a 36 × 0.52 N.A. reflective objective. Square ROIs (1 × 1 mm 2 wide) were recorded with a 512 × 512 pixel resolution at 400 Hz. The spectral resolution was 1.6 nm in the wavelength range considered for elaboration (500–1000 nm). Illumination dose was tested against possible photo-damage effects. Image analysis protocol included 30 randomly chosen cells per field of view. For each cell, an averaged spectrum on a circular region (12 pixel diameter, equivalent to 23.4 µm) centred in the nuclear area, was extracted from the hyperspectral images using a custom software. Spectra were then analysed using Origin ver. 9.1 suite (OriginLab). Cell spectra were treated for background subtraction using signal from free adjacent areas and further smoothed using a Savitzky-Golay algorithm.
Principal Component Analysis
(PCA) was used to analyse spectra, considering the intensities over 26 discrete equidistant wavelengths ranging from 500 to 1000 nm (20 nm spacing). PCA is a multivariate statistical method for the visualization of the information contained in a data matrix to reduce the original data complexity. This result is obtained by a transformation from the n-dimensional space of n original variables (26 sampling wavelengths) into a space in which the new variables (principal components) and hence dimensions are ordered hierarchically according to the variance of data points. In this way, considering only a limited number of dimensions has a limited effect in terms of loss of information. From the analysis of the loading plot ( i . e ., the principal component coefficients in the sample space) for the principal component along which the M1/M2 separation occurred, the spectral regions involved in the characterization of the two cell types were identified. A set of the most representative wavelengths was used for Linear Discriminant Analysis (LDA), a trained statistical algorithm for feature reduction and object classification that was implemented in MATLAB (rel. 2015b, The MathWorks). The dataset consisted in 60 observations (30 M1 and 30 M2) for each donor. Donors were first analysed individually, and a stratified 10-fold cross validation method 48 was chosen to recursively train-test the LDA model. Then, the whole dataset comprising the observations from all donors was considered and subsampled for training-test using a stratified 10-fold cross validation method. In both cases, confusion matrices and classification errors were calculated as the summation of values from the 10-fold procedure.
Electronic supplementary material Electronic Supplementary Information Video SV1. Pseudo-coloured lambda stack for M1 MDMs. Video SV2. Pseudo-coloured lambda stack for M2 MDMs.
📊 Figures
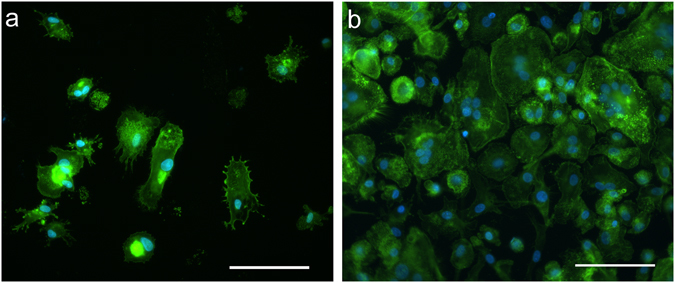
Figure 1
Epifluorescence microscopy. M1 ( a ) and M2 ( b ) MDMs labelled with FITC-phalloidin to stain cytoskeletal actin (in green), and DAPI nuclear counterstain (in blue). Scale bar: 100 u03bcm.
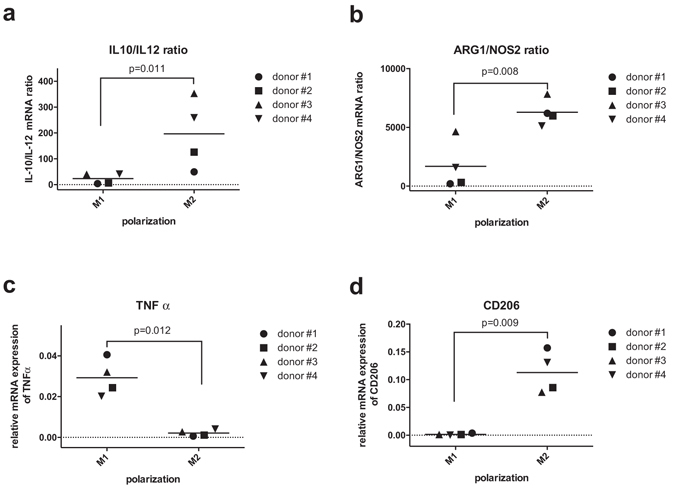
Figure 2
Gene expression profile evaluated by RT-qPCR. Scatter plots of IL-10/IL-12 mRNA ratio ( a ), ARG1/NOS2 mRNA ratio ( b ), TNF-u03b1 relative mRNA expression ( c ) and CD206 relative mRNA expression ( d...
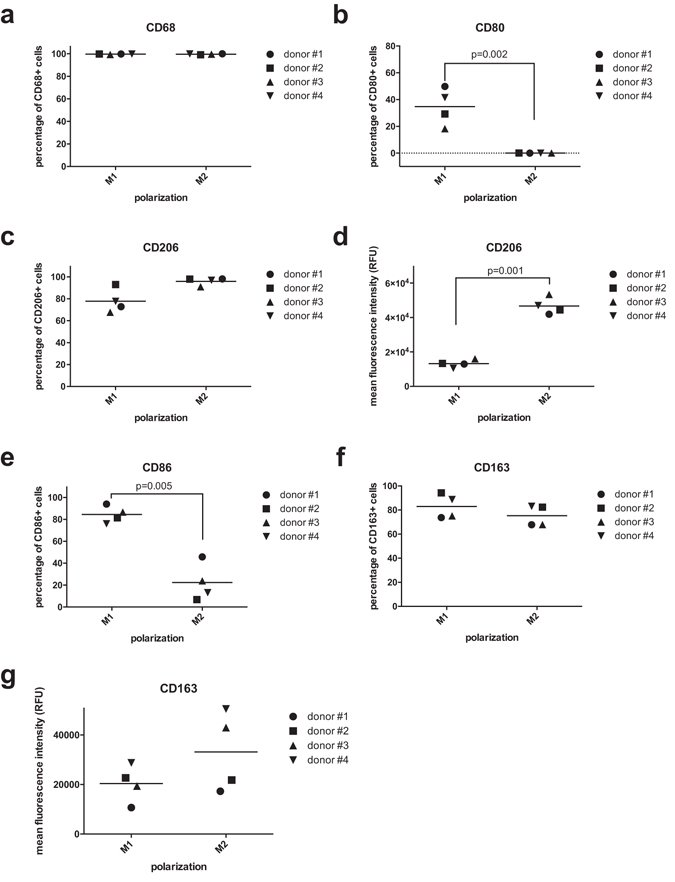
Figure 3
Flow cytometry. ( a u2013 c ) Positivity to pan-macrophagic marker CD68 ( a ), M1 marker CD80 ( b ) and M2 marker CD206 ( c ). ( d ) Mean fluorescence intensity levels for CD206. ( e , f ) Positivity ...
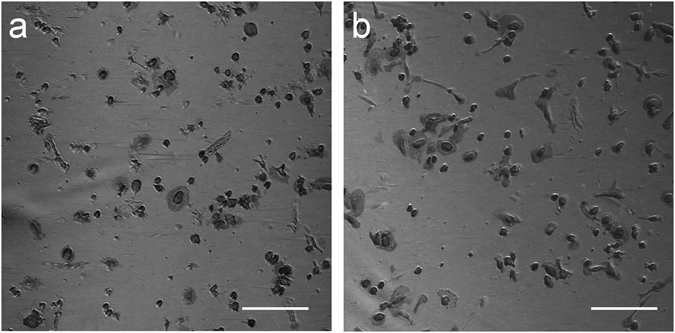
Figure 4
Hyperspectral microscopy. Representative micrographs for M1 ( a ) and M2 ( b ) MDMs obtained as a grey level representation of the reflectance value at 700u2009nm, as extracted from the hyperspectral ...
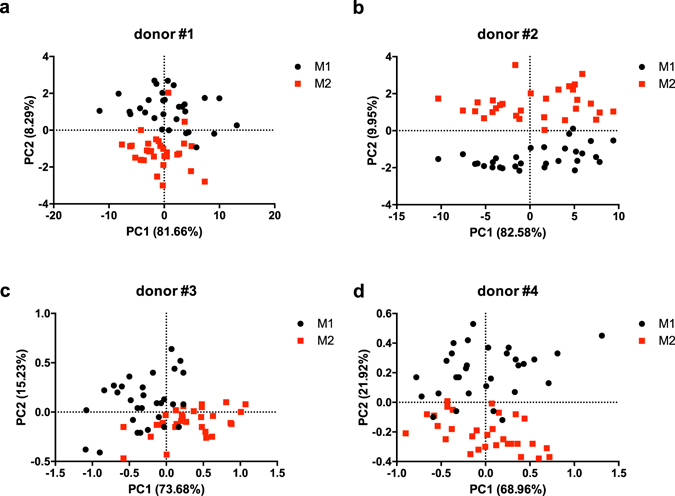
Figure 5
Principal Component Analysis. PCA score plots of MDM spectra for different donors. Spectra of M1 and M2 MDMs are represented as black circles and red squares, respectively.
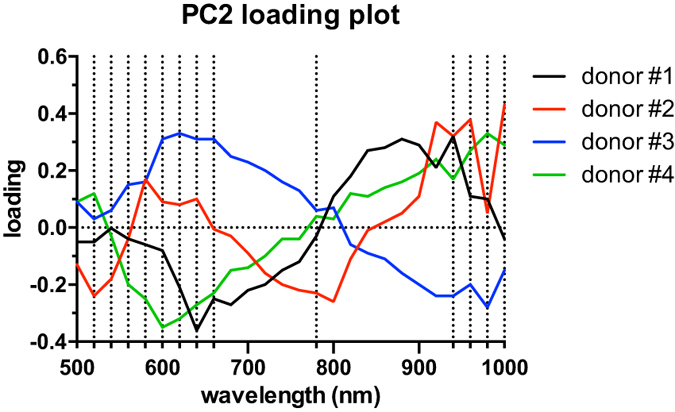
Figure 6
PC2 loading plot. Loading plot for the second principal component (PC2), along which the M1/M2 separation occurred. Wavelengths chosen for LDA analysis are marked by dotted lines.
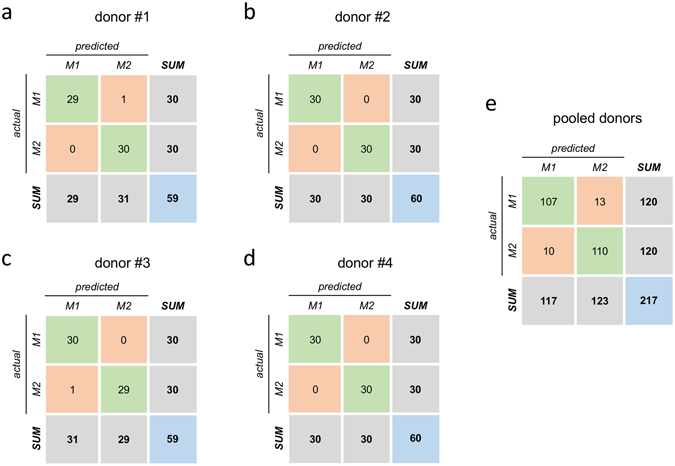
Figure 7
LDA model. Confusion matrices from 10-fold cross validation (each matrix is the summation of 10 confusion matrices from 10 test sets).
Figure images are served from the NIH/NLM PubMed Central Open Access Subset or Europe PMC; copyright remains with the publishers and authors.
💬 Discussion
0 commentsNo comments yet. Be the first to start a discussion!
Leave a Comment