Abstract
Advances in fluorescence microscopy are providing increasing evidence that the spatial organization of proteins in cell membranes may facilitate signal initiation and integration for appropriate cellular responses. Our understanding of how changes in spatial organization are linked to function has been hampered by the inability to directly measure signaling activity or protein association at the level of individual proteins in intact cells. Here we solve this measurement challenge by developing Clus-DoC, an analysis strategy that quantifies both the spatial distribution of a protein and its colocalization status. We apply this approach to the triggering of the T-cell receptor during T-cell activation, as well as to the functionality of focal adhesions in fibroblasts, thereby demonstrating an experimental and analytical workflow that can be used to quantify signaling activity and protein colocalization at the level of individual proteins.
🔬 Techniques
✨ Fluorophores
🧪 Sample Preparation
🔬 Cell Lines
🏭 Microscope Brands
🧪 Reagent Suppliers
📷 Detectors
💻 Software Details
💻 Code & Software
💾 Data Repositories
🏛️ Research Organizations (ROR)
Affiliated research institutions:
📋 Methods
Sample preparation for activated T-cells Jurkat E6.1 T-cells (American Type Culture Collection, Manassas, VA) were maintained in RPMI 1640 (Life Technologies, Carlsbad, CA) supplemented with 10% fetal calf serum (FCS), 2 mM l -glutamine, and 1 mM penicillin and streptomycin (all from Invitrogen, Carlsbad, CA) and transfected by electroporation (NEON; Invitrogen) to express CD3ζ fused to PSCFP2. Clean glass coverslips were coated with anti-CD3ε (16-0037; eBioscience, San Diego, CA) and anti-CD28 (16-0289; eBioscience) antibodies for at least 1 h at 37°C. Cells were activated on antibody-coated coverslips for 10 min at 37°C and then fixed with 4% paraformaldehyde (vol/vol) in phosphate-buffered saline (PBS) for 20 min at room temperature. Cells were permeabilized with 0.1% (vol/vol) Triton X-100 for 4 min at room temperature, blocked in 5% bovine serum albumin (wt/vol) in PBS, and then labeled with primary antibody against human CD3ζ phosphorylated at Tyr-142 directly conjugated to Alexa Fluor 647 (558489; BD Biosciences, San Jose, CA) overnight at 4°C or against CD45 (ab10559; Abcam, Cambridge, UK) for 1 h at room temperature, followed by staining with Alexa Fluor 647–conjugated goat antibody specific to the rabbit F(ab′)2 fragment (111-606-047; Jackson ImmunoResearch).
Sample preparation for imaging focal adhesions Mouse embryonic fibroblasts
(MEFs) were cultured in high-glucose DMEM (Life Technologies) supplemented with 10% FCS at 37°C and 5% CO 2 . MEF cells were transfected by Lipofectamine 3000 (Invitrogen) according to the manufacturer’s instructions to express paxillin-mEos2. Transfected cells were plated onto 25 μg/ml fibronectin–coated clean cover glasses and incubated for 3 h at 37°C. The cells were then fixed for 15 min in freshly made warm 4% paraformaldehyde. For immunostaining against phosphorylated paxillin, cells were permeabilized for 10 min in 0.5% Triton X-100, followed by blocking with 5% FCS for an additional 40 min. Cells were then labeled with primary antibody from rabbit against mouse paxillin phosphorylated at Tyr-118 (Life Technologies), followed by staining with Alexa Fluor 647–coupled secondary antibody specific to the rabbit F(ab′)2 fragment (111-606-047; Jackson ImmunoResearch). Cells were washed in 10 mM cysteamine in PBS three times, for 5 min each time, to decrease the floating background for dSTORM imaging.
Show full methods section
Sample preparation for activated T-cells Jurkat E6.1 T-cells (American Type Culture Collection, Manassas, VA) were maintained in RPMI 1640 (Life Technologies, Carlsbad, CA) supplemented with 10% fetal calf serum (FCS), 2 mM l -glutamine, and 1 mM penicillin and streptomycin (all from Invitrogen, Carlsbad, CA) and transfected by electroporation (NEON; Invitrogen) to express CD3ζ fused to PSCFP2. Clean glass coverslips were coated with anti-CD3ε (16-0037; eBioscience, San Diego, CA) and anti-CD28 (16-0289; eBioscience) antibodies for at least 1 h at 37°C. Cells were activated on antibody-coated coverslips for 10 min at 37°C and then fixed with 4% paraformaldehyde (vol/vol) in phosphate-buffered saline (PBS) for 20 min at room temperature. Cells were permeabilized with 0.1% (vol/vol) Triton X-100 for 4 min at room temperature, blocked in 5% bovine serum albumin (wt/vol) in PBS, and then labeled with primary antibody against human CD3ζ phosphorylated at Tyr-142 directly conjugated to Alexa Fluor 647 (558489; BD Biosciences, San Jose, CA) overnight at 4°C or against CD45 (ab10559; Abcam, Cambridge, UK) for 1 h at room temperature, followed by staining with Alexa Fluor 647–conjugated goat antibody specific to the rabbit F(ab′)2 fragment (111-606-047; Jackson ImmunoResearch).
Sample preparation for imaging focal adhesions Mouse embryonic fibroblasts
(MEFs) were cultured in high-glucose DMEM (Life Technologies) supplemented with 10% FCS at 37°C and 5% CO 2 . MEF cells were transfected by Lipofectamine 3000 (Invitrogen) according to the manufacturer’s instructions to express paxillin-mEos2. Transfected cells were plated onto 25 μg/ml fibronectin–coated clean cover glasses and incubated for 3 h at 37°C. The cells were then fixed for 15 min in freshly made warm 4% paraformaldehyde. For immunostaining against phosphorylated paxillin, cells were permeabilized for 10 min in 0.5% Triton X-100, followed by blocking with 5% FCS for an additional 40 min. Cells were then labeled with primary antibody from rabbit against mouse paxillin phosphorylated at Tyr-118 (Life Technologies), followed by staining with Alexa Fluor 647–coupled secondary antibody specific to the rabbit F(ab′)2 fragment (111-606-047; Jackson ImmunoResearch). Cells were washed in 10 mM cysteamine in PBS three times, for 5 min each time, to decrease the floating background for dSTORM imaging.
SMLM imaging and dual-color image acquisition
SMLM image sequences were acquired on a total internal reflection fluorescence (TIRF) microscope (ELYRA; Zeiss, Jena, Germany) with a 100× oil-immersion objective (numerical aperture 1.46) and 1.6× Optivar. Photoconversion of PSCFP2 or mEos2 was achieved with 8 μW of 405-nm laser radiation, and the green-converted PSCFP2/red-converted mEos2 was imaged with 18 mW of 488/561-nm light, respectively. For Alexa Fluor 647, 15 mW of 633-nm laser illumination was used for imaging. An oxygen-scavenging PBS-based buffer (containing 25 mM 4-(2-hydroxyethyl)-1-piperazineethanesulfonic acid, 25 mM glucose, 5% glycerol, 0.05 mg/ml glucose oxidase, and 0.025 mg/ml horseradish peroxidase, supplemented with 50 mM cysteamine; all from Sigma-Aldrich, St. Louis, MO) was used for dSTORM imaging. For each cell, 20,000 images were acquired with a cooled, electron-multiplying charge-coupled device camera (iXon DU-897; Andor, Belfast, UK) using an exposure time of 30 ms and a pixel size of 100 nm in the image space. Raw fluorescence intensity images were analyzed with the software Zen 2011 SP3 (Zeiss MicroImaging), generating reconstructed SMLM images, as well as tables containing the x , y -coordinates of each molecule detected during the acquisition.
Data processing
Data in the form of an ASCII text file containing spatial coordinate and channel identification information for each detected localization are loaded into the GUI application. An additional file containing user-defined ROIs is also loaded. These ROIs define subregions within the cell area within which each analysis will be applied. ROI area was typically 4000 nm × 4000 nm, and care was taken that the ROI border fell entirely within the cell boundary. An average clustering value across an entire ROI is measured using the linearized form of Ripley’s K function, L ( r ) − r , which relates to Ripley’s K function as where K ( r ) is Ripley’s K function at radius r . This is performed on a single user-given square ROI, with the start, end, and step size of r also user defined. An additional parameter is supported to randomly subsample the points within a ROI to a user-defined maximum value. This improves processing speed for dense point fields and allows clustering behaviors between ROIs to be compared at identical point densities. Points are segmented into clusters using the DBSCAN algorithm. Before this clustering, the user has the option of segmenting noise localizations from the ROI. Here a “noise” point is defined as a point whose L ( r ) − r value at a user-given radius (typically 50 nm) is below that of the value expected for a spatially random distribution of that density of points. Given user-specified values for the search radius and minimum number of points per cluster, a custom-written DBSCAN implementation (written in C++ and compiled using MEX) segments the points within each ROI into clusters or as the outliers or noise component. Data are extracted on a per-cluster basis, including number of points per cluster, cluster border, area, and circularity based on the cluster contour, cluster density, and, where included with DoC scores, the number of points within the cluster above and below the DoC threshold. Those clusters containing at least one point with a DoC score above the threshold are further subsegmented into points above and below the threshold, with the number, area, and density measures for these subpopulations extracted. The cluster contour is defined by generating a 2D image of the histogram of localization points within the cluster. This 2D histogram has bin widths of 1 nm in each dimension. This histogram rendering is smoothed by a user-defined value (typically 15 nm). The value of this smoothed rendering at each localization point is evaluated and a threshold taken at the lowest value associated with a data point. The outline of this thresholded region is taken as the contour of the cluster for measuring cluster circularity, diameter, and area and for counting the number of molecules per cluster. A DoC score is calculated for each point within a ROI for a range of discrete search radii from 0 to a maximum value. Both the step size and maximum radius ( R Max ) are user specified, typically 10 and 500 nm, respectively. The search for points within this radius is accelerated by a MEX function performing a k -dimensional tree search algorithm. The density of points at each search radius for channel i is correlated against the values from channel j using a pairwise linear correlation of Spearman’s ρ coefficient. This correlation, S ij , is converted into a DoC score by first calculating the cross-channel nearest-neighbor distance at each point in i to j , N ij , by the expression This is repeated for both channels, performing the correlation and nearest-neighbor searches in the opposite direction. Once calculated, this DoC score can be compared with a user-defined threshold (typically 0.4) to segment points that are colocalized, clusters that are or are not colocalized (given a minimum number of points per cluster with a DoC score above the threshold), or to segment points within a cluster based on DoC score.
Generation of GUI A MATLAB
GUI was written to provide a graphical front end to the underlying clustering and DoC functions. This interface allows users to load and visualize SMLM dual-color data sets, executes the described functions, and exports plots and tabulated results. Additional functionalities, such as further data analysis, the ability to specify ROIs and imported binary masks and to do batch processing, are supported. Codes are written for 64-bit MATLAB R2014b or above under a Windows operating system. All processing completes within minutes on a standard desktop PC for a single SMLM data set of ∼10 6 points. The latest version of the source codes for the underlying functions and GUI application, complete with new functionalities and bug fixes, are available at the authors’ Git repository ( https://github.com/PRNicovich/ClusDoC ).
Statistical analysis
All statistical analysis was performed using GraphPad software (Prism, San Diego, CA). Statistical significance between data sets was determined by performing two-tailed Student’s t tests. Graphs show mean values, and error bars represent the SEM. In statistical analysis, p > 0.05 is indicated as not significant (n.s.), whereas statistically significant values are indicated as follows: * p ≤ 0.05, ** p < 0.01, *** p < 0.001, and **** p < 0.0001.
📊 Figures
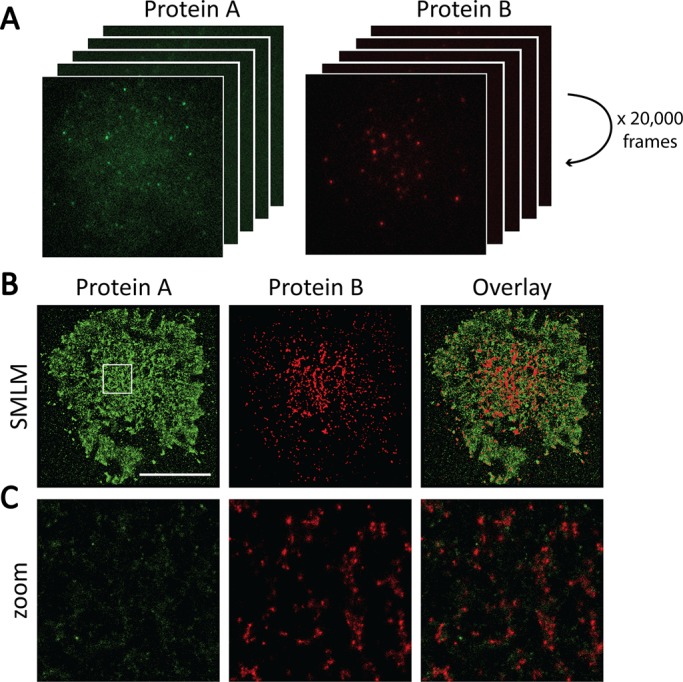
FIGURE 1:
SMLM acquisition and image reconstruction. (A) For SMLM, a large number of frames are acquired for each cell. In each frame, only sparse subsets of molecules are fluorescent and can be accurately loca...
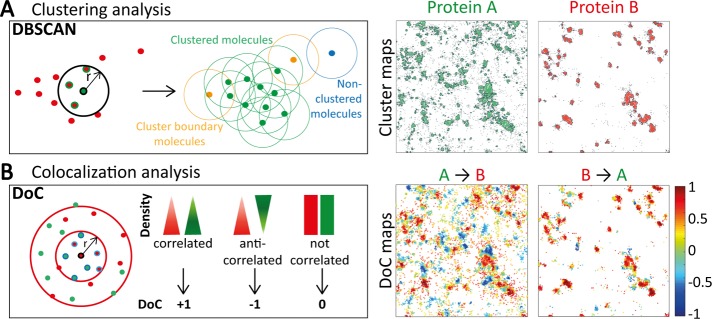
FIGURE 2:
Principles underlying DBSCAN and DoC analysis methods. (A) DBSCAN is a propagative cluster detection method in which connectivity between molecules is established if the number of neighbors is above a...
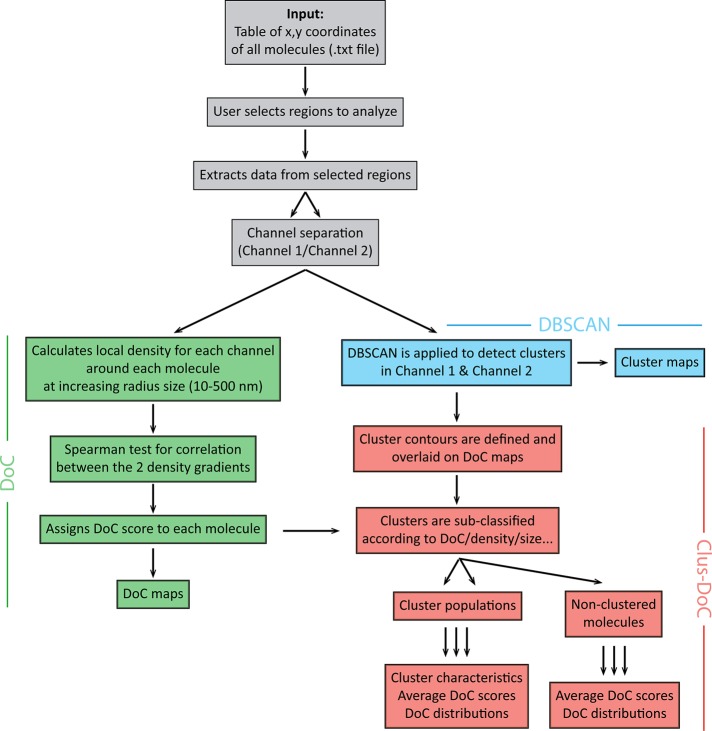
FIGURE 3:
Analysis workflow for Clus-DoC. The input for the analysis consists in table(s) of x , y -coordinates of all molecules. The DoC module (green) assigns DoC scores to each molecule. The DBSCAN module (b...
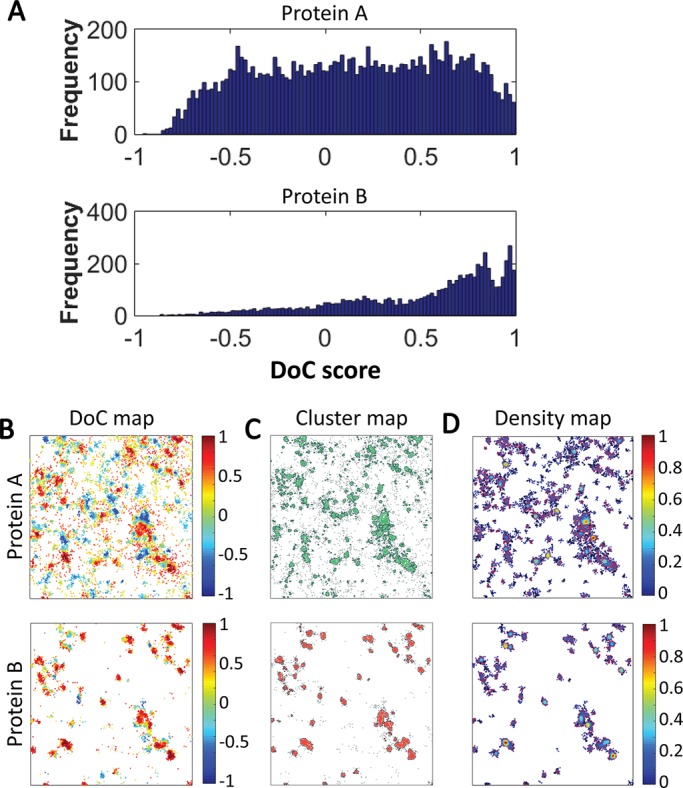
FIGURE 4:
Output data from Clus-DoC analysis. (A) Frequency distributions of DoC scores of all molecules for protein A (top) and protein B (bottom). (B) Colocalization maps for both channels in which molecules ...
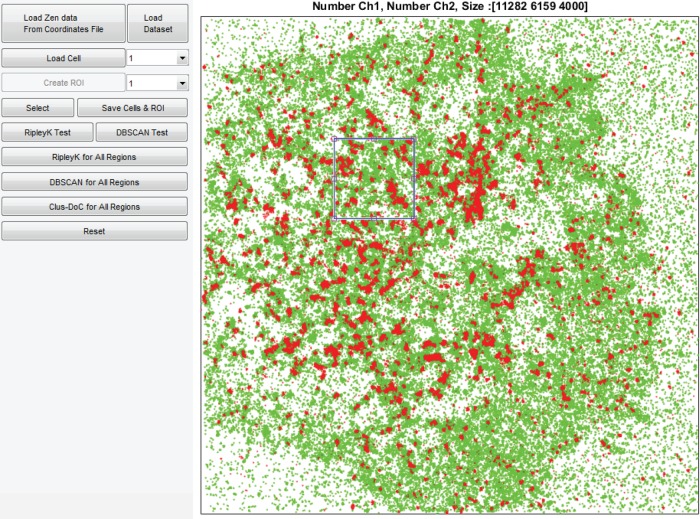
FIGURE 5:
GUI for Clus-DoC analysis. Image of the GUI for the Clus-DoC analysis, which can be used to load data sets and then run a global clustering analysis (Ripleyu2019s K ), cluster detection (DBSCAN), or C...
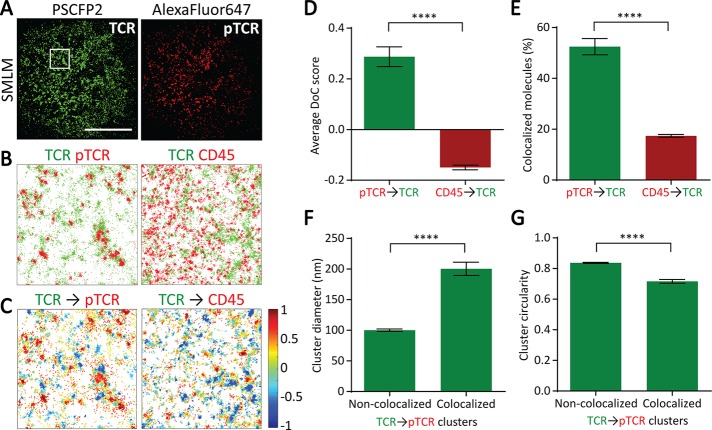
FIGURE 6:
Clus-DoC analysis applied to T-cell receptor triggering. (A) Reconstructed SMLM images of TCR (green) and phosphorylated TCR (pTCR; red) in activated Jurkat cells. Scale bar, 10 u03bcm. (B) Left, TCR ...
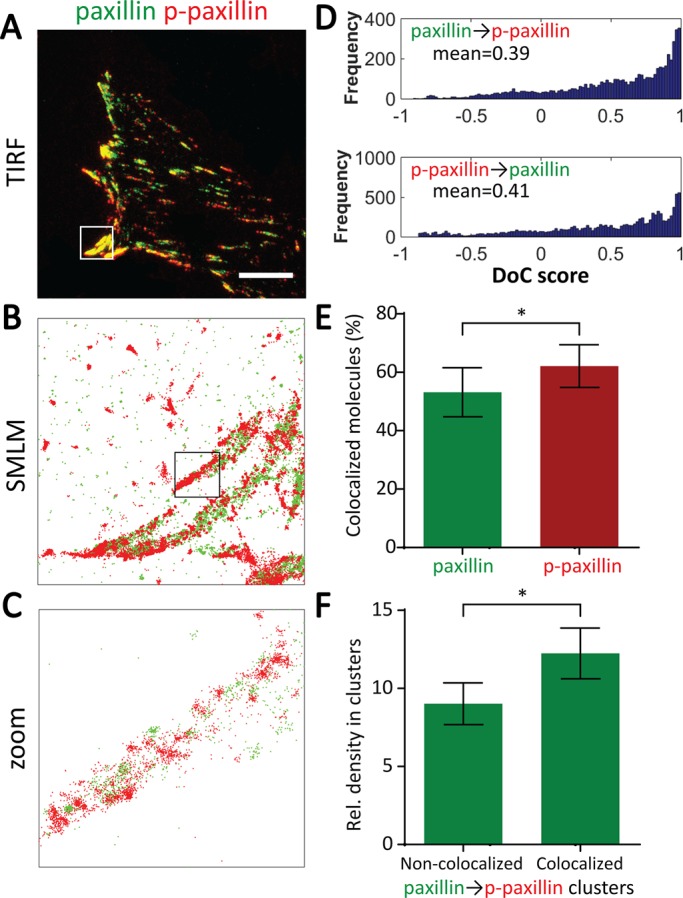
FIGURE 7:
Clus-DoC analysis applied to focal adhesions. (A)u00a0Two-color TIRF image of paxillin (green) and phosphorylated paxillin (p-paxillin; red) in MEF cells on fibronectin. Scale bar, 10 u03bcm. (B) SMLM...
Figure images are served from the NIH/NLM PubMed Central Open Access Subset or Europe PMC; copyright remains with the publishers and authors.
💬 Discussion
0 commentsNo comments yet. Be the first to start a discussion!
Leave a Comment