Abstract
Methods for tuning extracellular matrix (ECM) mechanics in 3D cell culture that rely on increasing the concentration of either protein or cross-linking molecules fail to control important parameters such as pore size, ligand density, and molecular diffusivity. Alternatively, ECM stiffness can be modulated independently from protein concentration by mechanically loading the ECM. We have developed a novel device for generating stiffness gradients in naturally derived ECMs, where stiffness is tuned by inducing strain, while local mechanical properties are directly determined by laser tweezers based active microrheology (AMR). Hydrogel substrates polymerized within 35 mm diameter Petri dishes are strained non-uniformly by the precise rotation of an embedded cylindrical post, and exhibit a position-dependent stiffness with little to no modulation of local mesh geometry. Here we present the device in the context of fibrin hydrogels. First AMR is used to directly measure local micromechanics in unstrained hydrogels of increasing fibrin concentration. Changes in stiffness are then mapped within our device, where fibrin concentration is held constant. Fluorescence confocal imaging and orbital particle tracking are used to quantify structural changes in fibrin on the micro and nano levels respectively. The micromechanical strain stiffening measured by microrheology is not accompanied by ECM microstructural changes under our applied loads, as measured by confocal microscopy. However, super-resolution orbital tracking reveals nanostructural straightening, lengthening, and reduced movement of fibrin fibers. Furthermore, we show that aortic smooth muscle cells cultured within our device are morphologically sensitive to the induced mechanical gradient. Our results demonstrate a powerful cell culture tool that can be used in the study of mechanical effects on cellular physiology in naturally derived 3D ECM tissues.
🔬 Techniques
✨ Fluorophores
🧪 Sample Preparation
🏭 Microscope Brands
🧪 Reagent Suppliers
🔴 Lasers
🔎 Objectives
💻 Software Details
🏛️ Research Organizations (ROR)
Affiliated research institutions:
📋 Methods
Fibrin hydrogels Bovine fibrinogen (Sigma) solutions (2.5, 5, or 10 mg/ml) were prepared in 1× PBS or plain basal media under sterile conditions. In gels prepared for AMR, 20 µ l of a 20 µ g/ml solution of 2 µ m diameter silica beads and 50 µ l fetal bovine serum (FBS) were mixed with the sterile-filtered fibrinogen solution for every 1 ml of gel. 1 ml of this final gel solution was added to 20 µ l of polymerization-initiating thrombin (Sigma, 50 U/ml) previously aliquoted into a 35 mm glass bottom Petri dish (No. 1.5 glass, Matek). FBS contains factor XIII, a zymogen that contributes to the cross-linking of the fibrin gel when activated to by thrombin. Acellular solutions were left undisturbed for 30 min at room temperature until gelation was complete. For cell-seeded fibrin, cells were incorporated along with microrheology beads and FBS, and gelation was completed in a standard cell culture incubator. To maintain gel hydration, 2 ml of PBS or media were added to the dish after gelation. Fluorescent fibrin gels were constructed with a 1∶10 ratio of fluorescent Alexa-488 fibrinogen (Invitrogen, Carlsbad, CA) to non-fluorescent fibrinogen. Parallel plate rheology Curing and mechanical characterization of the gel was accomplished in situ on an AR G2 rheometer (TA Instruments, New Castle, DE) equipped with a Peltier stage and configured with a 20 mm stainless steel parallel plate attachment. The Peltier stage was cooled to 4°C after which 320 µL of fibrinogen solution at 2.5, 5 or 10 mg/ml was injected into a 1050 µm gap between the plate and stage. The edge of the plate was sealed with silicone oil (Arcos Organics, Morris Plains, NJ) to prevent evaporation and the top plate was lowered to 1000 µm. The temperature was increased from 4°C to 37°C over five minutes and then held at 37°C for 45 minutes. Rheology was performed throughout the clotting at 1% strain and 1 rad/sec to confirm full gelation after 45 minutes as indicated by a plateau in the measure of the shear modulus, G′. After gelation, G′ was measured by a frequency sweep from 1 to 100 rad/sec at 1% strain. Strain sweeps were performed from 0.001 to 10 percent strain at a constant frequency of 1 radian/s. Five gels were measured at each concentration of fibrinogen for each measurement set.
Show full methods section
Fibrin hydrogels Bovine fibrinogen (Sigma) solutions (2.5, 5, or 10 mg/ml) were prepared in 1× PBS or plain basal media under sterile conditions. In gels prepared for AMR, 20 µ l of a 20 µ g/ml solution of 2 µ m diameter silica beads and 50 µ l fetal bovine serum (FBS) were mixed with the sterile-filtered fibrinogen solution for every 1 ml of gel. 1 ml of this final gel solution was added to 20 µ l of polymerization-initiating thrombin (Sigma, 50 U/ml) previously aliquoted into a 35 mm glass bottom Petri dish (No. 1.5 glass, Matek). FBS contains factor XIII, a zymogen that contributes to the cross-linking of the fibrin gel when activated to by thrombin. Acellular solutions were left undisturbed for 30 min at room temperature until gelation was complete. For cell-seeded fibrin, cells were incorporated along with microrheology beads and FBS, and gelation was completed in a standard cell culture incubator. To maintain gel hydration, 2 ml of PBS or media were added to the dish after gelation. Fluorescent fibrin gels were constructed with a 1∶10 ratio of fluorescent Alexa-488 fibrinogen (Invitrogen, Carlsbad, CA) to non-fluorescent fibrinogen. Parallel plate rheology Curing and mechanical characterization of the gel was accomplished in situ on an AR G2 rheometer (TA Instruments, New Castle, DE) equipped with a Peltier stage and configured with a 20 mm stainless steel parallel plate attachment. The Peltier stage was cooled to 4°C after which 320 µL of fibrinogen solution at 2.5, 5 or 10 mg/ml was injected into a 1050 µm gap between the plate and stage. The edge of the plate was sealed with silicone oil (Arcos Organics, Morris Plains, NJ) to prevent evaporation and the top plate was lowered to 1000 µm. The temperature was increased from 4°C to 37°C over five minutes and then held at 37°C for 45 minutes. Rheology was performed throughout the clotting at 1% strain and 1 rad/sec to confirm full gelation after 45 minutes as indicated by a plateau in the measure of the shear modulus, G′. After gelation, G′ was measured by a frequency sweep from 1 to 100 rad/sec at 1% strain. Strain sweeps were performed from 0.001 to 10 percent strain at a constant frequency of 1 radian/s. Five gels were measured at each concentration of fibrinogen for each measurement set.
Active microrheology instrumentation
Our optical instrumentation is an expansion of a passive microrheology instrument previously described [32] and diagramed in Fig. 1A . The instrument is a custom modified Olympus IX81 inverted microscope mounted on a vibration dampening SMART table (Newport). Trapping is achieved by a 1064 nm Ytterbium fiber laser (IPG) steered by XY scanning galvanometer mirrors (Thorlabs). The trapping beam is expanded by lenses L2 ( f = 400 mm) and L4 ( f = 500 mm) and focused into the sample by a PlanApo 1.45 NA 60× oil immersion objective (Olympus USA). A 30 mW 785 nm diode laser (World Star Tech) is expanded by lenses L3 ( f = 150) and L4 ( f = 500 mm) for particle position detection. The two laser beams are combined by a dichroic beamsplitter D1 (Semrock) and mixed into the microscope imaging path by a short-pass dichroic D2 (Chroma). The trapping beam is partially reflected by a microscope cover glass and focused by L1 (f = 50 mm) onto an XY position sensitive photodiode (PSD, Pacific Silicon Sensor) to monitor the position of the beam during scanning. Forward scattered 785 nm light is refocused by lenses L5 ( f = 50 mm) and L6 ( f = 35 mm) onto a quadrant photodiode (QPD, New Focus) positioned conjugate to the back focal plane of our objective lens, while forward scattered 1064 nm light is reflected by a short-pass dichroic D3 (Chroma Technology) to overfill a photodiode (ZPD) for z-position detection (not implemented in this study). 10.1371/journal.pone.0020201.g001 Figure 1 Laser tweezers active microrheology. (A) Active microrheology instrumentation. A trapping laser (1064 nm) and particle position detection laser (785 nm) are combined and focused by the microscope objective into the device, which is mounted in a piezoelectric microscope stage. Forward scattered light is collected by the microscope objective and directed towards the QPD after passing through a filter designed to isolate the 785 nm beam. (B) Illustration of a laser trapped bead bound in a fibrous ECM and oscillated by laser tweezers. Both the trapping (red) and particle detection (orange) laser foci are incident onto the bead. As drawn the trapping beam is applying a leftward force to the bead. (C) Sample AMR loss modulus, G″, measured in water at room temperature reports a viscosity of 1±0.7 cP determined from a linear fit, R 2 = 0.997. We previously determined 2 um diameter beads were appropriate for microrheology in 2.5, 5, and 10 mg/ml fibrin gels [32] . A sinusoidal optical trap oscillated microbeads embedded within fibrin gels. An oscillating microbead steers the detection laser across the QPD, which outputs three analog signals: diff( X ), diff( Y ), and sum. PSD and QPD signals were sampled at 10 kHz for 5 seconds by a multifunction data acquisition board (M-series DAQ, National Instruments). The X and Y signals were normalized by the sum signal to compensate for small changes in average laser intensity. For each bead, five replicate signals were collected at 5, 10, 20, 50, 100, and 200 Hz for an oscillation amplitude of 60 nm. Hardware and data acquisition were controlled via custom LabVIEW software.
Active microrheology calibration
PSD signals were calibrated by imaging the partial back reflection of the trapping beam as it was steered across a stage micrometer. QPD signals were calibrated by transversely sweeping a laser-trapped 2 µm bead through the focus of the 785 nm detection beam in a stepwise manner (5 nm per step). From calibration experiments it was determined that QPD signals were linear with respect to bead displacement if displacements were less than 150 nm. Optical trap stiffness was 30.3±0.5 pN/µm as determined by the power spectrum method as previously described [32] .
Active microrheology analysis
The forcing function acting on a bead was calculated from calibrated laser and bead position signals as described by Brau et al. [33] . The laser trap position function given by (1) is obtained from the Fourier transform of the calibrated PSD signal, where is the amplitude of the transform at the forcing frequency ω. The bead oscillation function given by (2) is obtained from the Fourier transform of the calibrated QPD signal, where is the bead oscillation amplitude and is the phase lag induced by material resistance. The forcing function acting on the bead is calculated from the difference between and (3) where is the amplitude of the forcing function and is the phase lag between and . As previous described by Mizuno et al. [34] , the apparent complex response function ,which includes the contribution from trapping forces is (4) where and are the Fourier transforms of and respectively. If the total laser trap contribution is (5) where is the stiffness of the trapping beam, and is the stiffness of the detection beam, then the corrected response function is (6) , which effectively removes the contribution of optical forces from the measured material properties. Thus, the complex shear modulus G(ω) given by (7) can be calculated from by (8) where ‘ a ’ is the radius of the bead. An oscillating bead does work on the local matrix ( Fig. 1B ), which can either elastically store energy or dissipate it through viscous losses. The elastic and viscous nature of the matrix surrounding a bead is represented by the real and imaginary components of respectively. We validate system performance prior to each experiment by measuring the shear modulus spectra of water ( Fig. 1C ). Smooth muscle cell culture in 3-D fibrin hydrogels Primary human aortic smooth muscle cells (AoSMC, Lonza) were cultured in SmBM Basal Media (Lonza) supplemented with a SmGM-2 BulletKit (Lonza) at 37°C and 5% CO 2 . The BulletKit contains 5% (v/v) fetal bovine serum, 0.2% (v/v) human basic fibroblast growth factor, 0.1% (v/v) insulin, gentomycin/amphotericin, and human epidermal growth factor. AoSMC-seeded fibrin gels for microrheology experiments were constructed by first dissolving fibrinogen in FBS-free media and then adding cells at 50,000 cells per 1 ml. Gelation was initiated as described above and cells between passages 5 and 7 were used for all experiments. For strain gradient device experiments, cells were cultured in 2.5 mg/ml fibrin gels at 500,000 cells/ml in media supplemented with epsilon-amino-N-caproic acid (e-ACA) at 3 mM to inhibit plasmin mediated fibrin gel degradation [35] . Strain gradients were induced on day 2 and on day 9 gels were formalin fixed and stained for F-actin with Alexa-488 phalloidin per the manufacturer's protocol (Invitrogen).
Strain gradient device
A novel device capable of applying non-uniform strain gradients in a gel polymerized within a 35 mm glass-bottom Petri dish was designed by our group and machined in a facility specializing in medical devices (R.L. Bennett Engineering). The dish is held in a custom-designed stage insert, which also serves as an anchoring point for a cantilever arm housing a leadscrew, spring plunger assembly, lever arm, and rotating post ( Fig. 2 ). The position of the cantilever arm and post is variable in one dimension from the center of the dish to the edge of the imaging area. Translational motion of the leadscrew pushes the lever arm, which is directly coupled to the post and resisted by the spring plunger assembly. After a gel is polymerized in the dish and around the post, rotation of the post induces a strain gradient within the gel. A drawing package is provided online ( File S1 ). 10.1371/journal.pone.0020201.g002 Figure 2 Shear gradient device. (A) Photograph of the assembled device containing a fibrin gel and media containing phenol red. CAD drawings showing: (B) trimetric view of the assembled device, (C) transverse section through a plane dissecting the lever arm, (D) vertical section through the center of the post. The device comprises a post (a) held by a cantilever arm (b), which houses a leadscrew (c) and spring-plunger assembly (d,e) held rigidly by a lead screw block (f). As the thumbscrew is rotated inwards, it pushes the lever arm (g) causing a counter clockwise rotation of the post as viewed from above. As the thumbscrew is rotate out, the spring-plunger assembly pushes the lever arm in the opposite direction causing clockwise rotation of the post. A stage insert (h) houses a Petri dish (i) containing the ECM. Finite element model of shear strain A Finite Elements Analysis (FEA) was performed with the commercial software ABAQUS (Dassault Systèmes Simulia Corp.) to calculate strain profiles along radial and circumferential paths. The modeling space was two-dimensional, with plane stress conditions. The walls of the dish and the plug were each modeled with 200 discrete rigid elements (R2D2), whereas the gel was modeled with 4600 quadratic solid elements, with reduced integration (CPS8R). The gel was tied to both boundaries and assumed to behave as a hyperelastic, neo-hookean solid, with a Poisson's ratio of 0.8, and a true stress – true strain curve in agreement with Janmey et al [31] . The dish wall was fixed and the plug was rotated 2.4° counterclockwise about its center point, while being constrained in the radial direction.
Scanning confocal microscopy
Scanning confocal microscopy was performed using a fluoView1000 (Olympus USA) microscope equipped with a 10× air objective and a 60×, 1.2 NA UPLSAPO water immersion objective (Olympus USA). Samples were excited by a 488 nm Argon laser (Melles Griot) and imaged using standard FITC filters.
Fibrin mesh analysis
Pore size distributions of fluorescently labeled fibrin gels were obtained from confocal image stacks using a 100 nm step size. Confocal image stacks were reconstructed and segmented in 3D using Volocity (Perkin Elmer), a volumetric analysis software package. The software identifies all touching objects (fibers) within a user defined 3D region of interest (ROI) and segments discrete yet adjacent pores. We applied a lower volume threshold of 0.01 µm 3 . Three ROIs containing approximately 500 pores were analyzed per gel. 3D fiber imaging and tracking system All 3D fibrin fiber imaging and tracking experiments were performed on a custom built two-photon microscope based on an inverted IX70 Olympus microscope, similar to the one described previously [36] . For excitation, we used a mode-locked 80 MHz Ti: Sapphire laser (Chameleon Ultra, Coherent Inc.) with an integrated Verdi pump source. Laser pulses were 150 fs (FWHM) in width, laser average intensity was approximately 150 µW at the sample position, and excitation wavelength was 790 nm for all the tracking experiments. We used an UPlanFL N 60× 0.9 NA air objective (Olympus USA) and a short-pass dichroic mirror (700DCSPXR, Chroma Technology) to direct the excitation light into the sample. Additionally a HQ700LP filter (Chroma Technology) was positioned before the dichroic to filter out the Ti:Sapphire fluorescence. Three-dimensional scanning was obtained using galvanometer motor-driven scanning mirrors (6350, Cambridge Technology Inc.) with controller series 603× servo system (60335 FM, Cambridge Technology Inc.), and a PIFOC P-721 piezo-driven objective device (Physik Instrumente). Both the galvanometer and piezo were driven by an ISS 3-axis card (ISS). Fluorescence signal from the fibers was detected with a photomultiplier tube (H7422P-40, Hamamatsu) through an emission filter (ET680SP, Chroma Technology). Finally, signal was amplified (ACA-4-35N, Becker&Hickl), discriminated (6915, Phillips Scientific, NJ), and TTL pulses were counted by the ISS 3-axis data acquisition card. Experiments were controlled by a commercially available data acquisition program (SimFCS).
Orbital tracking method
The orbital tracking method has been previously described [37] . Briefly, during each cycle of the tracking routine, the excitation beam traces a circular orbit in a given position around the fiber. The orbit's radius is equal to half the waist of the microscope point spread function (PSF). In the experiments reported in this work, each orbit is in the x-z plane and takes 8 ms. The acquisition rate is chosen such that 128 points are measured during each orbit. After each cycle of the tracking routine, the DC value, AC value, and phase of the first harmonic are calculated on-the-fly by the Fast Fourier Transform (FFT). The modulation (defined as the ratio AC/DC) varies monotonically as the distance from the fiber to the center of the orbit is increased. For every measured value of modulation, we can calculate the distance of the fiber's center of mass from the center of the orbit to determine the coordinates of the fiber. The center of the orbit is relocated to the calculated center of mass. In other words, during the tracking routine the scanner follows the fiber's center of mass by changing its position to that calculated in the previous cycle. When the fiber position is determined with respect the x-z plane, the orbit is moved according to a linear ramp function incrementing the orbit position in the y-direction along the fiber and a new cycle of the tracking routine starts. Given the highly branched nature of the fibrin network, it is possible that tracking can erroneously deviate from one fiber to a neighboring fiber. As a control, we analyze orbit coordinates and fluorescence intensity as a function of time after tracking is complete. If the tracking jumps to a neighboring fiber, there will be an abrupt change in the modulation of the first harmonic and a spike in the intensity. Fibers were tracked a maximum distance of 10 µm over 120 seconds with a step size resolution of 56 nm. All measured fibers were located at least 3 µm above the cover slip to avoid surface effects. The y-position of the orbit was sequentially moved through approximately 1500 positions along each fiber. For display, the color of the reconstructed trajectory changes every 100 measured points.
Statistical analysis
All data are expressed as mean and standard deviation. The Student's t-test was used to test differences between means with a level of significance of 0.05, unless otherwise indicated.
Orbital tracking method
The orbital tracking method has been previously described [37] . Briefly, during each cycle of the tracking routine, the excitation beam traces a circular orbit in a given position around the fiber. The orbit's radius is equal to half the waist of the microscope point spread function (PSF). In the experiments reported in this work, each orbit is in the x-z plane and takes 8 ms. The acquisition rate is chosen such that 128 points are measured during each orbit. After each cycle of the tracking routine, the DC value, AC value, and phase of the first harmonic are calculated on-the-fly by the Fast Fourier Transform (FFT). The modulation (defined as the ratio AC/DC) varies monotonically as the distance from the fiber to the center of the orbit is increased. For every measured value of modulation, we can calculate the distance of the fiber's center of mass from the center of the orbit to determine the coordinates of the fiber. The center of the orbit is relocated to the calculated center of mass. In other words, during the tracking routine the scanner follows the fiber's center of mass by changing its position to that calculated in the previous cycle. When the fiber position is determined with respect the x-z plane, the orbit is moved according to a linear ramp function incrementing the orbit position in the y-direction along the fiber and a new cycle of the tracking routine starts. Given the highly branched nature of the fibrin network, it is possible that tracking can erroneously deviate from one fiber to a neighboring fiber. As a control, we analyze orbit coordinates and fluorescence intensity as a function of time after tracking is complete. If the tracking jumps to a neighboring fiber, there will be an abrupt change in the modulation of the first harmonic and a spike in the intensity. Fibers were tracked a maximum distance of 10 µm over 120 seconds with a step size resolution of 56 nm. All measured fibers were located at least 3 µm above the cover slip to avoid surface effects. The y-position of the orbit was sequentially moved through approximately 1500 positions along each fiber. For display, the color of the reconstructed trajectory changes every 100 measured points.
Supporting Information File S1 Drawing package of shear gradient device. The drawing package contains part-by-part drawings as well as assembly diagrams. The drawing packing is complete and can be submitted as is to a qualified machine shop. (PDF) Click here for additional data file.
📊 Figures
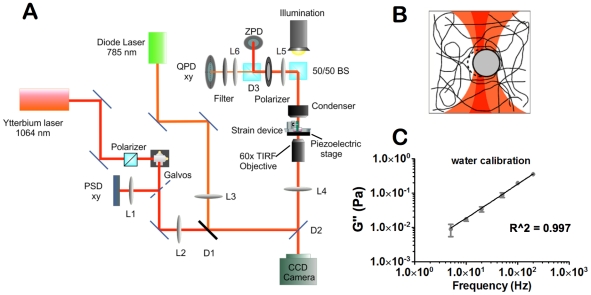
Figure 1
Laser tweezers active microrheology.
(A) Active microrheology instrumentation. A trapping laser (1064 nm) and particle position detection laser (785 nm) are combined and focused by the microscope objective into the device, which is mount...
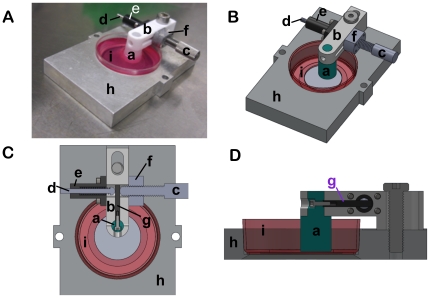
Figure 2
Shear gradient device.
(A) Photograph of the assembled device containing a fibrin gel and media containing phenol red. CAD drawings showing: (B) trimetric view of the assembled device, (C) transverse section through a plane...
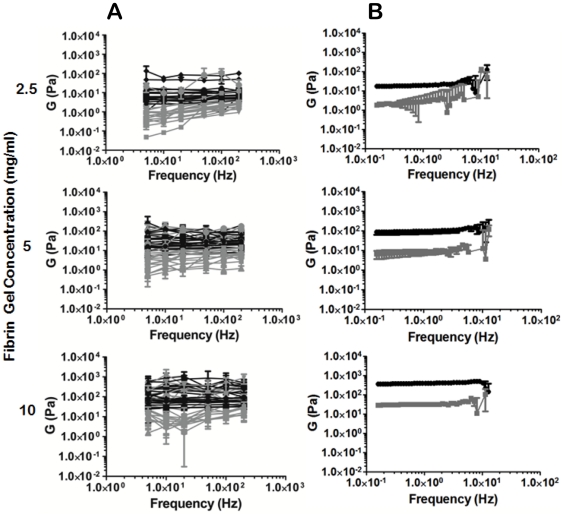
Figure 3
Microrheology reveals heterogeneity unresolved by parallel plate rheology.
Fibrin gels polymerized at 2.5, 5 and 10 mg/ml fibrin were measured by both AMR (A) and parallel plate rheology (B). Each curve in (A) represents AMR for a different bead measured at 5, 10, 20, 50, 10...
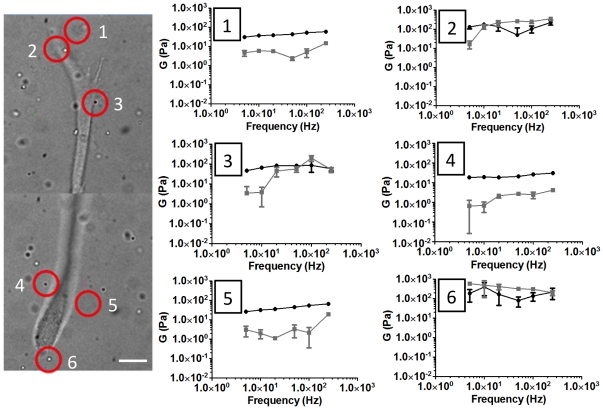
Figure 4
Microrheology reports local mechanical heterogeneity around a single cell.
An AoSMC cultured in a 3D fibrin gel polymerized at 2.5 mg/ml fibrin. Six beads proximal to the cell were chosen at random for AMR. Note the 10-fold difference in Gu2032 between beads 4 and 6. Blacku2...
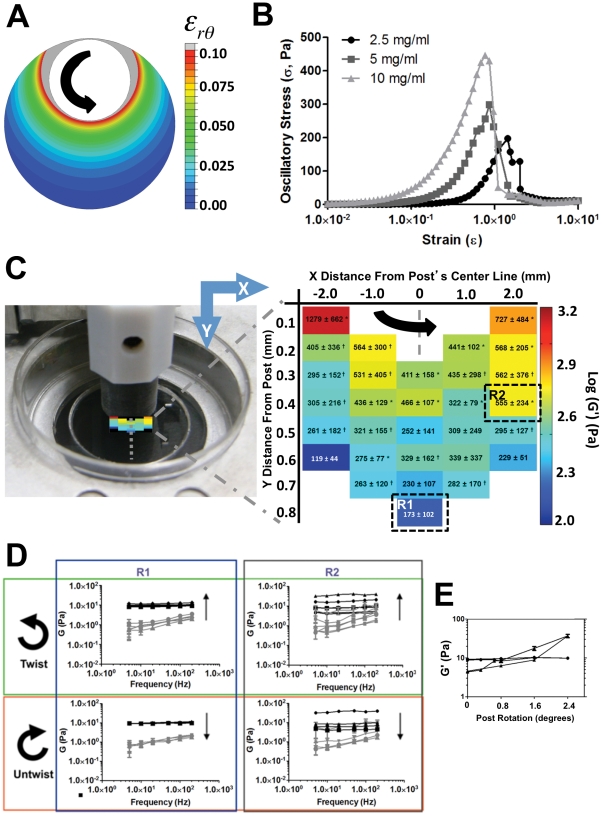
Figure 5
Microrheology within the strain gradient device.
AMR within a 2.5 mg/ml fibrin gel confirms location-dependent stiffening with rotation of the post. (A) FEA of shear strain, , in response to a 2.4u00b0 rotation of the post. (B) Stress-strain curves ...
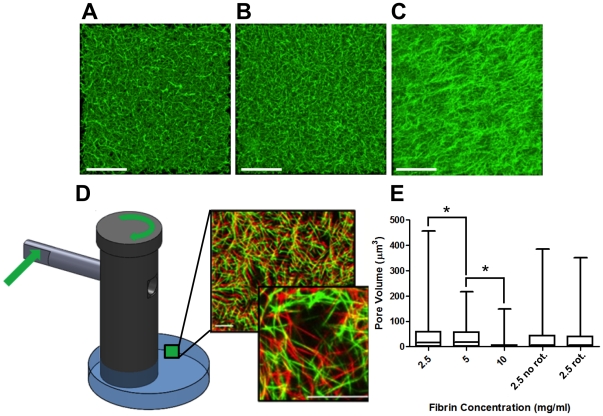
Figure 6
Matrix deformation does not accompany stiffening as observed by confocal microcopy.
Maximum projection images computed from confocal stacks of fluorescently labeled fibrin gels polymerized within a Petri dish at 2.5 (A), 5 (B) , or 10 (C) mg/ml show decreasing pore size with increasi...
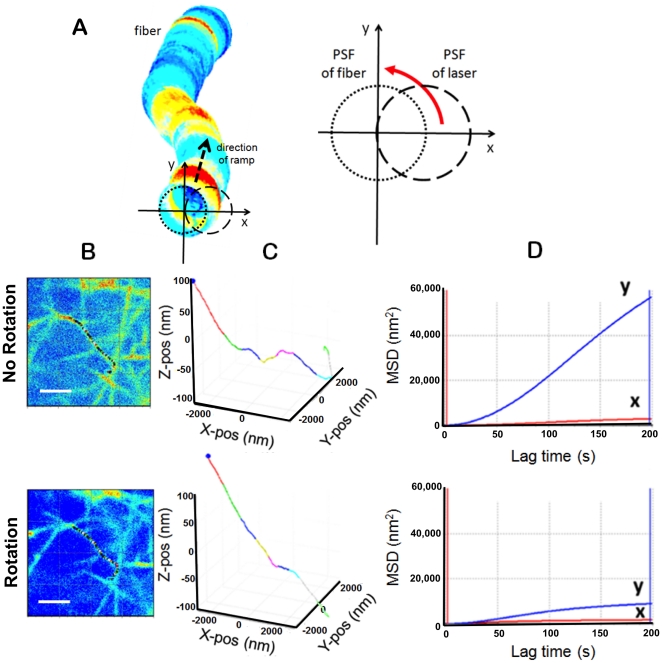
Figure 7
3D multiphoton orbital tracking shows nanostructural fiber changes.
(A) In 3D multiphoton orbital tracking the position of multiphoton fluorescence is calculated from intensity modulation of the point spread function as the laser is rapidly scanned in an orbit around ...
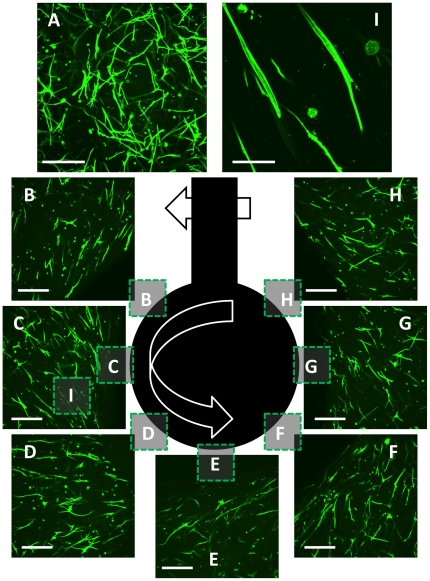
Figure 8
Aortic smooth muscle cells align with stiffness gradient.
AoSMCs were cultured in a fibrin gel polymerized at 2.5 mg/ml fibrin and subjected to rotation of the post by 2.4u00b0 on day 2. Cells were fixed and labeled with Alexa-488 Phalloidin on day 9 for con...
Figure images are served from the NIH/NLM PubMed Central Open Access Subset or Europe PMC; copyright remains with the publishers and authors.
💬 Discussion
0 commentsNo comments yet. Be the first to start a discussion!
Leave a Comment