Abstract
Photoactivated localization microscopy (PALM) and related fluorescent biological imaging methods are capable of providing very high spatial resolutions (up to 20 nm). Two major demands limit its widespread use on biological samples: requirements for photoactivatable/photoconvertible fluorescent molecules, which are sometimes difficult to incorporate, and high background signals from autofluorescence or fluorophores in adjacent focal planes in three-dimensional imaging which reduces PALM resolution significantly. We present here a high-resolution PALM method utilizing conventional EGFP as the photoconvertible fluorophore, improved algorithms to deal with high levels of biological background noise, and apply this to imaging higher order chromatin structure. We found that the emission wavelength of EGFP is efficiently converted from green to red when exposed to blue light in the presence of reduced riboflavin. The photon yield of red-converted EGFP using riboflavin is comparable to other bright photoconvertible fluorescent proteins that allow <20 nm resolution. We further found that image pre-processing using a combination of denoising and deconvolution of the raw PALM images substantially improved the spatial resolution of the reconstruction from noisy images. Performing PALM on Drosophila mitotic chromosomes labeled with H2AvD-EGFP, a histone H2A variant, revealed filamentous components of ∼70 nm. This is the first observation of fine chromatin filaments specific for one histone variant at a resolution approximating that of conventional electron microscope images (10-30 nm). As demonstrated by modeling and experiments on a challenging specimen, the techniques described here facilitate super-resolution fluorescent imaging with common biological samples.
🔬 Techniques
🧬 Organisms
💻 Software
✨ Fluorophores
🧪 Sample Preparation
🏭 Microscope Brands
🧪 Reagent Suppliers
📷 Detectors
🔎 Objectives
💻 Software Details
🏛️ Research Organizations (ROR)
Affiliated research institutions:
📋 Methods
An ethics statement is not required for this work.
Sample Preparation for Fluorescent Proteins
Our custom bacterial expression vector pETBio was made by inserting a synthetic oligonucleotide encoding a biotinylation peptide (GLNDIFEAQKIEWHED, [58] ) followed by a flexible linker with a multicloning site ( Eco RI, Kpn I, Age I and Bam HI) into the Nde I- Sac I site of pET28a (Novagen). A PCR fragment containing the full coding region of EGFP (S65T and a neutral mutation of Q80R) amplified from pC4BAvDGFP [59] was inserted into the Kpn I- Bam HI site of pETBio and nucleotide sequence was confirmed by sequencing the insert. The resulting fluorescent proteins, when expressed in E. coli strain BL21(DE3) (Invitrogen) cotransformed with pACYC-184 (AVIDITY), which has the biotin ligase birA gene, along with 10 mM biotin for biotinylation, protein would have a 6x His tag at the N-terminus followed by the biotinylated peptide and fluorescent protein. The fluorescent proteins in 10 ml E. coli grown in LB medium were solubilized by BugBaster (Novagen) and purified by Talon column (Clontech). The protein solution was dialyzed against PBS and insoluble protein was removed by brief centrifugation. The typical yield of fluorescent proteins was 0.4 mg. Solution for Photoconversion The components of RiMOS are 0.01 mM riboflavin (BioRad), 1 mM DL-methionine (Sigma), 0.5 mg/ml glucose oxidase (Sigma), 40 µg/ml catalase (Sigma), 5% glucose, 60 mM PIPES (pH 7.0). Riboflavin stock solution consisted of 0.1 mM riboflavin and 0.02 N HCl and can be stored at 4°C for 6 months. Methionine was prepared as 100 mM concentration in water freshly from powder every time. Glucose oxidase was prepared as 10 mg/ml stock solution in phosphate-buffered saline (PBS) and stored at 4°C for a few months. Catalase was prepared as a 2 mg/ml stock in PBS and stored at 4°C for 2 weeks. Glucose was prepared as 10% filter-sterilized stock solution and stored at 4°C. PIPES was prepared as 1 M stock (pH adjusted by NaOH) and used to compensate pH change by gluconic acid produced by glucose oxidase activity. RiMOS should be combined with an appropriate salt/buffer such as PBS at 1X final concentration. Photochemical Spectra EGFP solution was diluted to 30 µM or 1 µM for absorbance or fluorescent spectrum measurements, respectively, in PBS or PBS/RiMOS. Absorbance was measured with a 8453 UV-Visible spectrophotometer (Agilent), normalized with either PBS or PBS/RiMOS. Excitation/emission spectra were measured with Fluoromax-3 spectrofluorometer (HORIBA) at 25°C. To make an oxygen-free environment, a layer of light mineral oil was put on top of the protein solution containing RiMOS and incubated for 1 hr at room temperature. For photoconversion, cuvettes were put behind a collimator (which broadened the light to about the size of the cuvet) on the light path of the microscope laser (488 nm, ∼80 mW) for 30–60 min at 23°C. EGFP Imaging Sample Preparation For E. coli imaging, a solution of E. coli expressing fluorescent protein was incubated on the poly-L-lysine coated cover slip (Gold seal, No. 1.5) for 15–30 min at room temperature, then washed with mounting media. For single molecule imaging, cover slips were cleaned with a plasma cleaner (Solaris Model 950, Gatan) with an H 2 /O 2 mixture for 2 min, then coated with poly-L-lysine. EGFP protein (10 ng/ml in PBS) was absorbed onto the surface for 30 min at room temperature. The cover slips were extensively washed with PBS, and mounted with PBS or PBS/RiMOS. The cover slips were sealed with rubber cement.
Show full methods section
An ethics statement is not required for this work.
Sample Preparation for Fluorescent Proteins
Our custom bacterial expression vector pETBio was made by inserting a synthetic oligonucleotide encoding a biotinylation peptide (GLNDIFEAQKIEWHED, [58] ) followed by a flexible linker with a multicloning site ( Eco RI, Kpn I, Age I and Bam HI) into the Nde I- Sac I site of pET28a (Novagen). A PCR fragment containing the full coding region of EGFP (S65T and a neutral mutation of Q80R) amplified from pC4BAvDGFP [59] was inserted into the Kpn I- Bam HI site of pETBio and nucleotide sequence was confirmed by sequencing the insert. The resulting fluorescent proteins, when expressed in E. coli strain BL21(DE3) (Invitrogen) cotransformed with pACYC-184 (AVIDITY), which has the biotin ligase birA gene, along with 10 mM biotin for biotinylation, protein would have a 6x His tag at the N-terminus followed by the biotinylated peptide and fluorescent protein. The fluorescent proteins in 10 ml E. coli grown in LB medium were solubilized by BugBaster (Novagen) and purified by Talon column (Clontech). The protein solution was dialyzed against PBS and insoluble protein was removed by brief centrifugation. The typical yield of fluorescent proteins was 0.4 mg. Solution for Photoconversion The components of RiMOS are 0.01 mM riboflavin (BioRad), 1 mM DL-methionine (Sigma), 0.5 mg/ml glucose oxidase (Sigma), 40 µg/ml catalase (Sigma), 5% glucose, 60 mM PIPES (pH 7.0). Riboflavin stock solution consisted of 0.1 mM riboflavin and 0.02 N HCl and can be stored at 4°C for 6 months. Methionine was prepared as 100 mM concentration in water freshly from powder every time. Glucose oxidase was prepared as 10 mg/ml stock solution in phosphate-buffered saline (PBS) and stored at 4°C for a few months. Catalase was prepared as a 2 mg/ml stock in PBS and stored at 4°C for 2 weeks. Glucose was prepared as 10% filter-sterilized stock solution and stored at 4°C. PIPES was prepared as 1 M stock (pH adjusted by NaOH) and used to compensate pH change by gluconic acid produced by glucose oxidase activity. RiMOS should be combined with an appropriate salt/buffer such as PBS at 1X final concentration. Photochemical Spectra EGFP solution was diluted to 30 µM or 1 µM for absorbance or fluorescent spectrum measurements, respectively, in PBS or PBS/RiMOS. Absorbance was measured with a 8453 UV-Visible spectrophotometer (Agilent), normalized with either PBS or PBS/RiMOS. Excitation/emission spectra were measured with Fluoromax-3 spectrofluorometer (HORIBA) at 25°C. To make an oxygen-free environment, a layer of light mineral oil was put on top of the protein solution containing RiMOS and incubated for 1 hr at room temperature. For photoconversion, cuvettes were put behind a collimator (which broadened the light to about the size of the cuvet) on the light path of the microscope laser (488 nm, ∼80 mW) for 30–60 min at 23°C. EGFP Imaging Sample Preparation For E. coli imaging, a solution of E. coli expressing fluorescent protein was incubated on the poly-L-lysine coated cover slip (Gold seal, No. 1.5) for 15–30 min at room temperature, then washed with mounting media. For single molecule imaging, cover slips were cleaned with a plasma cleaner (Solaris Model 950, Gatan) with an H 2 /O 2 mixture for 2 min, then coated with poly-L-lysine. EGFP protein (10 ng/ml in PBS) was absorbed onto the surface for 30 min at room temperature. The cover slips were extensively washed with PBS, and mounted with PBS or PBS/RiMOS. The cover slips were sealed with rubber cement.
Chromosome Sample Preparation for PALM
As a phyisological buffer to protect chromosome integrity, Buffer A (15 mM PIPES (pH 7.0), 80 mM KCl, 20 mM NaCl, 2 mM EDTA, 0.5 mM EGTA, 0.5 mM spermidine, 0.2 mM spermine, 15 mM beta-mercaptoethanol), which was designed to protect polytene chromosome structure [6] , was used as the primary buffer. In some experiments, instead of buffer A, PBS(+) was used, which is a variant of PBS supplemented with 0.9 mM CaCl 2 and 0.33 mM MgCl 2 . The fixation buffer consists of 2–3% formaldehyde, 1 µg/ml DAPI and Buffer A or PBS(+). The mounting medium consists of 15% glycerol, RiMOS and Buffer A or PBS(+). Cover slips (Gold seal, No. 1.5) were cleaned with a plasma cleaner (Gatan) with H 2 /O 2 for 2 min, then coated with poly-L-lysine. Fresh fly embryos collected from H2AvD-EGFP expressing fly [59] were aged 1.5 hr at room temperature. Then embryos were dechorionated by hand, put on a 1–2% agarose gel with 0.1 mM EDTA (as preservative) and the nuclear division cycle was followed by our low magnification fluorescent microscope “LMX” [36] . On LMX, EGFP fluorescence was observed by Hg lamp using FITC filter set, with the illumination intensity reduced to 25% by a diaphragm. Syncytial blastoderm embryos at mitotic cycle 12 or 13 were picked up, put on the cover slip close to a drop of the fixation buffer (0.5 µl) on the center of the cover slip, and the embryo was punctured by forceps and momentarily mixed with the fixation buffer. This is incubated for 5–15 min at 23°C in a moist chamber, then 4.5 µl of mounting medium was added, mounted on a glass slide, and sealed with rubber cement. The slide was incubated at room temperature for 1 hr to enzymatically remove oxygen. PALM Image Acquisition The PALM images were taken by our custom wide-field microscope platform, “OMX” [36] , [60] . The objective lenses used were UPlan-SApo 100x PSF NA 1.40 oil-immersion (Olympus) and UApo 150x TIRF NA 1.45 oil-immersion (Olympus), corresponding to the CCD pixel size of 0.0792 and 0.0528 µm, respectively. Type DF immersion oil of refractive index 1.515 (Cargille) was used. Red fluorescence from red EGFP was excited by a 532 nm laser (36.5 W/mm 2 ) or a 560 nm laser (20.0 W/mm 2 ). Exposure times were 30 and 50 ms for 100x and 150x objectives, respectively. The cameras used were back-thinned EMCCD cameras (Andor iXon897) with EM gain setting 220 at a readout speed of 10 MHz. Photoconversion was induced by short pulse (10–50 ms) of 488 nm laser (21.3 W/mm 2 ) once every ten time frames. When many EGFP molecules were available, exposure to excitation light of 532 nm alone could photoconvert enough population of EGFP into red ( Figure S1C ). Often even with 532 nm illumination, photoconversion was too much and therefore the first 6,000–10,000 time frames were used only to bleach some EGFP population and its image was not used for reconstruction. Increasing shutter closure time between each 532 nm excitation also helped to reduce unfavorable photoconversion. For correction of stage drift, chromosome images stained with DAPI were taken once every 200 time frames with a 405 nm laser (1.34 W/mm 2 ) with 10 ms exposure. The images were used afterwards for drift correction during PALM reconstruction. A typical PALM raw image consists of 15,000–25,000 time frames of 256×512 pixel images. PALM Image Pre-Processing A small region of interest (typically about 200×200 pixels) of a raw image was cut out, then processed with 2D (xy) or 3D (xyt) denoising [35] . The denoised images were then deconvolved with a point spread function (PSF) carefully averaged over 30 bead images prepared for each objective, with a very small vertical axis increment of 20–40 nm to find the exact focal plane more accurately. The averaging was done with our custom Python program, which takes into account the fact that the lateral center of the PSF may change along with the vertical axis. Constrained iterative deconvolution was performed as described [61] using the enhanced-ratio method with a Wiener value of 0.8 for 30 iterations. Drift correction images were also subjected to 2D denoising.
PALM Reconstruction
PALM reconstruction of denoised and deconvolved images was done with our custom software written in Python. The program consists of six steps. The first step is automatic thresholding and least-square fitting of local maxima with an elliptical Gaussian function to deduce the peak intensity, position, width in two dimensions, and the background intensity. The second step rejects peaks that are too dim, too wide, too sharp or too skewed. Here the correct cutoff value is difficult to know beforehand, since denoising and deconvolution tend to modify original peak shapes. Therefore the program adaptively finds the cut off value from the distribution of the main population ( Figure S6 ). Peaks with irregular shapes were thrown away. This cleans up false positives from the final reconstructed image with improved resolution ( Figure S6C ). The third step estimates and corrects for the stage drift. A correction image (usually a DAPI image) was processed sequentially with denoising, a Mexican-hat filter, and a Wiener-type high-pass filter using a Gaussian distribution as a contrast transfer function then cross-correlated with a similarly treated reference image. The lateral movement was estimated by Gaussian fitting of the peak of the cross-correlated images and the movement over time was smoothened with a low-pass Gaussian filter.
Drift between successive
PALM raw images is then interpolated from this movement estimated from the correction images. Finally, the coordinates of peaks were shifted by these calculated drift values. The fourth step is grouping and summation of identical molecules at the same position through time. The allowable distance for identification of peaks as the same molecules was 40 nm. The program also takes into account the fact that single molecules tend to blink in fluorescence intensity, and thus a fluorescent peak reappeared after a short dark state (shorter than 50 ms in the present case) can still be regarded as the same molecule. Images of fluorescent peaks spanning multiple time frames are translated to compensate stage drift, summed up and each peak was again fitted to a Gaussian function. Rejection of peaks was repeated with cut off values determined in step 2. The fifth step converts peak attributes to meaningful values, such as intensity to number of photons (peak and background), pixel to µm. Again, peaks with too dim or too high backgrounds were rejected based on the distribution. The sixth step reconstructs a high-resolution image from the peak information. Each peak was rendered as a Gaussian peak with constant full width at half maximum (FWHM) value (25 nm in the case of Figure 3 ). The image was zoomed up by a factor to satisfy the Nyquist-Shannon sampling theorem. Thus for FWHM of 25 nm, the final image was zoomed up to get a pixel size smaller than 12.5 nm. PALM reconstruction data were analyzed by our custom program associated with reconstruction software. Resolution limit by point density in reconstructed PALM images was calculated by taking the median of distances between nearest-neighbor points of each point in the reconstruction image and multiplying this value by two according to the Nyquist-Shannon sampling theorem. The resolution is also limited by localization precision of each point. This resolution limit was estimated from Figure 2E using signal to noise ratio. For example, for the calculation of the final resolution, if resolution limit by sampling rate was 8 nm, while resolution limit by localization precision was 30 nm, then 30 nm was the overall resolution in our criteria. PALM Simulation A 3D helix of 554.4 nm ×158.4 nm ×160.0 nm in xyz coordinates with a pitch of 79.2 nm and line width of 23.8 nm in 3D contained one point in every 7.92 nm in X dimension. Each point was rendered in a 3D Gaussian sphere with a FWHM of 79.2 nm. To make the simulated PALM images, a total of 3990 points were spread randomly over 10,000 time frames ( Figure 2A ). The mean number of photons recorded from single spots was set to about 250 with a normal distribution of variance of 50 photons. The mean lifetime of individual molecules was 40 ms (1.33 frame) with exponential distribution (lambda = 0.7), which was determined from real recordings of red EGFP single molecules (data not shown). Some points show blinking just like red EGFP proteins (exponential distribution of lambda 1.3, data not shown). This image was convolved with a real 3D point spread function (PSF) to make realistic diffraction spots. The PSF used for the convolution was obtained by averaging 30 3D PSFs acquired with our 100x objective (NA 1.40) and red fluorescent beads of 50-nm diameter (Molecular Probes) excited with a 532 nm laser. A 2D slice through the middle of the helix was used as raw PALM image. Noise images derived from actual PALM images of Drosophila chromosomes used the same lens and same excitation wavelength as PSF, but most EGFP molecules had been already photobleached. SNR was calculated by a mean peak height of PSF (11.15 photons) divided by the standard deviation of noise (in photon). For pre-processing raw PALM simulation images, we varied the denoising algorithm's parameters such as adaptivity [35] (0–2), number of iterations (4–6), and dimensionality (2 or 3), and they all gave almost identical results in terms of localization precision and point finding efficiency. Therefore, only the result using adaptivity 0, 4 iterations, and 2D processing was shown. Median filter in “2D filter” program of the Priism suite ( http://www.msg.ucsf.edu/IVE/ ) was performed with 1 iteration with 3×3 kernel size. Gaussian filter in Priism suite's “2D filter” was done with 5 iterations with 3×3 kernel size and a sigma size of 1.0 pixels. Iterations with a small Gaussian like this remove noise with minimum blurring effect unlike single convolution with a larger Gaussian. Deconvolution parameters were the same as above. PALM reconstruction from the simulated data did not use screening for photon number and noise level. Number of photon in the simulation was not as variable as in the real fluorophore ( Figure 1F ), even though we tried to mimic the real distribution. Various thresholds for point finding were tried and only the best result was shown. From these PALM results, the known and localized coordinates were compared and taken as the same spots if they were in the corresponding time frame and closer than a certain distance in 2D space. We used an approximated distance calculated by (1.22lambda)/(2NA) and divided by 2 (we only need radius). The resulting distance of 125 nm would be small enough to find the corresponding peak in the simulated time series since there is usually only one peak in this distance in a single time frame. If more than two points were found within 125 nm space, then closest point was chosen. One-dimensional error in localization precision was calculated by taking the average of each difference between known and localized coordinates in X and Y dimensions. One-dimensional localization precision was then calculated as the FWHM of the Gaussian fitting of the error distribution histogram, and then multiplied by 2√2ln2. The center of the histogram in the X direction was often not at zero ( Figure S2A ), probably due to spherical aberration, coma and, astigmatism in the microscope. This offset was very small (
📊 Figures
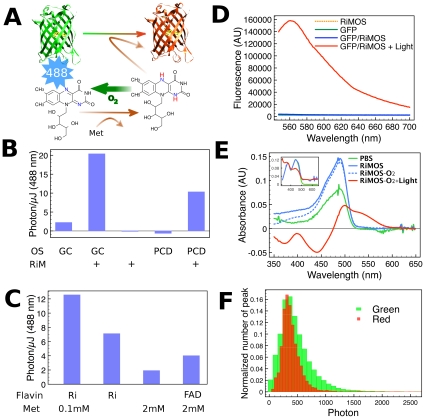
Figure 1
Photoconversion of EGFP by Reduced Flavin.
(A) Summary of interactions among EGFP (chromophore is shown yellow), riboflavin (chemical structure), methionine (Met), molecular oxygen (O 2 ), and blue light (488 nm wavelength). Photoreduction of ...
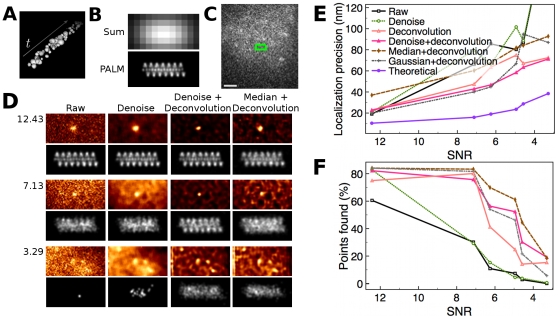
Figure 2
A Simulation of PALM Reconstruction in Relation to the Noise.
(A) Points making up a simulated helix with a pitch of 80 nm is confined in a 5,600 nm u00d7160 nm u00d7160 nm space, and randomly scattered over 10,000 time frames. This is convolved with a real poin...
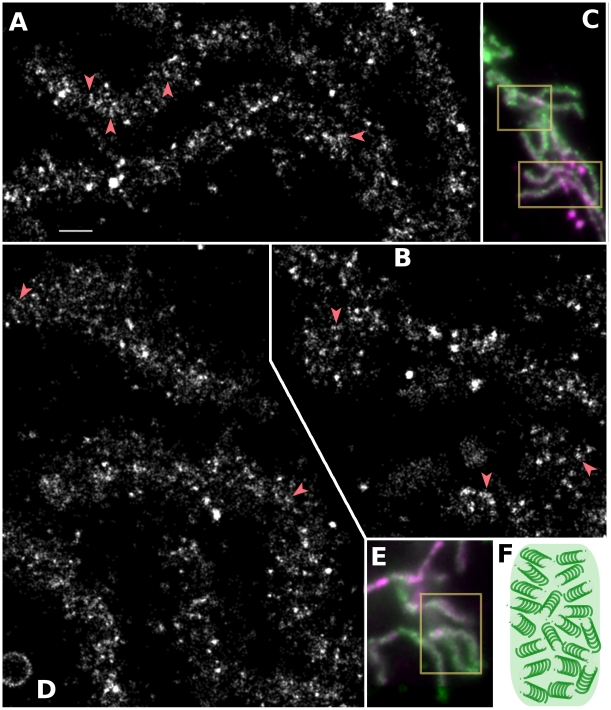
Figure 3
Drosophila Metaphase Chromosome Arms Consist of Fine Chromatin Fibers.
(A, B) PALM reconstruction of chromosome arms boxed in (C) free from cytoplasm. (D) PALM reconstruction of chromosome arms boxed in (E) surrounded by the cytoplasm. Red arrowheads point to typical fil...
Figure images are served from the NIH/NLM PubMed Central Open Access Subset or Europe PMC; copyright remains with the publishers and authors.
💬 Discussion
0 commentsNo comments yet. Be the first to start a discussion!
Leave a Comment