Abstract
Meningeal lymphatic vessels (MLVs) were identified in the dorsal and caudobasal regions of the dura mater, where they ensure waste product elimination and immune surveillance of brain tissues. Whether MLVs exist in the anterior part of the murine and human skull and how they connect with the glymphatic system and extracranial lymphatics remained unclear. Here, we used light-sheet fluorescence microscopy (LSFM) imaging of mouse whole-head preparations after OVA-A555 tracer injection into the cerebrospinal fluid (CSF) and performed real-time vessel-wall (VW) magnetic resonance imaging (VW-MRI) after systemic injection of gadobutrol in patients with neurological pathologies. We observed a conserved three-dimensional anatomy of MLVs in mice and humans that aligned with dural venous sinuses but not with nasal CSF outflow, and we discovered an extended anterior MLV network around the cavernous sinus, with exit routes through the foramina of emissary veins. VW-MRI may provide a diagnostic tool for patients with CSF drainage defects and neurological diseases.
🔬 Techniques
🔭 Microscopes
💻 Software
✨ Fluorophores
🧪 Sample Preparation
🏭 Microscope Brands
🧪 Reagent Suppliers
📷 Detectors
💻 Software Details
💾 Data Repositories
🏛️ Research Organizations (ROR)
Affiliated research institutions:
📋 Methods
Study approval
All in vivo procedures used in this study complied with all relevant ethical regulations for animal testing and research, in accordance with the European Community for experimental animal use guidelines (L358-86/609EEC). The study received ethics approval by the Ethical Committee of Institut National de la Santé et de la Recherche Médicale (no. 2020071714182580) and the Institutional Animal Care and Use Committee of Institut du Cerveau et de la Moelle épinière.
Human patients
Procedures in humans have been approved by our institutional review board (#CRM-2111-216; Comité d’Ethique pour la Recherche en Imagerie Médicale). After informed written consent, we retrospectively collected the clinical and radiological data of 11 patients who underwent MRI with gadobutrol injection according to the protocol described below. Five of them were explored for IIH, four for MS, one for unilateral JS, and one for a GSD. Radiological data were anonymized, and postprocessing was performed by two experienced neuroradiologists.
Animals Male and female
C57BL/6J mice, Vegfr3YFP ( Calvo et al., 2011 ), or Vegfr3-CreERT2 ; mTmG (unpublished, provided by Prof. Jason Butler, Hackensack University Medical Center, NJ) mice 2–4 mo of age were used for all experiments.
Intra-CSF injections of tracers in mice
ICM, thoracic-lumbar, and lumbar-sacral injections were performed in adult male and female C57BL/6J and Vegfr3YFP mice 8–10 wk of age. Mice were injected i.p. with Buprecare solution and anesthetized by Isoflurane gas (2–3%). Mice were maintained at the head or vertebral level of injection with a stereotaxic apparatus (Stoelting). The skin was incised at neck level, Th12-L1 (thoracic-lumbar injection) or L6-S1 (lumbar-sacral injection) vertebral levels. Muscles were moved to the side until the dura mater was exposed. Meninges were incised using a 30-gauge needle. 2 or 8 μl of OVA-A 555 (2 mg/ml; Alexa Fluor 555 Conjugate; O34782 ; Invitrogen) were injected through a microcapillary (Glass Capillaries; GC120-15; Harvard Apparatus) connected to a Hamilton syringe (10 μl). The microcapillary was introduced into one side of the spinal cord parenchyma or above the dura mater at the cisterna magna level. To avoid the release of OVA-A 555 during the injection, surgical glue was added to close the incision around the glass capillary. Injections were performed slowly (1 μl/min). Once injection was finished, the capillary was maintained for 2 min before retraction, and surgical glue was added to close the hole made by the capillary. Some tracer leak occasionally occurred despite these precautions, leading us to examine tracer drainage at a site distal to the injection site: i.e., cranial drainage was examined in mice after Th-Lb or Lb-Sc injection, while sacral drainage was injected after ICM injection. Tissue incisions were closed with Michel Suture Clips (7.5 × 1.75 mm; 12040-01; Fine Science Tool). After 15, 45, or 90 min, mice were euthanized and perfused as described. To study fluid drainage from the orbital cavity and the nostril, OVA-A 555 was injected into the periorbital space (5 μl) or under the skin at the tip of the nostril (2 μl), using a BD Micro-Fine syringe (0.3 ml; 783652 3; BD. Tracer drainage into scLNs was examined 10 or 5 min, respectively, after injection.
Show full methods section
Study approval
All in vivo procedures used in this study complied with all relevant ethical regulations for animal testing and research, in accordance with the European Community for experimental animal use guidelines (L358-86/609EEC). The study received ethics approval by the Ethical Committee of Institut National de la Santé et de la Recherche Médicale (no. 2020071714182580) and the Institutional Animal Care and Use Committee of Institut du Cerveau et de la Moelle épinière.
Human patients
Procedures in humans have been approved by our institutional review board (#CRM-2111-216; Comité d’Ethique pour la Recherche en Imagerie Médicale). After informed written consent, we retrospectively collected the clinical and radiological data of 11 patients who underwent MRI with gadobutrol injection according to the protocol described below. Five of them were explored for IIH, four for MS, one for unilateral JS, and one for a GSD. Radiological data were anonymized, and postprocessing was performed by two experienced neuroradiologists.
Animals Male and female
C57BL/6J mice, Vegfr3YFP ( Calvo et al., 2011 ), or Vegfr3-CreERT2 ; mTmG (unpublished, provided by Prof. Jason Butler, Hackensack University Medical Center, NJ) mice 2–4 mo of age were used for all experiments.
Intra-CSF injections of tracers in mice
ICM, thoracic-lumbar, and lumbar-sacral injections were performed in adult male and female C57BL/6J and Vegfr3YFP mice 8–10 wk of age. Mice were injected i.p. with Buprecare solution and anesthetized by Isoflurane gas (2–3%). Mice were maintained at the head or vertebral level of injection with a stereotaxic apparatus (Stoelting). The skin was incised at neck level, Th12-L1 (thoracic-lumbar injection) or L6-S1 (lumbar-sacral injection) vertebral levels. Muscles were moved to the side until the dura mater was exposed. Meninges were incised using a 30-gauge needle. 2 or 8 μl of OVA-A 555 (2 mg/ml; Alexa Fluor 555 Conjugate; O34782 ; Invitrogen) were injected through a microcapillary (Glass Capillaries; GC120-15; Harvard Apparatus) connected to a Hamilton syringe (10 μl). The microcapillary was introduced into one side of the spinal cord parenchyma or above the dura mater at the cisterna magna level. To avoid the release of OVA-A 555 during the injection, surgical glue was added to close the incision around the glass capillary. Injections were performed slowly (1 μl/min). Once injection was finished, the capillary was maintained for 2 min before retraction, and surgical glue was added to close the hole made by the capillary. Some tracer leak occasionally occurred despite these precautions, leading us to examine tracer drainage at a site distal to the injection site: i.e., cranial drainage was examined in mice after Th-Lb or Lb-Sc injection, while sacral drainage was injected after ICM injection. Tissue incisions were closed with Michel Suture Clips (7.5 × 1.75 mm; 12040-01; Fine Science Tool). After 15, 45, or 90 min, mice were euthanized and perfused as described. To study fluid drainage from the orbital cavity and the nostril, OVA-A 555 was injected into the periorbital space (5 μl) or under the skin at the tip of the nostril (2 μl), using a BD Micro-Fine syringe (0.3 ml; 783652 3; BD. Tracer drainage into scLNs was examined 10 or 5 min, respectively, after injection.
Tissue preparation and decalcification
Mice were given a lethal dose of sodium pentobarbital (Euthasol Vet) and perfusion-fixed through the left ventricle with 10 ml ice-cold PBS and 20 ml of 4% paraformaldehyde (PFA) in PBS. To dissect the head and the vertebrae, the skin was completely removed, all the organs were discarded, and the ribs were removed to keep only the vertebral column from the cervical part until the lumbar part with the spinal cord inside. All the surrounding tissues including muscles, eyes, salivary glands, and ligaments were maintained around the skull and the vertebral column. All samples were decalcified for 3 wk in 10% EDTA in 4% PFA/PBS. The head was cut with a microtome blade along coronal, horizontal, or sagittal axes into either three pieces corresponding to the cribriform plate, CAV, and jugular foramen regions or two pieces corresponding to either the dorsal-versus ventral or left-versus-right halves of the head. The spine was cut along the coronal or sagittal axis into pieces ∼0.8 cm thick (two to four vertebrae) corresponding to the cervical and the sciatic regions. The different sample segments were immediately immersed in ice-cold 4% PFA, fixed overnight at 4°C, washed in PBS, and processed for staining.
Sample pretreatment for iDISCO +
We used the immunolabeling-enabled 3D imaging of solvent-cleared organs protocol (iDISCO + , http://www.idisco.info ; Renier et al., 2014 ). The steadily increasing methanol concentrations result in modest tissue shrinkage (∼10%), and the transparency of tissues, such as the adult mouse brain, is increased. In detail, fixed samples were dehydrated progressively in methanol/PBS, 20, 40, 60, 80, and 100% for 1 h each with gentle agitation. They were then incubated overnight in a solution of methanol 33%/dichloromethane 66% (DCM; 270997-12 × 100 ml; Sigma-Aldrich). After 2 × 1 h washes with 100% methanol, samples were bleached with 5% H 2 O 2 in methanol (1 vol 30% H 2 O 2 /5 vol methanol) at 4°C overnight. After bleaching, samples were rehydrated in methanol for 1 h each, at 80, 60, 40, 20%, and PBS with gentle agitation. Samples were washed rapidly with PBS then incubated 2× 1 h in PTx2 (PBS and 0.2% Triton X-100). At this step, they were processed for immunostaining. iDISCO + immunolabeling protocol Pretreated samples were incubated in 20-ml glass bottles (DWK986546; Merck) in PBS/0.2% Triton X-100/20% DMSO/0.3 M glycine at 37°C for 24 h, and then blocked in PBS/0.2% Triton X-100/10% DMSO/6% donkey serum at 37°C for 24 h. Samples were incubated in primary antibody dilutions in PTwH (PBS and 0.2% Tween-20 with 10 mg/ml heparin)/5% DMSO/3% donkey serum at 37°C for 21 d. Samples were washed five times in PTwH until the next day and then incubated in secondary antibody dilutions in PTwH/3% donkey serum at 37°C for 14 d. Samples were finally washed in PTwH five times until the next day before clearing and imaging. We used the following primary antibodies: goat anti-mouse CD31 (1:1,000, AF3628; R&D Systems), chicken anti-GFP (1:2,000, GFP10-20; AVES), goat anti-mouse PDLX (1:1,000, AF1556; R&D Systems), rabbit anti-mouse LYVE1 (1:800, 11-034; AngioBio), goat anti-human PROX1 (1:1,000, AF2727; R&D Systems), rabbit anti-mouse TUJ1 (1:2,000, 802001; BioLegend), and rabbit anti-human vWF (1:300, A0082; Agilent). Primary antibodies were detected with the corresponding Alexa Fluor 555–, 647–, or 790–conjugated secondary antibodies from Jackson ImmunoResearch at 1/1,000 dilution. iDISCO + tissue clearing After immunolabeling, samples were dehydrated progressively in methanol in PBS, 20, 40, 60, 80, and 100% each for 1 h with gentle agitation. They were then incubated overnight in a solution of methanol 33%/DCM 66% followed by incubation in 100% DCM for 2× 1 h to wash the methanol. Finally, samples were incubated in dibenzyl ether (DBE; without shaking) until cleared (overnight) and then stored in DBE at room temperature before imaging.
LSFM and stereomicroscope imaging in mice
Cleared samples were imaged in transverse orientation with an LSFM (Ultramicroscope II, LaVision Biotec) equipped with a sCMOS camera (Andor Neo) and a 4×/0.3 objective lens (LaVision Biotec). Version 144 of Imspector Microscope controller software was used. The microscope chamber was filled with DBE. We used single-sided 3-sheet illumination configuration, with fixed x position (no dynamic focusing). The light sheet was generated by LED lasers (OBIS) tuned to 561 nm, 100 mW and 639 nm, 70 mW (LVBT Laser module 2nd generation). The light-sheet numerical aperture was set to 0.03. We used the following emission filters: 595/40 for Alexa Fluor 568 or 555, 680/30 for Alexa Fluor 647, and 830/780 for Alexa Fluor 790. Stacks were acquired using 4.5-μm z steps and a 30-ms exposure time per step, with an Andor CMOS sNEO camera. The 2× optical zoom was used for an effective magnification of 8×, 0.8 µm/pixel. Mosaic acquisitions were done with a 10% overlap on the full frame. Fluorescent stereo micrographs were obtained with AxioZoom.V16 fluorescence stereo zoom microscope (Carl Zeiss) equipped with an ORCA-Flash 4.0 digital sCMOS camera (Hamamatsu Photonics) or an OptiMOS sCMOS camera (QImaging).
LSFM image processing and analysis
For display purposes, a γ correction of 1.47 was applied on the raw data obtained from the light-sheet fluorescent microscope. Images acquired with Imspector acquisition software in TIFF format were converted with Imaris File Converter to IMS files. Mosaics were reconstructed with Imaris stitcher, and then Imaris software (Bitplane, http://www.bitplane.com/imaris/imaris ) was used to generate the orthogonal projections of data shown in all figures, perform area segmentation on a stack of image slices, and produce videos.
Paraffin section immunolabeling and imaging
Vertebrae were dehydrated through ethanol, cleared in xylene, and embedded in paraffin. Serial cross sections (5 µm thick) were immunostained with rabbit anti-mouse LYVE1 (1:100) polyclonal antibody (11-034; AngioBio Co.). 3,3′-diaminobenzidine staining was performed using the biotin avidin complex kit (PK-6100; VectastainVector). Masson’s trichrome staining was carried out using the Masson Trichrome Kit (BioGnost; MST-100T; BioGnost). Hematoxylin (5 s) was used for counterstaining. HRP-labeled paraffin sections were analyzed with a Zeiss Axio Scope.A1. Flow cytometry analysis of LN immune cells 90 min after spinal intrathecal injection of OVA-A 488 , mice were anesthetized with ketamine/xylazine. LNs (mandibular, accessory mandibular, deep cervical, sciatic, and lumbar) were dissected and processed as previously described ( Geraldo et al., 2021 ). LNs were digested with DMEM containing 2.5 mg/ml collagenase D and 5 U/ml DNase I for 20 min at 37°C. The digested tissue was passed through a 40-μm nylon cell strainer (Falcon), and red blood cells were lysed (Red Blood Cells Lysis buffer; Merck). After blocking with mouse FcR Blocking Reagent (MACS Miltenyi Biotec), single-cell suspensions were incubated with anti-CD45 BUV805 (clone 30-F11; BD), anti-CD11b BV421 (clone M1/70; BD), and anti-CD11c APC (clone N418; BD) antibodies. As a control, cells were stained with the appropriate isotype control. Data acquisition was performed on BD LSRFortessa X20, and analysis was performed with FlowJo_V10. MRI of dural and neck vasculature in humans Imaging was performed with an MRI 3.0 T Magnetom Skyra (Siemens Healthineers). The following sequences were used before gadobutrol injection: Coronal Whole Brain 3D FLAIR (Coronal 3D acquisition; field of view, 256 mm 2 ; 192 contiguous 1-mm slices; repetition and echo time [TR/TE], 5,000/375 ms; acquisition time, 6 min); Whole Brain T1 SPACE DANTE acquisition (Sagittal 3D acquisition, field of view 256 mm 2 ; 224 contiguous 0.80-mm slices; TR/TE, 7,000/22 ms; acquisition time, 6 min). The following sequences were performed in all patients after gadobutrol (0.1 mmol/kg body weight, i.v., NDC 50419-325-12; Bayer Health Care) injection: Contrast-enhanced MR venography with elliptical-centric technique (3D sagittal acquisition; field of view 250 mm 2 ; 208 contiguous 0.70-mm slices; TR/TE, 3.57/1.36 ms; acquisition time, 6 min); Coronal Whole Brain 3D FLAIR (Coronal 3D acquisition; field of view, 256 mm 2 ; 192 contiguous 1-mm slices; TR/TE, 5,000/375 ms; acquisition time, 6 min); Whole Brain T1 SPACE DANTE acquisition (Sagittal 3D acquisition; field of view, 256 mm 2 ; 224 contiguous 0.80-mm slices; TR/TE, 7,000/22 ms; acquisition time, 6 min). Eight patients were scanned with a 3D TOF sequence before gadobutrol injection. MRI postprocessing 3D reconstructions of structures of interest 3D-Slicer platform ( https://www.slicer.org ) was used for semiautomated signal intensity–based thresholding and segmentation of the native sequences. Accordingly, dural lymphatics, perisinusal enhancement, and cLNs were extracted based on the T1-weighted post-gadobutrol SPACE DANTE sequence. The venous system was extracted based on the contrast-enhanced MR venography with elliptical-centric technique. The brain was extracted based on the FLAIR sequence, and the internal carotid arteries were extracted based on either the 3D TOF sequence before gadobutrol injection or the T1w-SPACE DANTE post-gadolinium sequence. Fusion of the 3D reconstructions of the dural venous sinuses and MLVs confirmed that lymphatic vessels were not misdiagnosed as small slow-flow veins and allowed detailed analysis of veno-lymphatic relationships.
Volumetric quantification
Volumes were measured in mm 3 with the segment statistics module and Labelmap statistics by two blinded experienced neuroradiologists. All volumes including MLVs, dural venous sinuses, and brain volumes were normalized against the total intracranial volume (TIV). We used the module extension SwissSkullStripper ( http://www.slicer.org/wiki/Documentation/Nightly/Modules/SwissSkullStripper ) to automatically extract and measure the TIV by postprocessing the 3D T1 SPACE DANTE sequence. Normalized volumes were expressed as the ratio ([volume/TIV] × 10 −6 ). Total MLV volume was defined as the volume of MLVs covering the superior sagittal sinus, the straight sinus, and both lateral sinuses including the confluence of sinuses. Lateral sinus–related MLVs were defined as the MLVs covering both lateral sinuses and the confluence of sinuses as well. Straight- and superior sagittal-related MLVs were defined as the MLVs covering the straight sinus and the superior sagittal sinus, respectively, without the confluence of sinuses. Finally, CAV-related MLVs were defined as the MLVs covering the CAV, without neighboring MLVs along the trigeminal nerves and the inferior petrosal sinuses. Because the dural venous sinuses have very different volumes, we normalized the MLV volume against their related venous sinus volume using the MLV/vein ratio to compare the lymphatic coverage between dural sinuses.
Statistics
No statistical methods were used to predetermine sample size. Five to six mice were analyzed by experimental group ( n = 5–6 mice/group). The investigators were blinded during experiments and outcome assessment. Statistical data analysis was performed with Prism 6.0 software (GraphPad). For discrete variables (immune cell %), data are presented as mean SEM. A two-tailed, unpaired Mann–Whitney U test was done to determine statistical significance between two groups. For comparison between more than two groups, one-way ANOVA was performed, followed by Dunn’s multiple comparison test. Differences were considered statistically significant if the P value was 0.20–0.40), good (>0.40–0.75), or excellent (>0.75). Correlations between quantitative values were assessed with nonparametric Spearman correlation tests.
Graphic design
Illustration software was used to create Fig. 1 A and Fig. 6 A ( BioRender.com ). 3D-schemas of Figs. 1 E , 2 A , 3 A , 4 A , 4 B , 5 H , 5 N , 8 A , and S3 A as well as Videos 4 and 8 were generated using 3D-Blender, a free and open-source 3D computer graphics software toolset, from horizontal, sagittal, and coronal representations of the rat dural venous anatomy ( Scremin, 2004 ) and from horizontal, sagittal, and coronal head sections labeled with vascular markers. Online supplemental material Fig. S1 shows CSF tracer distribution after ICM and intraspinal injection. Fig. S2 shows LSFM imaging of OVA-A 555 tracer lymphatic drainage and OVA-A 555 accumulation around dural sinuses. Fig. S3 shows LSFM imaging of CSF drainage through the cribriform plate and inside the nasal cavity. Fig. S4 describes sacral spinal cord outflow. Fig. S5 shows meningeal and skull vascular MRI in humans. Videos 1 , 3 , 5 , 6 , 2 , and 7 are coronal (1, 3, 5, 6) and sagittal (2, 7) LSFM videos of clarified half-heads from mice sacrificed 45 min after intrathecal injection of OVA-A 555 into the caudal spine. Samples 4–6 were immunolabeled with anti-LYVE1 antibodies. Videos 4 and 8 are 3D schematics of the mouse meningeal blood vasculature and the cranial venolymphatic system, respectively.
Online supplemental material Fig. S1 shows CSF tracer distribution after ICM and intraspinal injection. Fig. S2 shows LSFM imaging of OVA-A 555 tracer lymphatic drainage and OVA-A 555 accumulation around dural sinuses. Fig. S3 shows LSFM imaging of CSF drainage through the cribriform plate and inside the nasal cavity. Fig. S4 describes sacral spinal cord outflow. Fig. S5 shows meningeal and skull vascular MRI in humans. Videos 1 , 3 , 5 , 6 , 2 , and 7 are coronal (1, 3, 5, 6) and sagittal (2, 7) LSFM videos of clarified half-heads from mice sacrificed 45 min after intrathecal injection of OVA-A 555 into the caudal spine. Samples 4–6 were immunolabeled with anti-LYVE1 antibodies. Videos 4 and 8 are 3D schematics of the mouse meningeal blood vasculature and the cranial venolymphatic system, respectively.
📊 Figures
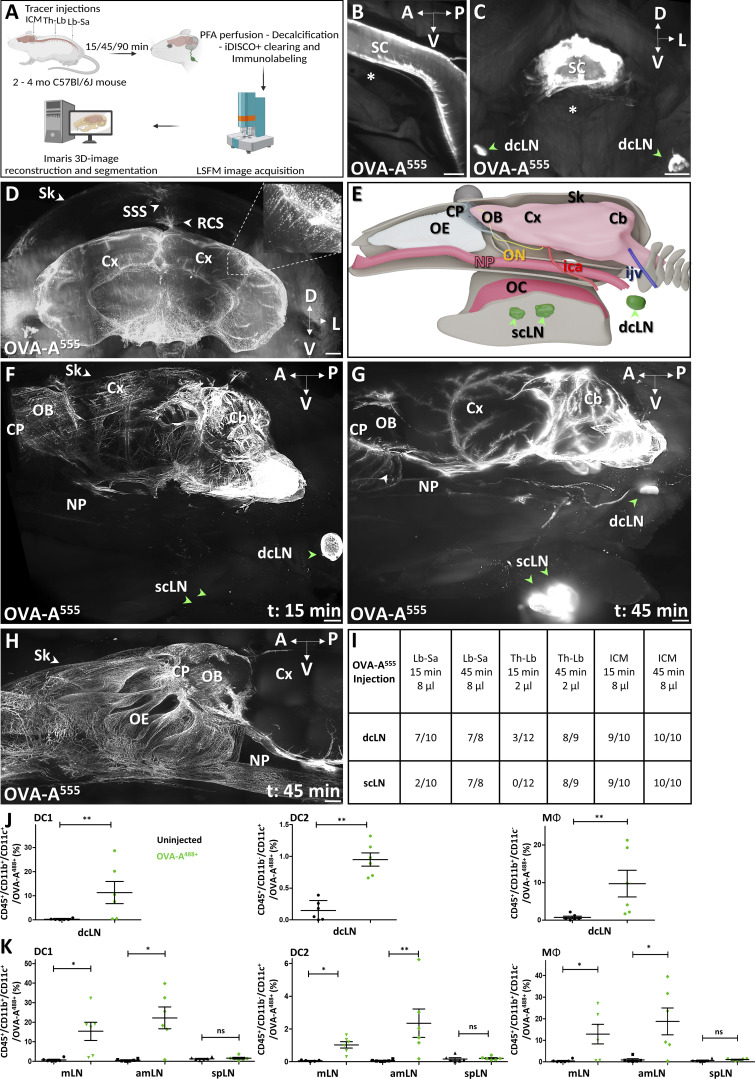
Figure 1.
iDISCO-LSFM imaging of CSF tracer drainage. (A) Schematic of the experimental workflow. Arrows indicate sites of tracer injection, ICM, Th-Lb, or Lb-Sa. (B) LSFM imaging of OVA-A555 (white) in the pia...
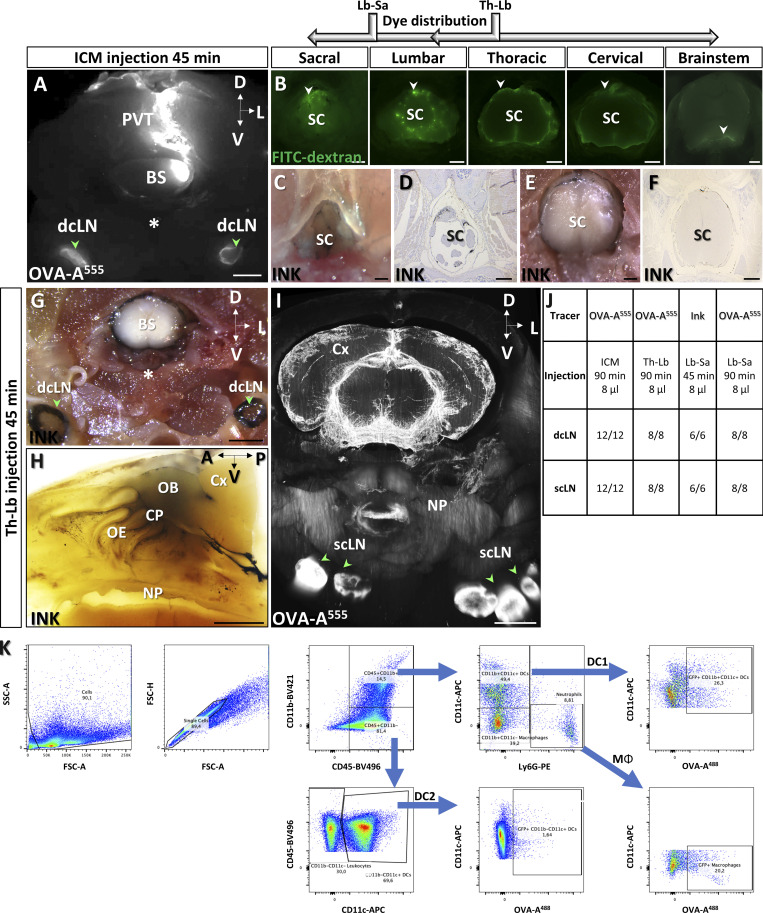
Figure S1.
OVA-A 555 tracer distribution after ICM and intraspinal injection. (A) Coronal section of the cervical spine after ICM injection of OVA-A 555 (white). Note that OVA-A 555 spillover labeled paravertebr...
Video 1.
OVA-A555 tracer (white) labels phagocytic cells located along perivascular spaces of the brain vasculature as well as along the superior sagittal sinus in the dura mater. Frame rate, 24 frames/s.
Video 2.
OVA-A555 tracer (white) labels brain meninges and, outside of the skull, the nasal cavity, the nasopharynx, and the cervical LNs. Frame rate, 24 frames/s.
Video 3.
OVA-A555 tracer (white) labels the scLNs. Frame rate, 25 frames/s.
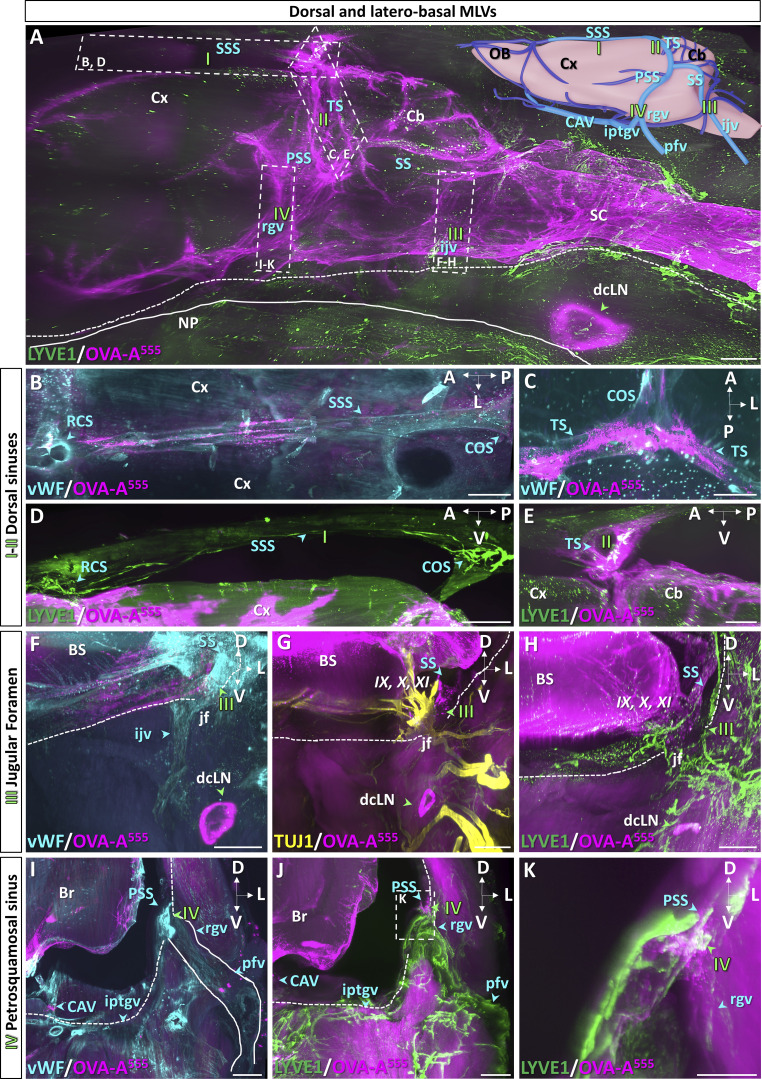
Figure 2.
LSFM imaging of known dorsal and laterobasal MLV drainage pathways. (A) Lateral view of OVA-A 555 (magenta) in the posterior head 45 min after Lb-Sa injection labeled with anti-LYVE1 (green). OVA-A 55...
Video 4.
3D schematic of adult mouse dural veins and sinuses. Frame rate, 25 frames/s.
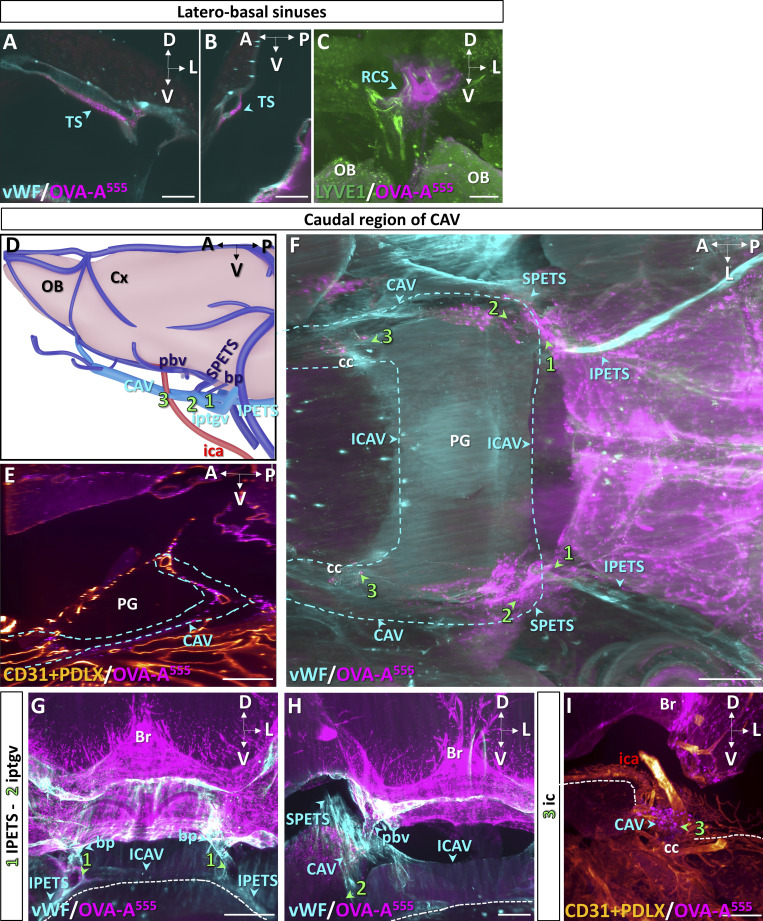
Figure S2.
Perisinusal distribution of CSF tracer and lymphatic uptake hotspots. (A and B) Coronal (A) and sagittal (B) views of the perisinusal distribution of tracer (OVA-A 555 , magenta, blue arrowheads) alon...
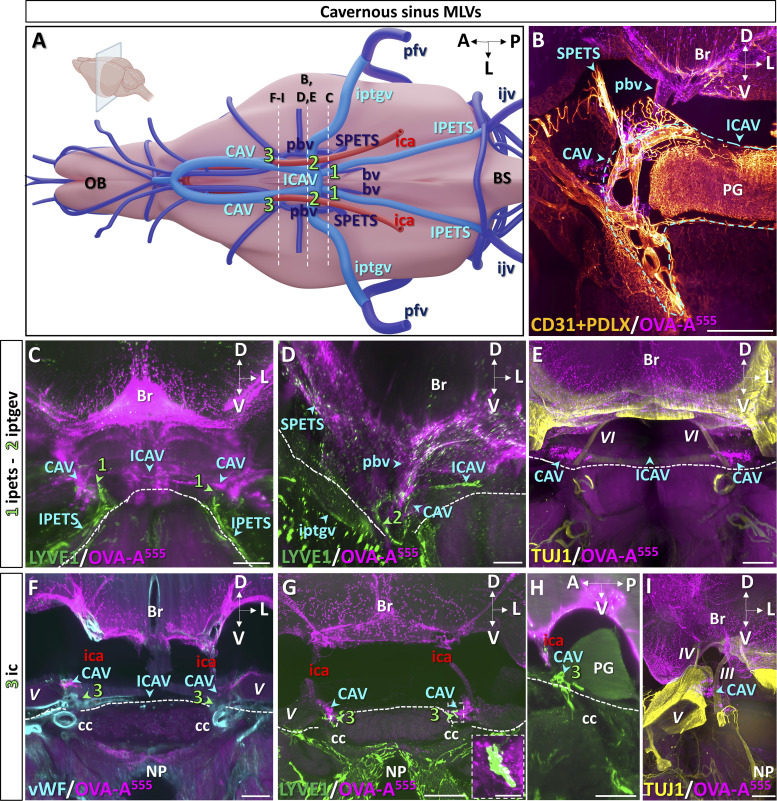
Figure 3.
MLV drainage from the caudal CAV. (A) Schematic of venous sinuses, veins, and internal carotid artery at the base of the brain. (Bu2013I) Dashed lines indicate the level of coronal sections in Bu2013I...
Video 5.
LYVE1 + MLVs (green) localized at the carotid foramen and associated with perisinusal deposits of OVA-A555 around the CAV. Frame rate, 24 frames/s.
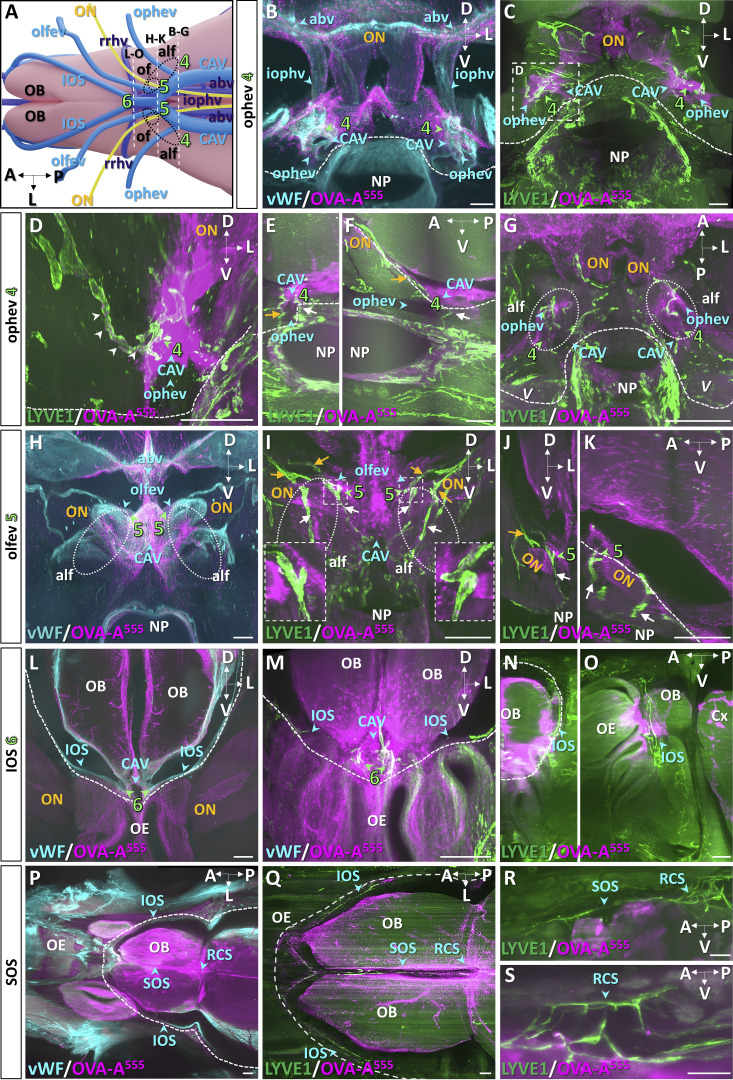
Figure 4.
MLV drainage from the rostral CAV. (A) Schematic of veins of the ventral forebrain and olfactory bulbs (OB). (Bu2013O) Dashed lines indicate the level of coronal sections shown in Bu2013O, and lymphat...
Video 6.
Entry point of the ophthalmic emissary vein into the anterior CAV. LYVE1 + capillaries (green) contact the OVA-A555 + perisinusal area of the CAV (magenta) and transport OVA-A555 + phagocytic cells. F...
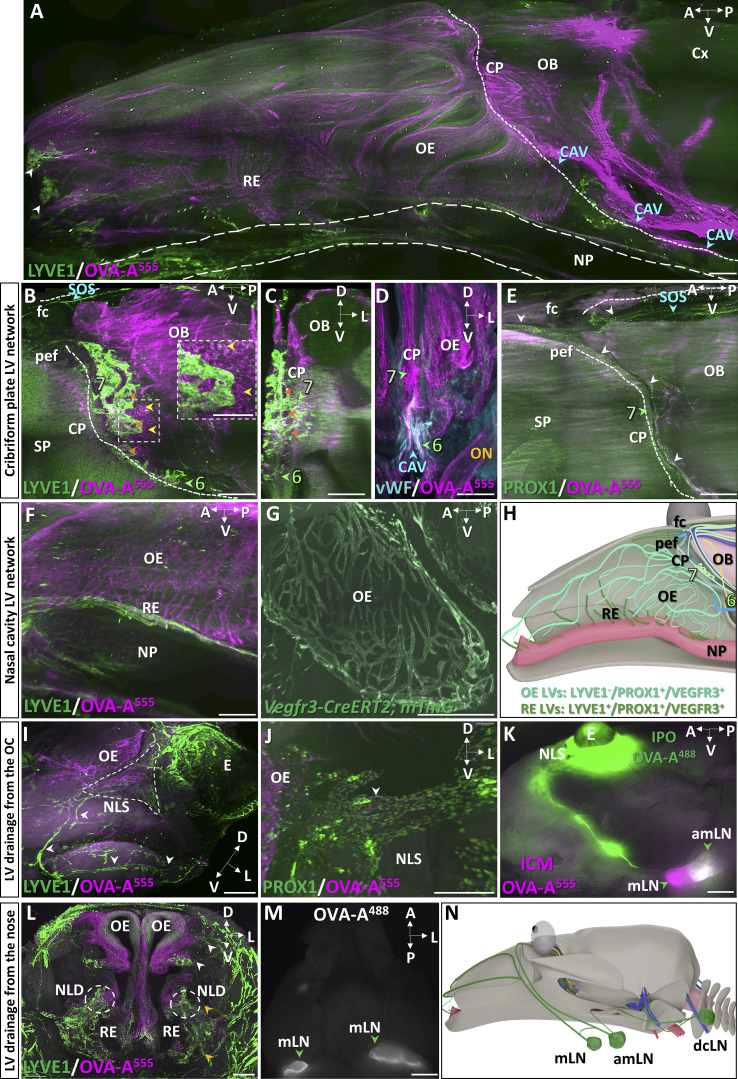
Figure 5.
CSF drainage from the cribriform plate into the nasal cavity. (A) Sagittal view of the nasal cavity and forebrain 45 min after Th-Lb injection of OVA-A555 (magenta) and labeled with LYVE1 (green). Tra...
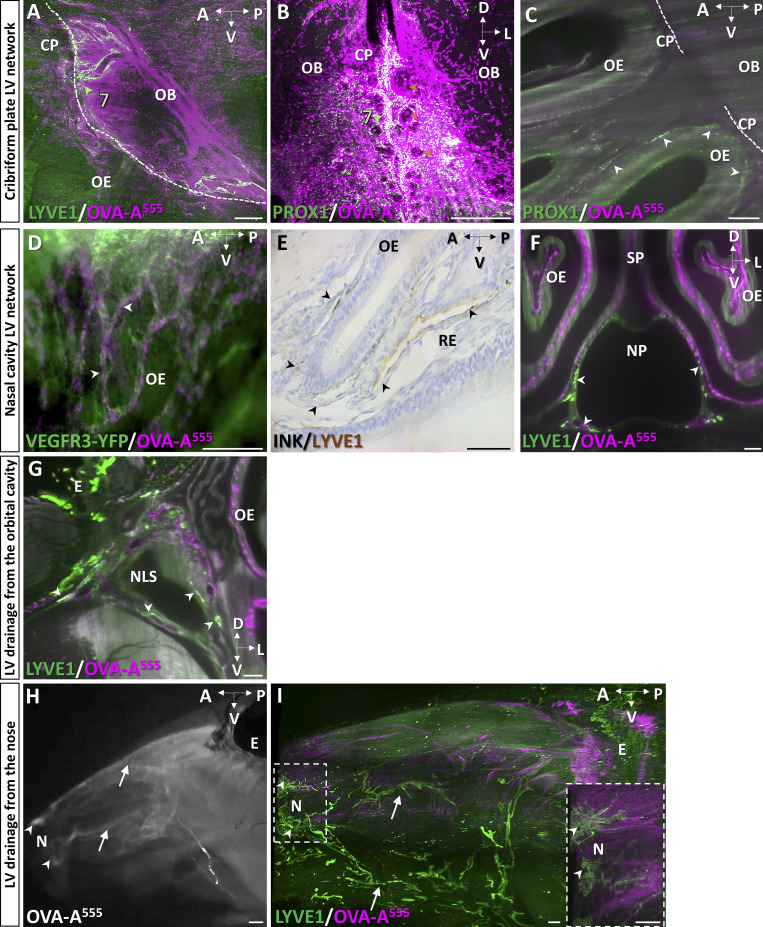
Figure S3.
CSF drainage through the cribriform plate and inside the nasal cavity. (Au2013F) Pattern of tracer 45 min after ICM (A) or Th-Lb (Bu2013F) injections of OVA-A 555 (magenta) or ink. (A and B) Sagittal ...
Video 7.
LYVE1 + MLVs localized around the olfactory bulbs. No LYVE1 + lymphatic connection crossed the cribriform foramina via the nasal cavity, which harbors a dense network of OVA-A 555+ vessel-like structu...
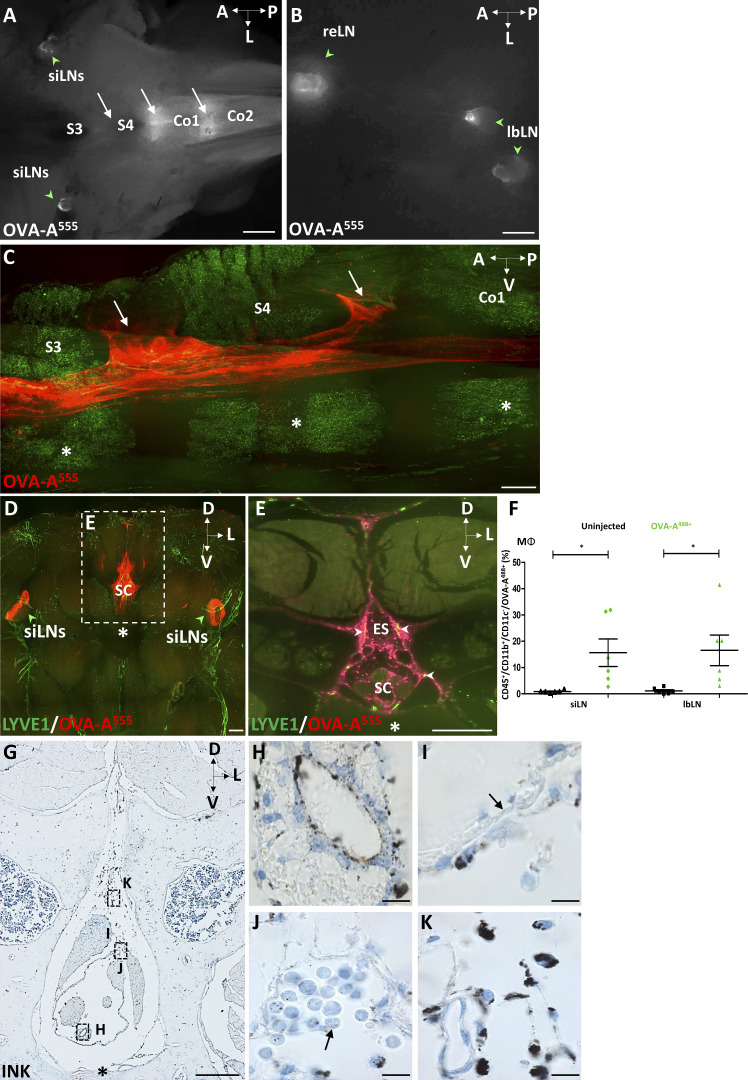
Figure S4.
Sacral spinal cord outflow. (A and B) Macroscope imaging of the sacrococcygeal region 90 min after ICM injection of OVA-A 555 tracer. (A) Tracer deposits were detected at intervertebral spaces (white ...
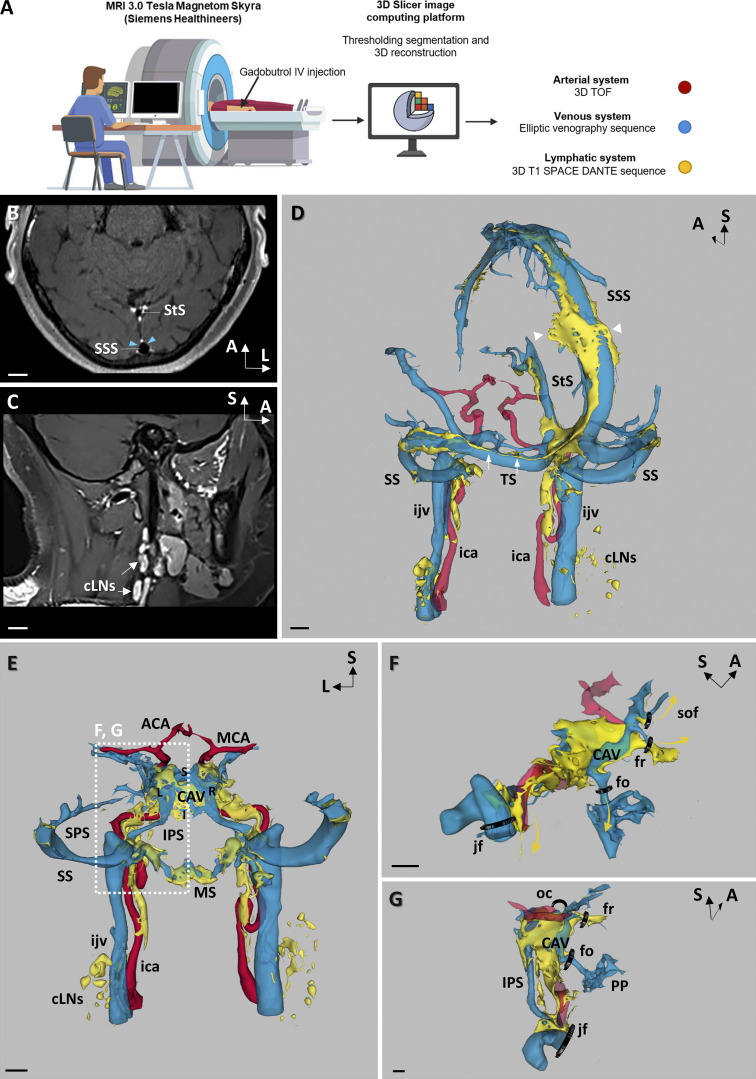
Figure 6.
Meningeal vascular MRI in humans. (A) Schematic of the workflow for meningeal vascular 3D mapping by MRI in humans. Native sequences were acquired from a 3T MRI before and after i.v. gadobutrol inject...
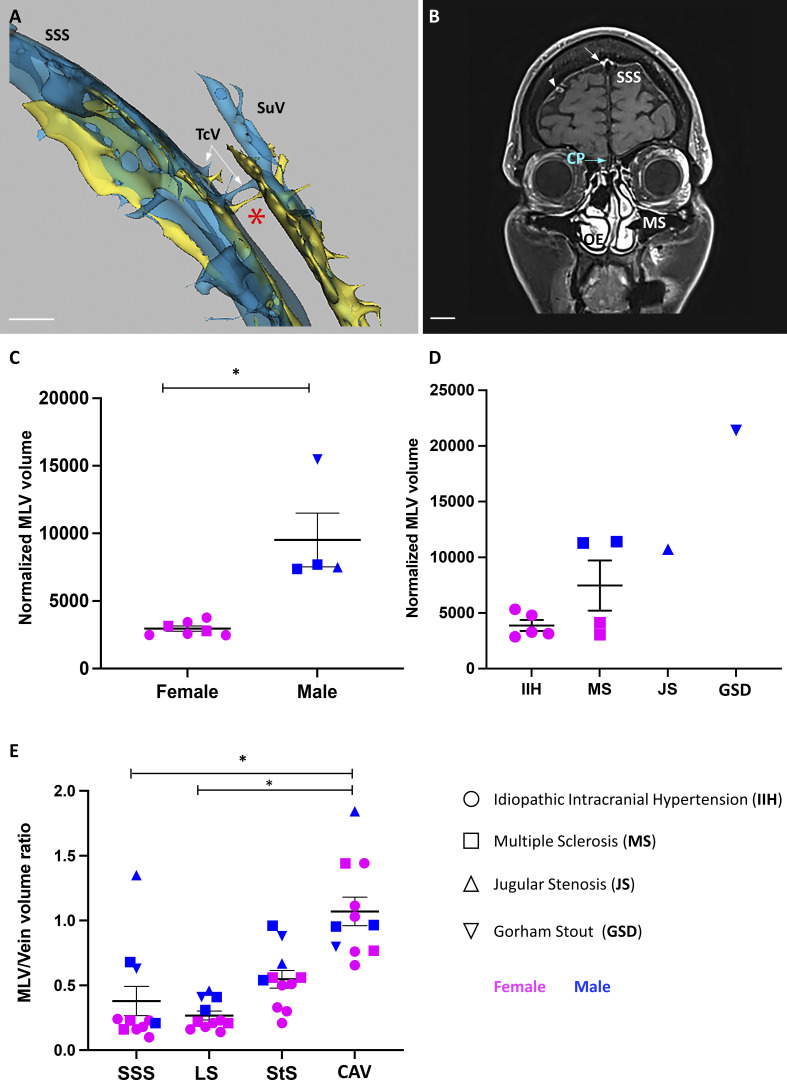
Figure S5.
Meningeal and skull vascular MRI in humans. (A and B) VW-MRI (A) and meningeal vascular 3D mapping by MRI (B) of a patient with IIH and CSF leak (patient 1 in Table 1 ). (A) Transcalvarial connections...
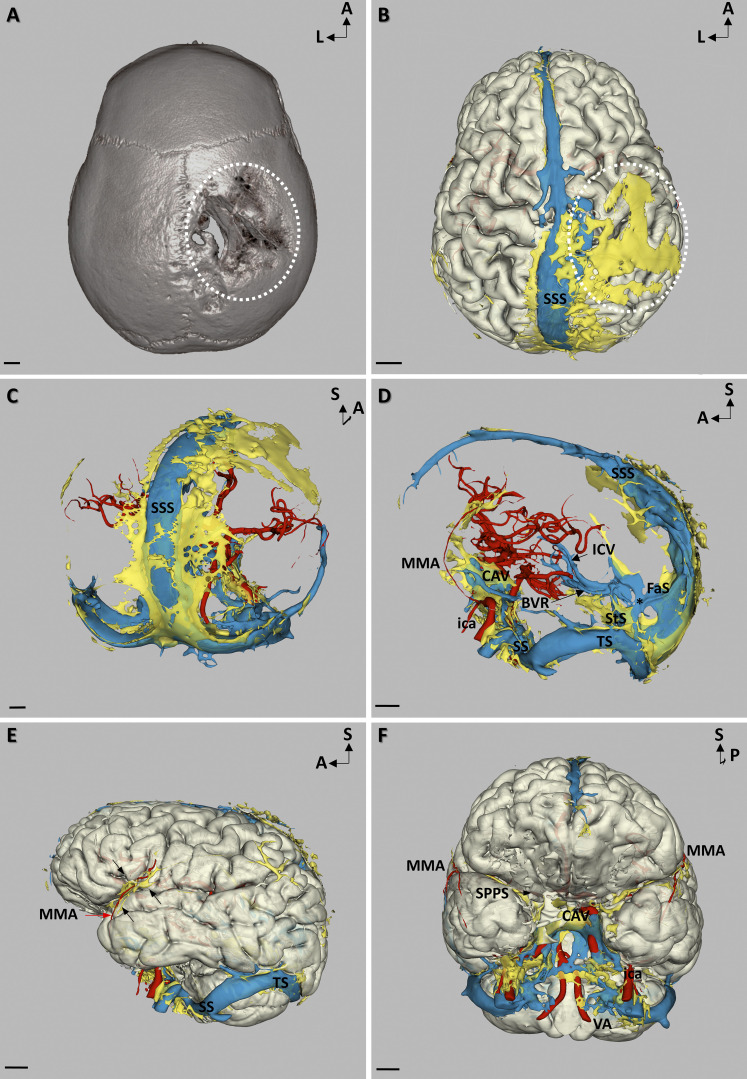
Figure 7.
Altered MLV imaging overlaps with skull bone erosion in a patient with GSD. (A) 3D reconstruction of a computed tomography scan in superior view showing the large erosion of the right parietal bone (w...
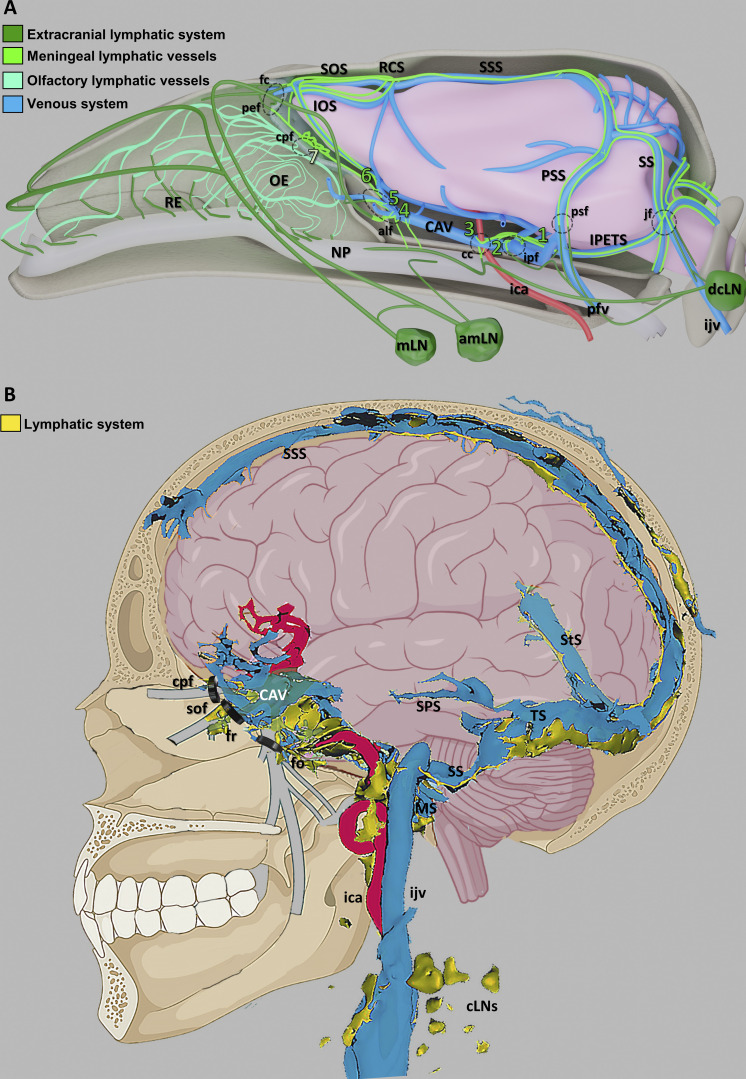
Figure 8.
Schematic representation of the dural venolymphatic complex in mice and humans. (A) Summary schematic of lymphatic CSF drainage circuits in the mouse head. Cerebral veins and dural sinuses (blue) drai...
Video 8.
3D schematic of MLVs and cranial lymphatic circuits collecting into mandibular and cervical LNs in the adult mouse. Frame rate, 25 frames/s.
Figure images are served from the NIH/NLM PubMed Central Open Access Subset or Europe PMC; copyright remains with the publishers and authors.
💬 Discussion
0 commentsNo comments yet. Be the first to start a discussion!
Leave a Comment