Abstract
Correlative fluorescence light microscopy and electron microscopy allows the imaging of spatial distributions of specific biomolecules in the context of cellular ultrastructure. Recent development of super-resolution fluorescence microscopy allows the location of molecules to be determined with nanometer-scale spatial resolution. However, correlative super-resolution fluorescence microscopy and electron microscopy (EM) still remains challenging because the optimal specimen preparation and imaging conditions for super-resolution fluorescence microscopy and EM are often not compatible. Here, we have developed several experiment protocols for correlative stochastic optical reconstruction microscopy (STORM) and EM methods, both for un-embedded samples by applying EM-specific sample preparations after STORM imaging and for embedded and sectioned samples by optimizing the fluorescence under EM fixation, staining and embedding conditions. We demonstrated these methods using a variety of cellular targets.
🔬 Techniques
🧪 Sample Preparation
🔬 Cell Lines
🏭 Microscope Brands
🧪 Reagent Suppliers
📷 Detectors
🔎 Objectives
🎨 Filters
💻 Software Details
🏛️ Research Organizations (ROR)
Affiliated research institutions:
📋 Methods
Substrates cleaning Various substrates were used depending on the experiments. For 3D STORM imaging without EM imaging, eight-well coverglass chambers (Labtek, 154534; Nunc) were used. Photo-etched gridded coverslips (Electron Microscopy Sciences, 72264–23) were used for correlative 3D STORM and SEM of hydrated, unembedded samples. For correlative 3D STORM and TEM of unembedded samples, silicon nitride support film (Ted Pella, 21515–10) was used. For correlative STORM and BSE-SEM imaging embedded, sectioned samples, plastic coverslips (Thermanox, 174950) were used for cell culture, which allow easy detachment of coverslips from the hardened resin block after polymerization, and #1.5 glass coverslips (Electron Microscopy Sciences, 72204–04) were used to mount the sections for STORM imaging. All of the substrates described above were cleaned by sonication for 20 min in 1 M aqueous potassium hydroxide and the washed thoroughly with MilliQ water, except for the silicon nitride support films, which were washed briefly with 1 M aqueous potassium hydroxide and MilliQ water without sonication because these thin films (40–200 nm thick) are fragile. The cleaned glass coverslips used for supporting the embedded sections were additionally glow-discharged using a Glow discharge system (Agar Sceintific AGB8960) to make their surfaces hydrophilic. This helps to get the sections flat on the coverslips with fewer wrinkles. To reduce wrinkles of ultrathin sections, the sections were often treated with chloroform.
Show full methods section
Substrates cleaning Various substrates were used depending on the experiments. For 3D STORM imaging without EM imaging, eight-well coverglass chambers (Labtek, 154534; Nunc) were used. Photo-etched gridded coverslips (Electron Microscopy Sciences, 72264–23) were used for correlative 3D STORM and SEM of hydrated, unembedded samples. For correlative 3D STORM and TEM of unembedded samples, silicon nitride support film (Ted Pella, 21515–10) was used. For correlative STORM and BSE-SEM imaging embedded, sectioned samples, plastic coverslips (Thermanox, 174950) were used for cell culture, which allow easy detachment of coverslips from the hardened resin block after polymerization, and #1.5 glass coverslips (Electron Microscopy Sciences, 72204–04) were used to mount the sections for STORM imaging. All of the substrates described above were cleaned by sonication for 20 min in 1 M aqueous potassium hydroxide and the washed thoroughly with MilliQ water, except for the silicon nitride support films, which were washed briefly with 1 M aqueous potassium hydroxide and MilliQ water without sonication because these thin films (40–200 nm thick) are fragile. The cleaned glass coverslips used for supporting the embedded sections were additionally glow-discharged using a Glow discharge system (Agar Sceintific AGB8960) to make their surfaces hydrophilic. This helps to get the sections flat on the coverslips with fewer wrinkles. To reduce wrinkles of ultrathin sections, the sections were often treated with chloroform.
Cell culture and virus infection
For cell culture, each coverslip was put in the 6-well, 12-well or 24-well flat-bottom cell culture plates (Corning costar) depending on the coverslip size. BS-C-1 cells (African Green monkey kidney epithelial cells, American Type Culture Collection (ATCC), CCL-26) were cultured in Eagle modified minimum essential medium (ATCC), supplemented with 10% fetal bovine serum (Invitrogen) and antibiotics (ATCC; penicillin and streptomycin). A549 cells (lung carcinoma cells, ATCC CCL-185) were cultured in high glucose Dulbecco’s modified Eagle medium (Invitrogen) supplemented with 10% fetal bovine serum (Invitrogen) and antibiotics (ATCC; penicillin and streptomycin). The cells were maintained in a humidified, 5% CO 2 environment at 37°C. For virus infection, Udorn virus strain (a gift from Robert Lamb, Northwestern University, Evanston, IL) was used. A549 cells were infected with a MOI of 3 pfu/cell of A/Udorn/72 for 12 hrs at 37°C and fixed as described below.
Immunostaining and post-fixation
For imaging viruses budding from cells, Udorn-infected A549 cells were washed in PBS (phosphate-buffered saline) twice after 12 hrs infection, and fixed with a mixture of 4% paraformaldehyde (Electron Microscopy Sciences, 15714) and 0.1% glutaraldehyde (Electron Microscopy Sciences, 16020) at room temperature for 15 minutes (for HA staining or HA and vRNP staining) or fixed with methanol at -20°C for 2min[ 44 ]. The cells were then washed with PBS and blocked with 3% (w/v) bovine serum albumin (Jackson ImmunoResearch Laboratories) in PBS for 30 min. For single-color HA staining, cells were incubated with goat HA primary antibodies (NR3118, BEI, Manassas, VA) in blocking buffer for 1hr and Alexa 405 and Alexa 647 co-labeled bovine anti-goat secondary antibodies (Jackson ImmunoResearch Laboratories) for 1hr. For two color imaging, cells were stained with goat HA primary antibodies (or goat M1 primary antibodies (Abcam, ab20910)) and mouse vRNP primary antibodies (Millipore, MAB8800) in blocking buffer for 1hr, followed by Alexa 647 labeled bovine anti-goat secondary antibodies and Alexa 568 labeled anti-mouse secondary antibodies for 1hr. The labeled cells were post-fixed with a mixture of 4% paraformaldehyde and 0.1% glutaraldehyde at room temperature for 10 minutes and washed in PBS. For correlative STORM and BSE-SEM imaging of embedded samples, the post-fixed samples were further fixed and stained with 1% tannic acid (Electron Microscopy Sciences, 21700) in TRIS-maleate buffer (MB, Electron Microscopy Sciences, 11740) pH 6.0 for 10 min, washed with MB for 20 min, and then stained again with 1% uranyl acetate (Electron Microscopy Sciences, 22400) in MB, pH 6.0 for 10 min. For mitochondria imaging, BS-C-1 cells were washed in PBS twice, fixed with a mixture of 4% paraformaldehyde and 0.1% glutaraldehyde at room temperature for 15 min, and then reduced with 0.1% sodium borohydride for 7 min[ 38 ]. After washing with PBS, the cells were permeabilized with 0.2% Triton X-100 and 3% (w/v) bovine serum albumin in PBS for 10 min, and then blocked with 3% (w/v) bovine serum albumin in PBS for 30 min. The cells were stained with rabbit anti-Tom20 (Santa Cruz Biotech, 2 μg/ml) in blocking buffer for 30 min, washed with PBS, and then stained with Alexa 405 and Alexa 647 labeled donkey anti-rabbit secondary antibodies (2 μg/ml) in blocking buffer for 1 hr. The labeled cells were then washed with PBS and post-fixed with 4% paraformaldehyde and 0.1% glutaraldehyde in PBS for 10 min at room temperature. For correlative STORM and BSE-SEM imaging, the post-fixed samples were further fixed and stained with 0.6% osmium tetroxide aqueous solution (Electron Microscopy Sciences, 19152) for 7 min, reduced with 1.5% potassium ferricyanide for 10 min, washed with MB for 20 min, then stained again with 1% uranyl acetate in MB, pH 6.0 for 10 min. For microtubule staining, BS-C-1 cells were washed in PBS twice, fixed and permeabilized using 0.3% glutaraldehyde and 0.25% Triton X-100 in cytoskeleton buffer (CB: 10 mM MES pH 6.1, 150 mM NaCl, 5 mM EGTA, 5 mM glucose, and 5 mM MgCl 2 ) for 5 min in the first step, followed by a second fixation step using 2% glutaraldehyde in CB for 15 min. To reduce the background, the fixed cells were reduced by 0.1% NaBH 4 in PBS for 7 min[ 38 ]. Following washing with PBS for 1 hr, the cells were blocked with 3% (w/v) bovine serum albumin in PBS for 30 min. They were stained for 1hr with rat anti-tubulin primary antibodies (ab6160; Abcam, clone YL1/2) in blocking buffer, washed with PBS, and then stained with Alexa 405 and Alexa 647 co-labeled donkey anti-rat secondary antibodies (2 μg/ml) in blocking buffer for 1 hr. The cells were then washed with PBS and post-fixed with 4% paraformaldehyde and 0.1% glutaraldehyde in PBS for 10 min at room temperature. Embedding, sectioning and etching The fixed and stained cells were washed with double-distilled water three-times for 10 min and then dehydrated in a graded ethanol series (60%, 75%, and 90% ethanol for 5 min each, and followed by 100% ethanol twice for 10 min each). Following dehydration, the sample was infiltrated by progressive incubations with ethanol and UltraBed (a Spurr-like resin, Electron Microscopy Sciences, 14310) at ratios of 2:1, 1:1, and 1:2, followed by 100% resin. After 10 hr infiltration, the sample was embedded and polymerized in 100% UltraBed resin using the BEEM Embedding Capsules (Electron Microscopy Sciences, 69913–05) by baking in a 70°C oven for 17 hrs. For Durcupan ACM embedding, the sample was infiltrated by progressive incubations with ethanol and Durcupan mixture (Electron Microscopy Sciences, 14040), at ratios of 2:1, 1:1, and 1:2, followed by 100% resin. After 10 hr infiltration, the sample was embedded and polymerized in 100% Durcupan resin by heating in a 70°C oven for 17 hrs. For LR White embedding, the sample was infiltrated by progressive incubations with ethanol and LR White (Electron Microscopy Sciences, 14383) at ratios of 2:1, 1:1, and 1:2, followed by 100% resin. To preserve fluorescence, we titrated ethanolamine into LR White to neutralize the resin pH. We chose cold curing by chemical accelerator rather than UV polymerization or heat polymerization to minimize the fluorescence quenching. Following infiltration, the sample was polymerized at -20°C overnight by adding a chemical accelerator (Electron Microscopy Sciences, 14385). The BEEM Embedding Capsules and the plastic coverslip were removed from the hardened resin block by dipping them into liquid nitrogen. The plastic block was trimmed and sectioned with a Leica Ultracut ultramicrotome to obtain the ultrathin sections (70 nm thick). If the section has wrinkles or was not fully stretched, we exposed it to chloroform vapor to make fully stretched section without wrinkles. We placed the sections on a glow-discharged glass coverslips, followed by drying on a hot plate (60°C) for 20 min. The dried sections were etched in 10% saturated sodium ethoxide for 30 sec, washed with double-distilled water and then dried again on a hot plate (60°C) for 10 min.
STORM imaging
The samples were imaged in an imaging buffer containing 100 mM mercaptoethylamine(MEA) and an oxygen scavernger system [5% glucose (wt/vol), 0.5 mg/ml glucose oxidase (Sigma-Aldrich), and 40 mg/ml catalase (Sigma-Aldrich, C100-50MG)] in PBS at pH 8.5, which has a refractive index of 1.34. For correlative 3D STORM and TEM, higher refractive index (1.45) media was used, which contains 60% (wt/wt) sucrose and 5% (wt/wt) glucose in the imaging buffer described. When SiN was used as the substrate for the sample, the SIN film was sandwiched between two glass coverslips. The SiN was first placed on a glass coverslip in an imaging buffer, assembled into a sample chamber with another No. 1.5 glass coverslip and the chamber was sealed by nail polish (Electron Microscopy Sciences, 72180) around the edges of a coverslip. When the photo-etched gridded coverslip was used as the substrate for the sample, it was also assembled into a sample chamber with a No. 1.5 glass coverslip with nail polish. The ultrathin sections of embedded samples were placed on one No. 1.5 glass coverslip, assembled into a sample chamber with another No. 1.5 glass coverslips and sealed the same way. STORM experiments were performed on an Olympus IX71 inverted optical microscope fitted with an Olympus UPlanSApo 100x, 1.4 NA oil immersion, as previously described[ 27 ]. Alexa 647 dyes were excited using a 647 nm laser (MPB Comm Inc. 2RU-VFL-P-1500-647) and activated using a 405-nm laser (Cube 405-50C; Coherent). The emission from the Alexa 647 was filtered with a bandpass emission filter (Chroma, ET700/75) and was detected using an electron-multiplying charge-coupled device (EMCCD) camera (Andor Technology, Ixon DU897) at a frame rate of 60 Hz. For 3D STORM imaging, a cylindrical lens with a focal length of 1 m (Thorlabs LJ1836L1-B or LJ1144L1-B) was inserted into the imaging optical path to create astigmatism for 3D imaging, as previously described[ 27 ]. For two-color imaging of Alexa 647 and Alexa 568, 561nm and 657nm beams were used to excite Alexa 647 and Alexa 568, respectively, and the dyes were activated by 405nm laser. The emissions from the two dyes were separated by a 630-nm long-pass dichroic mounted on a commercial beamsplitting device (Dual-View; Photometrics), filtered with two bandpass emission filters (FF01-607/70; Semrock and ET705/72m; Chroma) and detected on two different regions of the EMCCD camera at a frame rate of 60 Hz. Electron microscopy imaging After STORM imaging, the substrates with sample still attached were disassembled from the other coverslip by removing the nail polish with ethanol. The samples were washed with double-distilled water before subsequent EM sample preparation steps. All of the following EM sample preparations were performed between STORM and EM imaging. For correlative 3D STORM and TEM imaging of unembedded sample of microtubules, the sample was incubated in 0.1% aqueous tannic acid for 20 min at room temperature. After washing three times with distilled water for 10 min, it was incubated with 0.1–0.2% uranyl acetate in distilled water for 20 min at room temperature and washed again with distilled water for 10 min. The sample was then dehydrated in a graded ethanol series (60%, 75%, 90% and 100% ethanol for 5 min each, 0.2% uranyl acetate in 100% ethanol for 20min, followed by 100% ethanol twice for 10min each). The samples were further dried with hexamethyldisilazane for 15 min or by Critical Point Drying, and placed on a silicon wafer, followed by sputter-coating with 1 nm of platinum/palladium (Sputter Coater, Cressington, 208HR). For TEM imaging, the samples were imaged in a TecnaiG2 Spirit BioTWIN at 80 kV with an AMT 2k CCD camera. For correlative 3D STORM and TEM imaging of unembedded samples of mitochondria, the sample was post-fixed with 1% uranyl acetate (Electron Microscopy Sciences, 22400) in distilled water for 10 min at room temperature and washed with distilled water for 10 min. After dehydration in a graded ethanol series (60%, 75%, and 90% ethanol for 5 min each, followed by 100% ethanol twice for 10min each), the samples were further dried with hexamethyldisilazane for 15 min or by Critical Point Drying. The samples were imaged in a TecnaiG2 Spirit BioTWIN at 80 kV with an AMT 2k CCD camera. For correlative 3D STORM and SEM imaging of unembedded samples, the sample was further fixed in 1% osmium tetroxide aqueous solution (Electron Microscopy Sciences, 19152) for 10 min and then dehydrated in a graded ethanol series (60%, 75%, and 90% ethanol for 5 min each, and followed by 100% ethanol twice for 10 min each). The samples were further dried with Hexamethyldisilazane (HMDS, Electron Microscopy Sciences, 16782) for 15 min or by Critical Point Drying (CPD, Tousimis, Auto Samdri 815 Series A), and placed on a silicon wafer followed by carbon-coating with the carbon evaporator (HHV Auto306). The samples were imaged using an Ultra55 Field Emission Scanning Electron Microscope (FESEM, Zeiss) at 3 keV after identifying the same regions that were imaged with STORM by reading the number and grid on the photo-etched gridded coverslip. For correlative STORM and BSE-SEM imaging of embedded samples, the sample sections were further stained by 2% uranyl acetate in ethanol solution for 10 min at room temperature, washed three times with distilled water, and then stained with Reynold’s lead citrate for 5 min at room temperature. The stained sections were rinsed again with distilled water and dried overnight. The coverslips with the sections were placed on a silicon wafer, and an additional carbon layer was sputtered on the sections for conductivity by using a carbon evaporator (HHV Auto306). The samples were imaged in a Zeiss Sigma Field Emission Scanning Electron Microscope (FESEM, Zeiss) with a the accelerating voltage of 7 keV by detecting back-scattered electrons and inverting black/white signal for easier visualization of the structure.
Image analysis
Before overlaying STORM and EM images, the brightness and contrast of the EM images was adjusted using PHOTOSHOP (Adobe Systems, San Jose, CA, U.S.A.) and the EM image was roughly rescaled until the scale bar matched the size of the scale bar on the STORM image. As a first rough alignment, the low magnification STORM image and the corresponding EM image were overlaid by rescaling, translation and rotating using PHOTOSHOP or the image registration function Control Point Registration in Matlab (The Math Works Inc., Natick, MA). Features visualized in both images could be used as fiduciary markers in this step, including gold fiduciary markers, the silicon nitride support mesh in the SiN window, dirt, the edge of the section and wrinkles in the section. After the rough alignment, a refined alignment between two images was performed based on structures within the cells, such as virus filaments, mitochondria, and microtubules, by rescaling, translation and rotating the images using PHOTOSHOP and Matlab. In order to estimate how accurate the correlation is, we calculated the normalized cross-correlation between STORM and EM images. To compute the normalized cross-correlation between STORM and EM images, images were converted to grayscale images and the cross-correlation between the EM and STOMR images was calculated using the 'normxcorr2' function of Matlab and displayed as a surface plot.
Photon number and number of switching cycles analysis
To investigate the effect of sample preparation steps on the photon output of the dyes, we analyzed the average photon number associated with more than 2,000,000 detected molecular localizations (each corresponding to a switching event of the dye molecules in the field of view) for each condition. We also calculated the mean values from the single exponential fit of the photon number distributions and obtained similar results to the average values. The results were normalized against the control condition, in which sample was post-fixed only with 4% PFA and 0.1% GA after immunolabeling without any additional fixation (with osmium, tannic acid or uranyl acetate), dehydration, polymerization, sectioning or etching. In order to investigate the effect of sample preparation steps on the number of switching cycles per fluorophore, we analyzed more than 1,000 detected dye molecules for each condition. From the fluorescence time traces of individual dye molecules, switching events were identified and counted.
📊 Figures
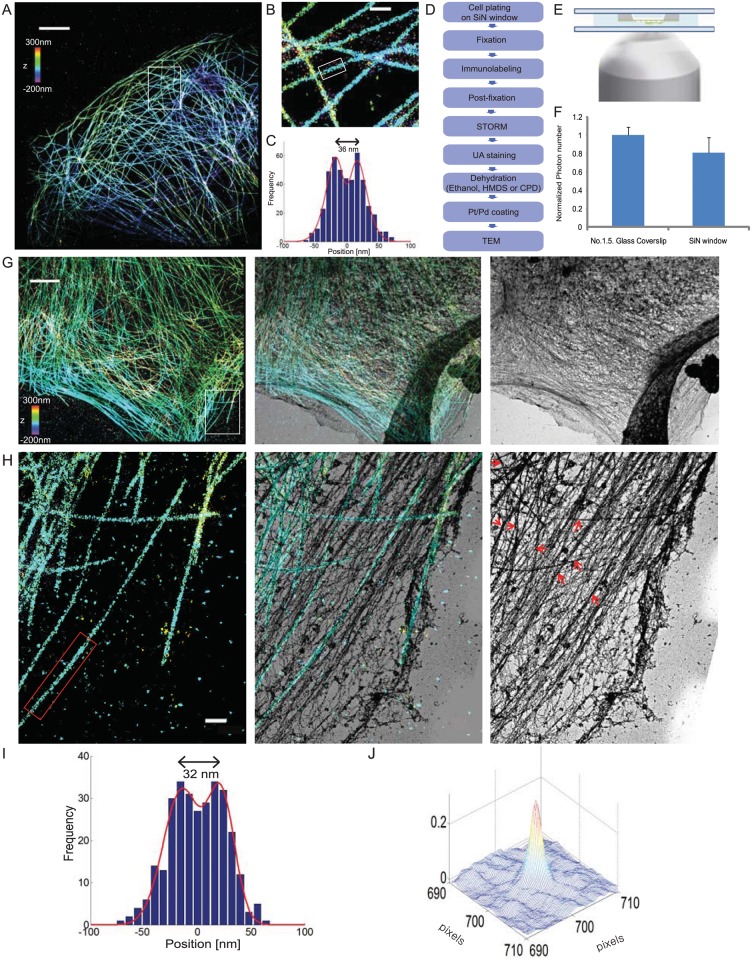
Fig 1
Correlative 3D STORM and TEM images of immunolabeled microtubules in a BS-C-1 cell.
(A) 3D STORM image of microtubules in a BS-C-1 cell on a No. 1.5 glass coverslip. (B) Magnified views of the boxed regions in (A). (C) Transverse profiles of localizations corresponding to regions box...
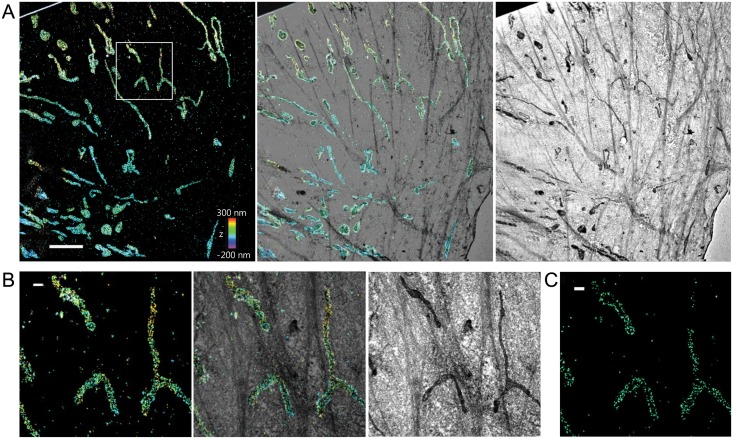
Fig 2
Correlative 3D STORM and TEM images of immunolabeled mitochondria in a BS-C-1 cell.
(A) Correlative 3D STORM and EM images of mitochondria in a BS-C-1 cell innumo-stained for TOM20. Left: STORM image. Right: SEM image. Middle: Overlaid image. Part of SiN mesh is visible on the upper ...
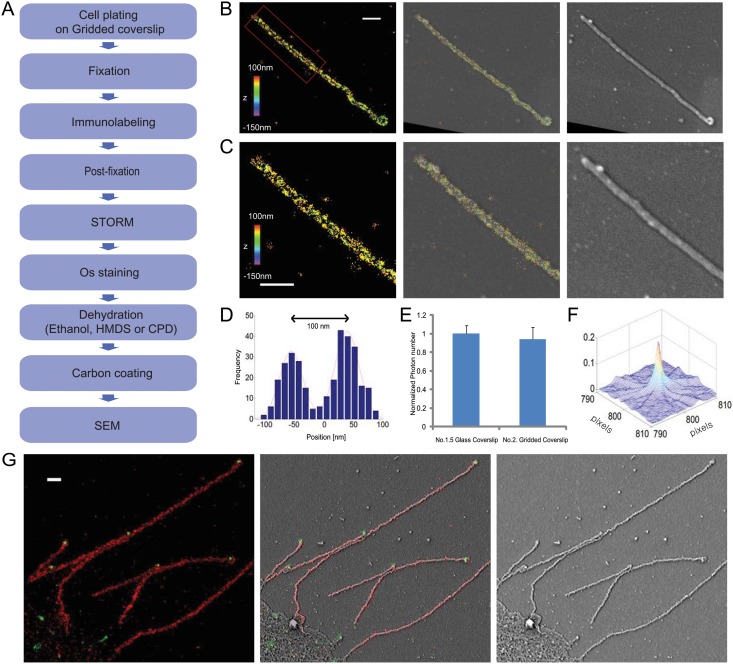
Fig 3
Correlative 3D STORM and SEM imaging of individual filamentous influenza viruses.
(A) Flowchart of the major steps in the correlative 3D STORM and SEM imaging of unembedded samples. (B) Correlative 3D STORM and SEM images of Udorn virus immuno-labeled for HA. Left: STORM image. Rig...
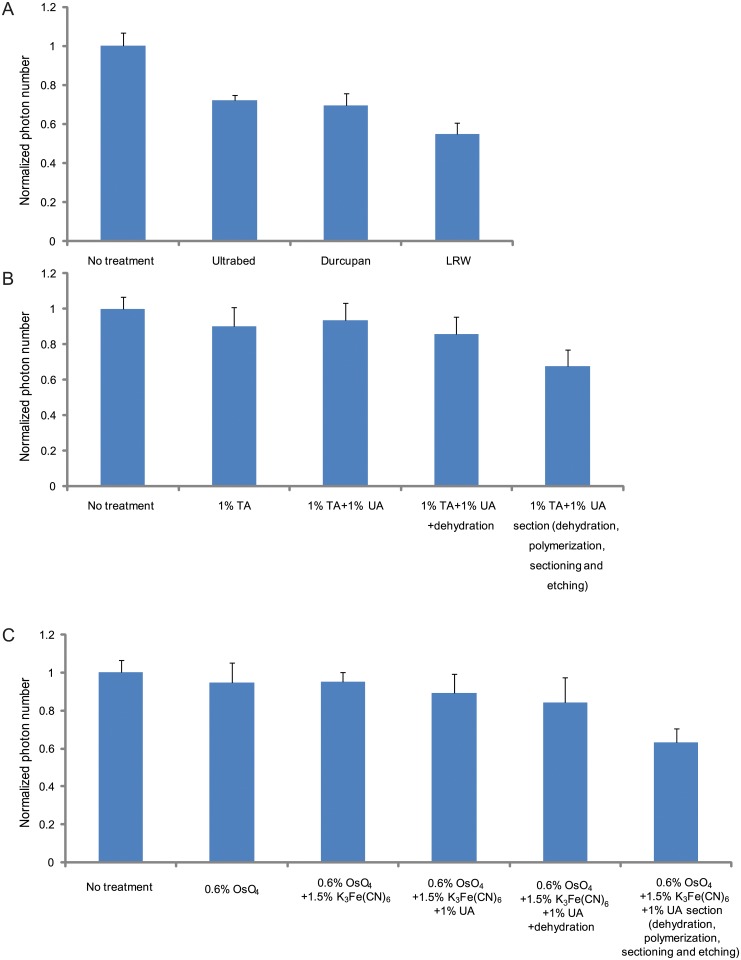
Fig 4
The average photon numbers per switching event of dye molecules under various conditions used in the correlative STORM and EM imaging.
(A) Normalized photon numbers in different resins. (B) Normalized photon numbers detected after various steps of sample treatment in the case of tannic acidu2014uranyl acetate fixed, Ultrabed-embedded...
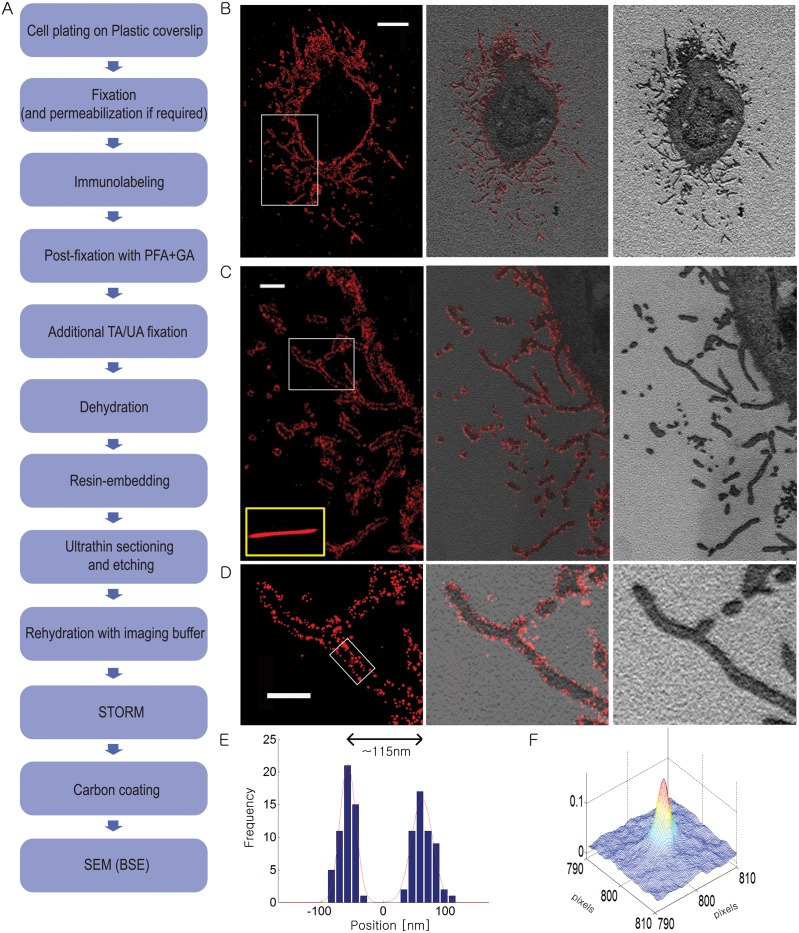
Fig 5
Correlative STORM and SEM-BSE images of resin-embeded sections containing filamentous influenza viruses budding from infected cells.
(A) Flowchart of the major steps in correlative 3D STORM and BSE-SEM imaging of embedded samples. (B) Correlative STORM and EM images of influenza infected A549 cells immuno-stained for HA. Left: STOR...
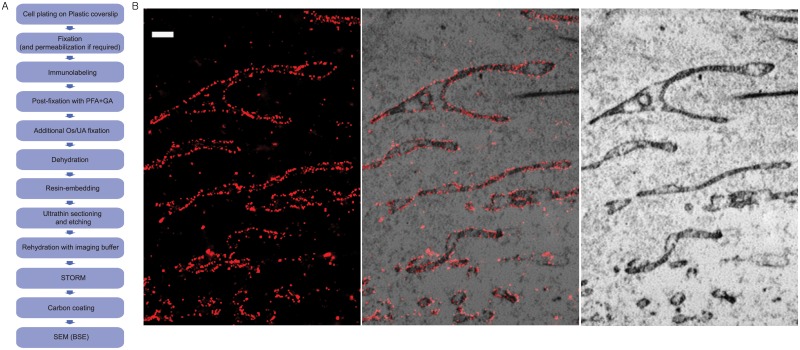
Fig 6
Correlative STORM and BSE-SEM images of immunolabeled mitochondria in a resin-embeded sections of a BS-C-1 cell.
(A) Flowchart of the major steps in correlative 3D STORM and BSE-SEM imaging of embedded samples. (B) Correlative 3D STORM and EM images of cells immuno-stained for TOM20. Left: STORM image. Right: SE...
Figure images are served from the NIH/NLM PubMed Central Open Access Subset or Europe PMC; copyright remains with the publishers and authors.
💬 Discussion
0 commentsNo comments yet. Be the first to start a discussion!
Leave a Comment