Abstract
Synaptic vesicles are embedded in a complex filamentous network at the presynaptic terminal. Before fusion, vesicles are linked to the active zone (AZ) by short filaments (tethers). The identity of the molecules that form and regulate tethers remains unknown, but Rab3-interacting molecule (RIM) is a prominent candidate, given its central role in AZ organization. In this paper, we analyzed presynaptic architecture of RIM1α knockout (KO) mice by cryo-electron tomography. In stark contrast to previous work on dehydrated, chemically fixed samples, our data show significant alterations in vesicle distribution and AZ tethering that could provide a structural basis for the functional deficits of RIM1α KO synapses. Proteasome inhibition reversed these structural defects, suggesting a functional recovery confirmed by electrophysiological recordings. Altogether, our results not only point to the ubiquitin-proteasome system as an important regulator of presynaptic architecture and function but also show that the tethering machinery plays a critical role in exocytosis, converging into a structural model of synaptic vesicle priming by RIM1α.
🔬 Techniques
🔭 Microscopes
🧬 Organisms
💻 Software
✨ Fluorophores
🧪 Sample Preparation
🏭 Microscope Brands
🧪 Reagent Suppliers
💻 Software Details
🏛️ Research Organizations (ROR)
Affiliated research institutions:
📋 Methods
Synaptosomal preparation RIM1α −/− mice were derived in a hybrid SV129/Bl6 background and subjected to at least four backcrosses into c57/Bl6 ( Schoch et al., 2002 ). Cerebrocortical synaptosomes were extracted from 6–8-wk-old male RIM1α +/+ and RIM1α −/− mice as previously described in Dunkley et al. (1988) and Godino et al. (2007) and in accordance with procedures accepted by the Max Planck Institute for Biochemistry. In brief, euthanized animals were decapitated, and the cerebral cortex was extracted and homogenized in homogenization buffer (HB; 0.32 M sucrose and 50 mM EDTA, pH 7.4) with up to seven strokes at 700 rpm in a Teflon glass homogenizer. The homogenate was centrifuged for 2 min at 2,000 g , and the pellet was resuspended in HB and centrifuged for another 2 min at 2,000 g . Supernatants from both centrifugations were combined and centrifuged for 12 min at 9,500 g . The pellet was resuspended in HB and loaded onto a three-step (3, 10, and 23%) Percoll (GE Healthcare) gradient in HB. The gradients were spun for 6 min at 25,000 g , and the material accumulated at the 10/23% interface was recovered and diluted to a final volume of 50 ml in Hepes-buffered medium (HBM; mM: 140 NaCl, 5 KCl, 5 NaHCO 3 , 1.2 Na 2 HPO 4 , 1 MgCl 2 , 10 glucose, and 10 Hepes, pH 7.4). Percoll was removed by centrifugation for 10 min at 22,000 g , and the pellet was resuspended in HBM supplemented with 1.2 mM CaCl 2 and immediately used in the experiments. All steps were performed at 4°C. No protease inhibitors were used during synaptosome preparation. Synaptosomes were diluted to ∼1 mg/ml protein concentration determined by Bradford assay (Bio-Rad Laboratories) and preincubated for 30 min at 37°C. Before vitrification, synaptosomes were incubated for another 30 min at 37°C: without any additions, with 10 µM MG132 (carbobenzoyl- l -leucyl- l -leucyl- l -leucinal; Enzo Life Sciences) diluted in DMSO or with an equivalent amount of DMSO. Proteasome activity assays and Western blotting analysis were performed in DMSO- and MG132-treated synaptosomes only. Tomograms of untreated and DMSO-treated synaptosomes revealed no substantial differences and were pooled as control category. Only tomograms of synaptosomes containing mitochondria were selected for further analysis to ensure their viability ( Harrison et al., 1988 ). Vitrification A 3-µl drop of 10-nm BSA-coated colloidal gold dissolved in PBS (Aurion) was deposited on plasma-cleaned, holey carbon copper EM grids (Quantifoil) and allowed to dry. A 3-µl drop of synaptosomal suspension was placed onto the grid, allowed to equilibrate for 5 s, blotted with filter paper (Whatman Grade 1), and plunged into a liquid ethane/propane mixture. Vitrified grids were stored in liquid nitrogen before imaging. No substantial diffusion of solutes from the dried gold solution into the synaptosomal suspension occurred, as Na + concentration increased to 160 ± 20 mM (mean ± SD, n = 9), when a 3-µl drop containing 140 mM NaCl was added to grids in which the gold solution was previously dried, and to 151 ± 2 mM (mean ± SD, n = 9), when using grids without dried gold solution (control). In both cases, the added drops were allowed to equilibrate on the grids for 30 s. The Na + concentration was determined by adding 10 µM CoroNa Green (Invitrogen) and monitoring the fluorescence on a fluorospectrometer (NanoDrop 3300; Thermo Fisher Scientific).
Show full methods section
Synaptosomal preparation RIM1α −/− mice were derived in a hybrid SV129/Bl6 background and subjected to at least four backcrosses into c57/Bl6 ( Schoch et al., 2002 ). Cerebrocortical synaptosomes were extracted from 6–8-wk-old male RIM1α +/+ and RIM1α −/− mice as previously described in Dunkley et al. (1988) and Godino et al. (2007) and in accordance with procedures accepted by the Max Planck Institute for Biochemistry. In brief, euthanized animals were decapitated, and the cerebral cortex was extracted and homogenized in homogenization buffer (HB; 0.32 M sucrose and 50 mM EDTA, pH 7.4) with up to seven strokes at 700 rpm in a Teflon glass homogenizer. The homogenate was centrifuged for 2 min at 2,000 g , and the pellet was resuspended in HB and centrifuged for another 2 min at 2,000 g . Supernatants from both centrifugations were combined and centrifuged for 12 min at 9,500 g . The pellet was resuspended in HB and loaded onto a three-step (3, 10, and 23%) Percoll (GE Healthcare) gradient in HB. The gradients were spun for 6 min at 25,000 g , and the material accumulated at the 10/23% interface was recovered and diluted to a final volume of 50 ml in Hepes-buffered medium (HBM; mM: 140 NaCl, 5 KCl, 5 NaHCO 3 , 1.2 Na 2 HPO 4 , 1 MgCl 2 , 10 glucose, and 10 Hepes, pH 7.4). Percoll was removed by centrifugation for 10 min at 22,000 g , and the pellet was resuspended in HBM supplemented with 1.2 mM CaCl 2 and immediately used in the experiments. All steps were performed at 4°C. No protease inhibitors were used during synaptosome preparation. Synaptosomes were diluted to ∼1 mg/ml protein concentration determined by Bradford assay (Bio-Rad Laboratories) and preincubated for 30 min at 37°C. Before vitrification, synaptosomes were incubated for another 30 min at 37°C: without any additions, with 10 µM MG132 (carbobenzoyl- l -leucyl- l -leucyl- l -leucinal; Enzo Life Sciences) diluted in DMSO or with an equivalent amount of DMSO. Proteasome activity assays and Western blotting analysis were performed in DMSO- and MG132-treated synaptosomes only. Tomograms of untreated and DMSO-treated synaptosomes revealed no substantial differences and were pooled as control category. Only tomograms of synaptosomes containing mitochondria were selected for further analysis to ensure their viability ( Harrison et al., 1988 ). Vitrification A 3-µl drop of 10-nm BSA-coated colloidal gold dissolved in PBS (Aurion) was deposited on plasma-cleaned, holey carbon copper EM grids (Quantifoil) and allowed to dry. A 3-µl drop of synaptosomal suspension was placed onto the grid, allowed to equilibrate for 5 s, blotted with filter paper (Whatman Grade 1), and plunged into a liquid ethane/propane mixture. Vitrified grids were stored in liquid nitrogen before imaging. No substantial diffusion of solutes from the dried gold solution into the synaptosomal suspension occurred, as Na + concentration increased to 160 ± 20 mM (mean ± SD, n = 9), when a 3-µl drop containing 140 mM NaCl was added to grids in which the gold solution was previously dried, and to 151 ± 2 mM (mean ± SD, n = 9), when using grids without dried gold solution (control). In both cases, the added drops were allowed to equilibrate on the grids for 30 s. The Na + concentration was determined by adding 10 µM CoroNa Green (Invitrogen) and monitoring the fluorescence on a fluorospectrometer (NanoDrop 3300; Thermo Fisher Scientific).
Proteasome activity assay
The synthetic fluorogenic peptide Suc-LLVY–7-amino-4-methylcoumarin (AMC; chymotryptic-like; Bachem) was used as a substrate to measure proteasomal activity ( Kisselev and Goldberg, 2005 ). Fluorescence was measured at 37°C using a spectrophotometer (FLUOstar Optima; BMG LabTech). 20 µg synaptosomes was added to 150 µl HBM buffer. The reaction was initiated by the addition of Suc-LLVY-AMC substrate solution, resulting in a final concentration of 10 µM Suc-LLVY-AMC in a total final volume of 200 µl. Fluorescence of the reaction mixture was assayed immediately. The relative fluorescence was measured using excitation and emission wavelengths of 320 and 460 nm, respectively. Sample size was three pairs of WT and RIM1α KO littermates.
Western blotting Synaptosomes from WT and RIM1α
KO mice were treated with DMSO or MG132, mixed with 5× SDS sample buffer, and boiled. Samples were subjected to gel electrophoresis using a NuPAGE 4–12% Bis-Tris gel in MES SDS running buffer followed by immunoblotting. Mouse antibodies against RIM1 (610907) and MUNC13 (610999) were purchased from BD, Rab3 (107011), syntaxin1 (110011), SNAP25 (111002), VAMP2 (104211), and ELKS (143003) were purchased from Synaptic Systems, synaptotagmin1 (136088) and ubiquitin (8017) were obtained from Santa Cruz Biotechnology, Inc., α-tubulin (T6199) was obtained from Sigma-Aldrich, RIM2 was a gift from F. Schmitz (University of Saarland, Homberg, Germany), and Liprin2 and Liprin3 were obtained as previously described in Zürner et al. (2011) . Protein expression was detected by the luminescent image analyzer (LAS-3000) and Image Reader LAS-3000 software (Leica). Sample size was 13 pairs of WT and RIM1α KO littermates.
Immunofluorescence imaging Synaptosomes from WT and RIM1α
KO mice were treated with DMSO or MG132 and processed as previously described ( Martín et al., 2007 ). In brief, synaptosomes were plated on poly- l -lysine–coated coverslips and allowed to attach for 30 min followed by 30-min incubation with DMSO or MG132. Synaptosomes were fixed for 5 min in PBS containing 4% paraformaldehyde and blocked with PBS containing 1% BSA, 10% normal goat serum, and 0.1% Triton X-100. After several washes, synaptosomes were incubated with primary antibodies for 12–14 h (antibodies for RIM1 and RIM2 were a gift from F. Schmitz; MUNC13 [126102], VAMP2 [104211], and ELKS [143003] antibodies were purchased from Synaptic Systems; and the Bassoon [SAP7F407] antibody was purchased from Enzo Life Sciences). Synaptosomes were washed and further incubated with secondary antibodies for 40 min at room temperature (goat anti–mouse FITC and goat anti–rabbit Cy3 were purchased from Jackson ImmunoResearch Laboratories, Inc.). Coverslips were washed extensively in PBS and mounted in Mowiol (Sigma-Aldrich). Images were acquired at room temperature in a laser-scanning confocal microscope (A1; Nikon) using a CFI Plan Apochromat infrared 60× water immersion objective (NA 1.27) and NIS-Elements 4.0 acquisition software (Nikon). The fraction of AZ protein staining (ELKS, MUNC13, RIM1, and RIM2) colocalizing with presynaptic marker staining (VAMP2 and Bassoon) was quantified using thresholded Manders’ coefficients as implemented in the JACoP plugin ( Bolte and Cordelières, 2006 ) of ImageJ (National Institutes of Health; Schneider et al., 2012 ). Sample size was five pairs of WT and RIM1α KO littermates, with 15–20 images per condition.
Electrophysiological recordings
Synaptic responses were recorded from hippocampal slices (400 µm) of 2–3-wk-old mice at room temperature by extracellular field potentials (fEPSPs) in the stratum radiatum in CA1. Slices were stored and recorded in artificial cerebrospinal fluid (ACSF) containing the following (mM): 130 NaCl, 2.75 KCl, 1.5 MgSO 4 , 2.5 CaCl 2 , 1.1 NaHPO 4 , 28.82 NaHCO 3 , and 11 glucose saturated with 95% O 2 and 5% CO 2 , pH 7.4. A subset of slices was preincubated in ACSF containing 10 µM MG132 for 1–2 h. Recording and stimulation pipettes were filled with ACSF. Schaffer collaterals were stimulated at 0.1 Hz, and initial slopes of fEPSPs were measured. PPF was evoked by a second stimulus 40 ms after the first stimulus. All data were acquired on littermate offspring from heterozygous matings and analyzed without knowledge of the genotype of the tissue being studied. Sample sizes (slices/animals) are as follows: WT, 14/4; WT + MG132, 16/4; RIM1α KO, 14/4; and RIM1α KO + MG132, 13/4. Cryo-ET Tilt series were collected under a low dose acquisition scheme using an electron microscope (Polara; FEI) operated at 300 kV. The microscope was equipped with a field emission gun, a 2,048 × 2,048 charge-coupled device camera (MultiScan; Gatan), a postcolumn energy filter (Gatan) operated in the zero-loss mode, and a computerized cryostage designed to maintain the specimen temperature below −150°C. Tilt series were recorded using Xplore3D (FEI), typically from −60° to 60° with 2° angular increment. Pixel size was 0.66 nm at the specimen level, and the defocus was set to −9 µm. The total dose was kept below 150 e − /Å 2 . Tilt series were aligned using gold beads as fiducial markers, and 3D reconstructions were obtained by weighted back projection with analytical weighting using the TOM toolbox ( Nickell et al., 2005 ). During reconstruction, the projections were binned twice (final voxel size of 2.64 nm) and low pass filtered at the postbinning Nyquist frequency, thus limiting the nominal tomogram resolution of the tomograms to the voxel size. The tomograms were subsequently denoised by anisotropic nonlinear diffusion filtering ( Fernández and Li, 2003 ). 5.4-nm-thick tomographic images shown in Fig. 1 and Fig. 7 were formed by addition of two consecutive 2.64-nm-thick slices. Tomographic slices are displayed using the interpolation tool of IMOD ( Kremer et al., 1996 ). Image segmentation The AZ was manually segmented in Amira (Visualization Sciences Group). A maximum diameter profile along the z axis was manually traced for all synaptic vesicles within 250 nm from the AZ and subsequently substituted with a sphere of the same diameter and center. The elements of the presynaptic cytomatrix were segmented automatically using a Pyto package combining the watershed transform and connectivity-based segmentation ( Fernández-Busnadiego et al., 2010 ). Only filaments contacting exactly two vesicles (connectors) or one vesicle and the AZ (tethers) were analyzed because these were the most prominent filament types found by visual inspection. The morphological properties, location parameters, and grayscale values were determined for all synaptic vesicles, tethers, and connectors of each synapse separately. For the analysis of vesicle distribution, the part of the interior of the presynaptic terminal occupied by synaptic vesicles was divided into 1-pixel-thick layers according to the distance to the AZ, and the fraction of layer volume occupied by vesicles was measured. In cases involving vesicle distance to the AZ, the distance of the vesicle center to the AZ was used. All parameters were analyzed only within 250 nm from the AZ. Connector and tether lengths were estimated from the positions of contact voxels (voxels that contact the vesicle membrane or the AZ). Consequently, connector and tether lengths calculated membrane to membrane would be ∼1 pixel (2.64 nm) longer. All software procedures were written in Python using NumPy and SciPy packages.
Statistical analysis
For the analysis of connectivity, tethering, and vesicle diameter and distribution, values calculated for each category of samples were combined and statistically analyzed. The numbers of vesicles, connectors, and tethers analyzed for each category are shown in Table S1 . Averages were calculated over all measurements of a specific property. We used t test for statistical analysis of values that appeared to be normally distributed (e.g., vesicle diameter) and K-W test (nonparametric) for values deviating from the normal distribution (e.g., number of tethers/connectors per vesicle). When values fell into discrete bins (e.g., fraction of connected and nonconnected vesicles), the χ 2 test was used. We used Pearson’s coefficient for correlation analysis, and its significance was determined using t test. In all cases, confidence levels were calculated using two-tailed tests. The confidence values were indicated in the graphs by a single asterisk for P < 0.05, a double asterisk for P < 0.01, and a triple asterisk for P < 0.001. Online supplemental material Fig. S1 shows synaptosomes immunostained for different presynaptic proteins. Fig. S2 displays a semiquantitative summary of tethering, connectivity, and vesicle size data for proximal vesicles. Fig. S3 shows synaptic vesicle diameter for vesicles within 250 nm from the AZ. Fig. S4 shows proteasome chymotryptic-like activity in synaptosomes.
Table
S1 summarizes the number of animals, synapses, synaptic vesicles, connectors, and tethers analyzed for each category are summarized. Video 1, Video 2, and Video 3 show tomograms and the corresponding 3D renderings of WT, RIM1α KO-altered, and RIM1α KO-aligned synapses, respectively. A ZIP file is also provided that contains a code that was used to perform statistical analysis of the segmentation results and plot all graphs shown in this paper. Online supplemental material is available at http://www.jcb.org/cgi/content/full/jcb.201206063/DC1 .
Online supplemental material Fig. S1 shows synaptosomes immunostained for different presynaptic proteins. Fig. S2 displays a semiquantitative summary of tethering, connectivity, and vesicle size data for proximal vesicles. Fig. S3 shows synaptic vesicle diameter for vesicles within 250 nm from the AZ. Fig. S4 shows proteasome chymotryptic-like activity in synaptosomes.
Table
S1 summarizes the number of animals, synapses, synaptic vesicles, connectors, and tethers analyzed for each category are summarized. Video 1, Video 2, and Video 3 show tomograms and the corresponding 3D renderings of WT, RIM1α KO-altered, and RIM1α KO-aligned synapses, respectively. A ZIP file is also provided that contains a code that was used to perform statistical analysis of the segmentation results and plot all graphs shown in this paper. Online supplemental material is available at http://www.jcb.org/cgi/content/full/jcb.201206063/DC1 .
📊 Figures
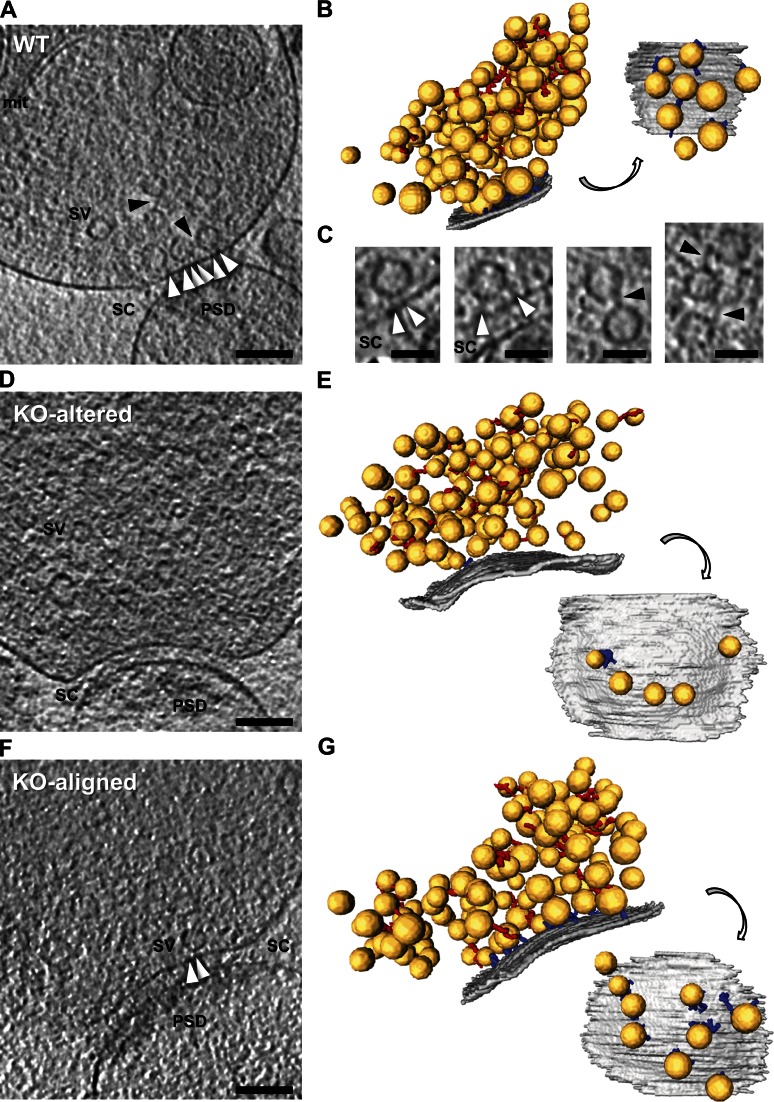
Figure 1.
Morphology of WT and RIM1u03b1 KO synapses by cryo-ET. In unstained, vitrified frozen-hydrated mammalian synapses, the presynaptic cytomatrix mainly consists of filaments shorter than 40 nm linking ve...
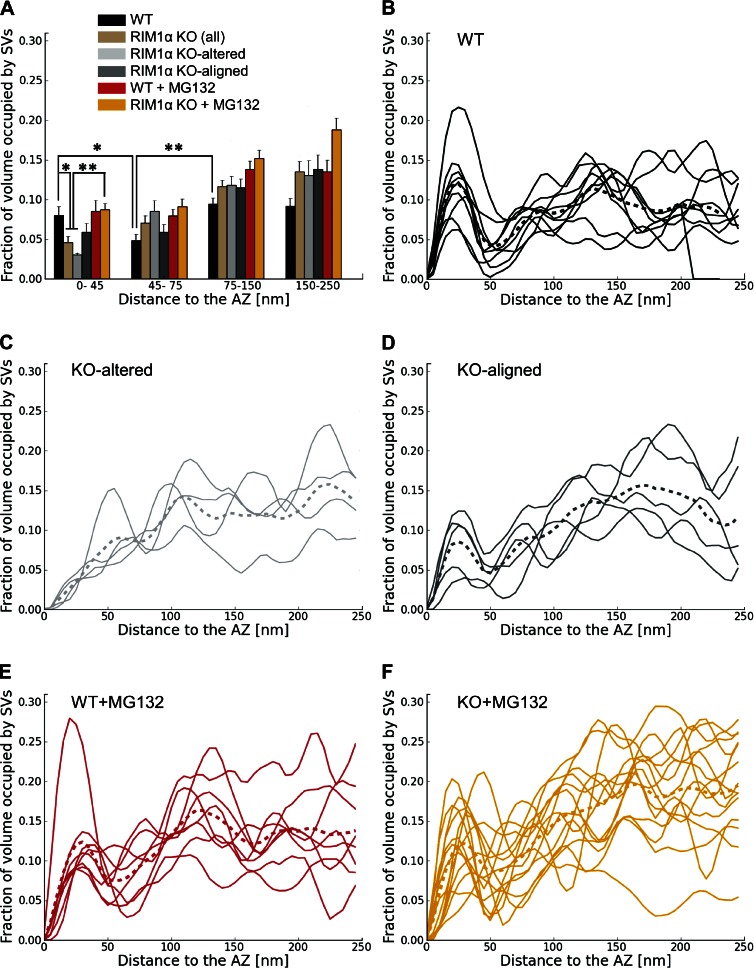
Figure 2.
Synaptic vesicle concentration. For vesicles within 250 nm from the AZ, shown as the fraction of cytoplasmic volume occupied by vesicles, according to their distance to the AZ. (A) Mean vesicle concen...
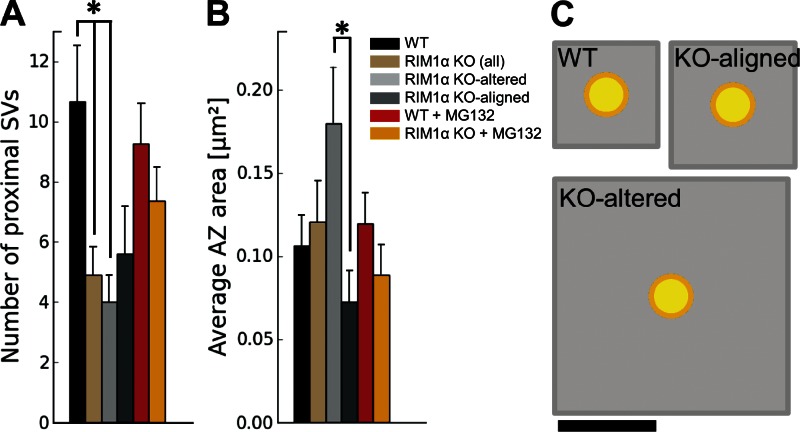
Figure 3.
AZ organization. (A) Number of proximal synaptic vesicles (SV; within 45 nm from the AZ) per synapse, which was significantly reduced in RIM1u03b1 KO synapses. (B) Average AZ area. A and B show mean v...
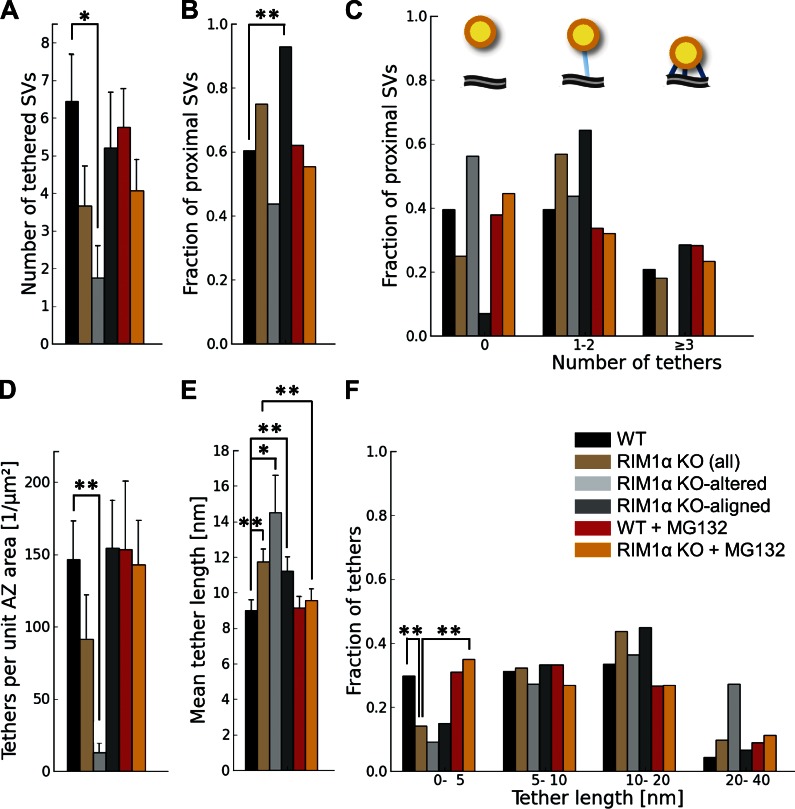
Figure 4.
Synaptic vesicle tethers to the AZ. For proximal vesicles (within 45 nm from the AZ, as virtually no vesicles were tethered in more distal areas). (A) Number of tethered vesicles per synapse, which wa...
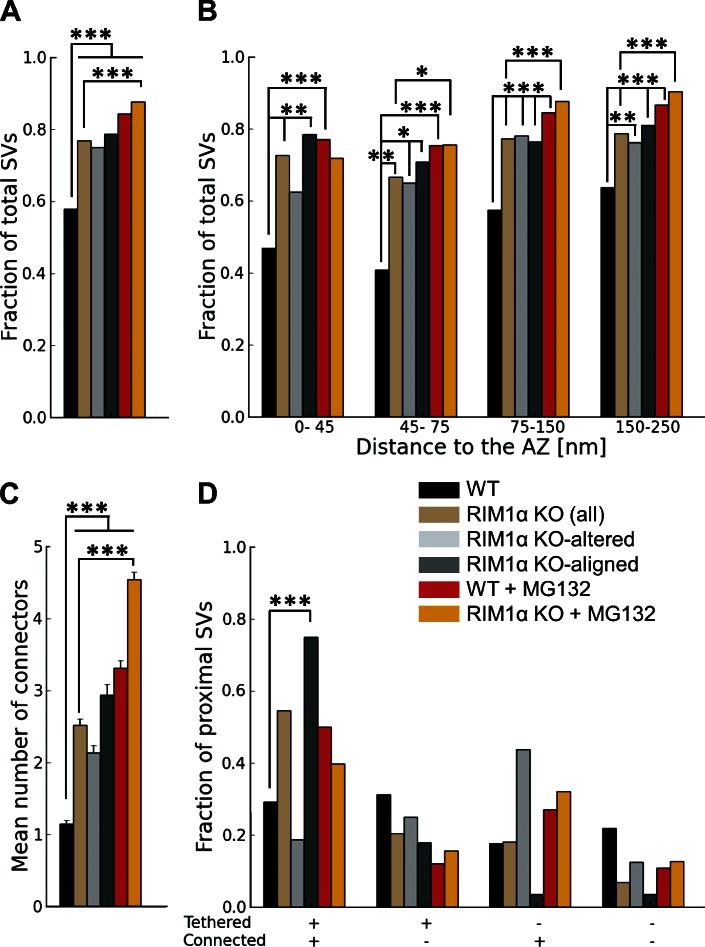
Figure 5.
Synaptic vesicle connectors for vesicles within 250 nm from the AZ. Connectivity increased both in WT and RIM1a KO under MG132 treatment. (A) Fraction of connected vesicles. (B) Fraction of connected ...
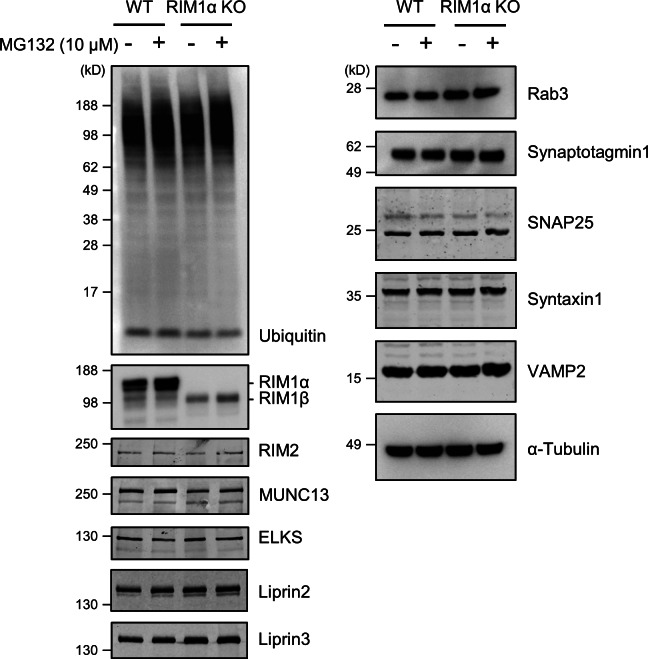
Figure 6.
Western blot analysis for ubiquitin and various presynaptic proteins. The double band detected for RIM1u03b1 corresponds to splice variants (see, e.g., Fig. 1 of Kaeser et al., 2008 ). MG132 induced a...
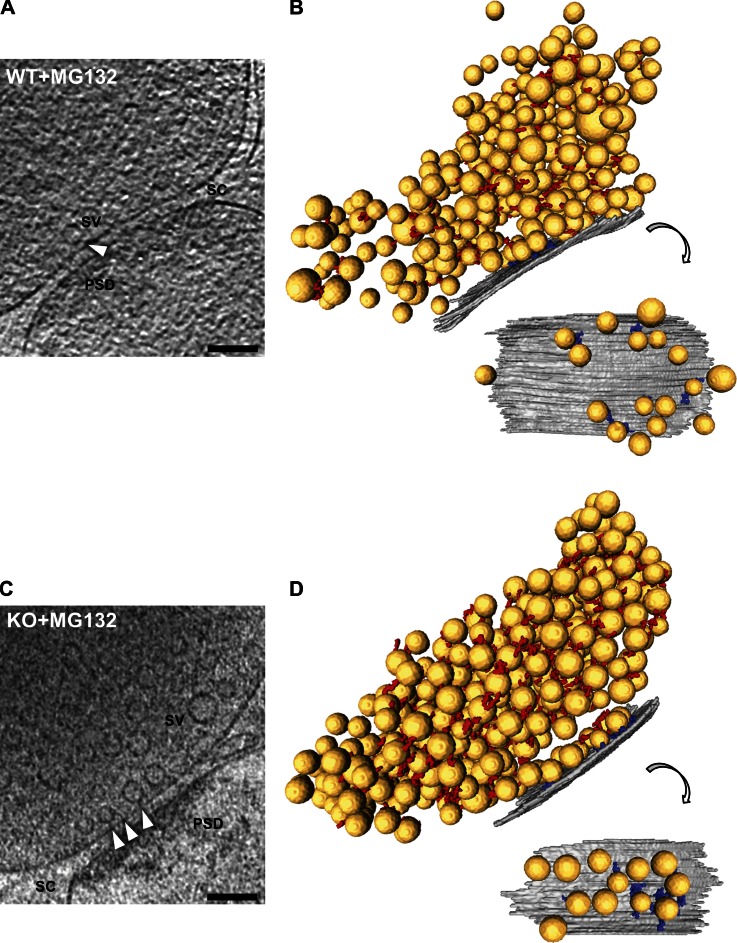
Figure 7.
Morphology of MG132-treated WT and RIM1u03b1 KO synapses by cryo-ET. (A and C) Tomographic slices of MG132-treated WT (A) and RIM1u03b1 KO (C) synapses. PSD, postsynaptic density; SC, synaptic cleft; ...
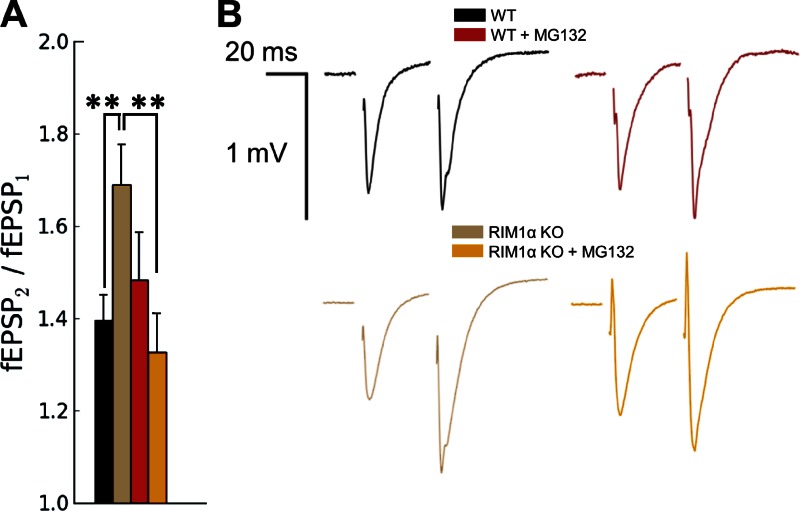
Figure 8.
Excitatory synaptic responses to paired-pulse stimulation in WT and RIM1u03b1 KO mice in the absence and presence of MG132. (A) PPF (fEPSP 2 /fEPSP 1 ) recorded in stratum radiatum of CA1. The graph s...
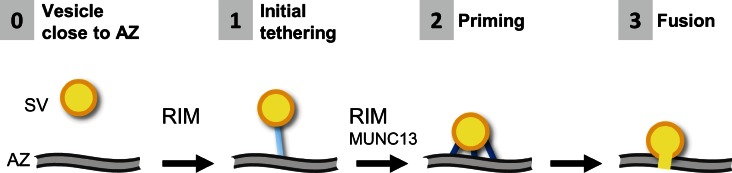
Figure 9.
Model for RIM-mediated synaptic vesicle priming. In WT terminals, vesicles (synaptic vesicle [SV]) that are close to the AZ (0) are first linked to the AZ (1) by one or few tethers (blue rods) in a RI...
Figure images are served from the NIH/NLM PubMed Central Open Access Subset or Europe PMC; copyright remains with the publishers and authors.
💬 Discussion
0 commentsNo comments yet. Be the first to start a discussion!
Leave a Comment