Abstract
AbstractLysenin from the coelomic fluid of the earthworm Eisenia fetida belongs to the aerolysin family of small β-pore-forming toxins (β-PFTs), some members of which are pathogenic to humans and animals. Despite efforts, a high-resolution structure of a channel for this family of proteins has been elusive and therefore the mechanism of activation and membrane insertion remains unclear. Here we determine the pore structure of lysenin by single particle cryo-EM, to 3.1 Å resolution. The nonameric assembly reveals a long β-barrel channel spanning the length of the complex that, unexpectedly, includes the two pre-insertion strands flanking the hypothetical membrane-insertion loop. Examination of other members of the aerolysin family reveals high structural preservation in this region, indicating that the membrane-insertion pathway in this family is conserved. For some toxins, proteolytic activation and pro-peptide removal will facilitate unfolding of the pre-insertion strands, allowing them to form the β-barrel of the channel.
🔬 Techniques
🔭 Microscopes
🧬 Organisms
💻 Software
✨ Fluorophores
🏭 Microscope Brands
🧪 Reagent Suppliers
📷 Detectors
💻 Software Details
💾 Data Repositories
🏛️ Research Organizations (ROR)
Affiliated research institutions:
📋 Methods
Recombinant protein production and purification
For expression of lysenin, recombinant plasmid pHis-Parallel1-Lys was transformed into E. coli Rosetta 2 (DE3) cells (Merck, Darmstadt, Germany) and expression of lysenin was induced using the autoinduction system 38 as follows. Cells (2 l) were grown in ZYM-5052 autoinducing medium supplemented with 100 μg ml −1 ampicillin and 34 μg ml −1 chloramphenicol and cultured at 37 °C for 3 h at 300 r.p.m., then for a further 24 h at 20 °C, 300 r.p.m. Cells were harvested by centrifugation and the cell pellet was lysed by 200 ml BugBuster Protein Extraction Reagent (Merck) containing 200 μl rlysozyme (1 kU μl −1 ) (Merck) and 200 μl Benzonase Nuclease (25 U μl −1 ) (Merck). The cell suspension was incubated on a rotating mixer for 25 min at room temperature and centrifuged at 16,000 g for 20 min at 4 °C to separate soluble and insoluble fractions. The supernatant was loaded onto His GraviTrap columns (GE Healthcare Life Sciences, Little Chalfont, UK) following the manufacturer's guidelines. In brief, His-tagged proteins were bound to the affinity column using a buffer composed of 20 mM sodium phosphate, 500 mM NaCl and 20 mM imidazole, pH 7.4. The column was washed with a buffer composed of 20 mM sodium phosphate, 500 mM NaCl and 60 mM imidazole, pH 7.4. Recombinant toxin was eluted in a buffer composed of 20 mM sodium phosphate, 500 mM NaCl and 500 mM imidazole, pH 7.4. All purification steps were carried out at 4 °C. For buffer exchange and sample clean up, toxin containing eluate was applied to a PD-10 Desalting Column (GE Healthcare Life Sciences) and eluted in DPBS buffer pH 7.0–7.2 (Invitrogen). Protein concentrations were determined using the BCA assay (Fisher Scientific UK Ltd, Loughborough, UK).
Show full methods section
Recombinant protein production and purification
For expression of lysenin, recombinant plasmid pHis-Parallel1-Lys was transformed into E. coli Rosetta 2 (DE3) cells (Merck, Darmstadt, Germany) and expression of lysenin was induced using the autoinduction system 38 as follows. Cells (2 l) were grown in ZYM-5052 autoinducing medium supplemented with 100 μg ml −1 ampicillin and 34 μg ml −1 chloramphenicol and cultured at 37 °C for 3 h at 300 r.p.m., then for a further 24 h at 20 °C, 300 r.p.m. Cells were harvested by centrifugation and the cell pellet was lysed by 200 ml BugBuster Protein Extraction Reagent (Merck) containing 200 μl rlysozyme (1 kU μl −1 ) (Merck) and 200 μl Benzonase Nuclease (25 U μl −1 ) (Merck). The cell suspension was incubated on a rotating mixer for 25 min at room temperature and centrifuged at 16,000 g for 20 min at 4 °C to separate soluble and insoluble fractions. The supernatant was loaded onto His GraviTrap columns (GE Healthcare Life Sciences, Little Chalfont, UK) following the manufacturer's guidelines. In brief, His-tagged proteins were bound to the affinity column using a buffer composed of 20 mM sodium phosphate, 500 mM NaCl and 20 mM imidazole, pH 7.4. The column was washed with a buffer composed of 20 mM sodium phosphate, 500 mM NaCl and 60 mM imidazole, pH 7.4. Recombinant toxin was eluted in a buffer composed of 20 mM sodium phosphate, 500 mM NaCl and 500 mM imidazole, pH 7.4. All purification steps were carried out at 4 °C. For buffer exchange and sample clean up, toxin containing eluate was applied to a PD-10 Desalting Column (GE Healthcare Life Sciences) and eluted in DPBS buffer pH 7.0–7.2 (Invitrogen). Protein concentrations were determined using the BCA assay (Fisher Scientific UK Ltd, Loughborough, UK).
Haemolysis assay
Fresh whole blood from healthy individuals was collected by venepuncture from the University of Exeter Medical School, NIHR Exeter Clinical Research Facility, Diabetes and Vascular Medicine Centre into neutral tubes and 1 ml whole blood was immediately transferred into 20 ml DPBS buffer pH 7.0–7.2 supplemented with 1 mg ml −1 bovine serum albumin (BSA). Cells were washed three times with DPBS supplemented with 1 mg ml −1 BSA and resuspended to 3 × 10 7 cells per ml in DPBS. Washed cells (3 × 10 6 cells per well) were incubated with a twofold dilution series of purified recombinant lysenin (ranging from 500 to 0.015 ng ml −1 ) in DPBS in round-bottomed 96-well plates in a final volume of 200 μl. DPBS and 0.9% Triton X-100 were used as controls. Following incubation at 37 °C for 30 min and for 30 min on ice, intact cells were removed by centrifugation at 1,500 g for 3 min at 4 °C and the supernatants (100 μl) were transferred to a flat-bottom plate to measure haemoglobin release by absorbance at 415 nm using a Model 680 Microplate Reader (Bio-Rad Laboratories Ltd., Hemel Hempstead, UK). The absorbance values for each sample were normalized by subtracting the absorbance value obtained for untreated cells and haemolytic activity (%) was calculated. The toxin dose required to lyse 50% of the cells (CT 50 ) was determined by nonlinear regression analysis, fitting a variable slope log (dose) versus response curve, constraining F to a value of 50 (logCT 50 =logCTF−(1/HillSlope) × log( F /(100− F )). Results are presented as the mean of triplicate assays±s.e.m.
Lysenin pore assembly
Lipid vesicles containing DOPC, porcine brain sphingomyelin and cholesterol at a molar ratio of 1:1:1 were prepared as follows. Lipids (Avanti Polar Lipids Inc.) dissolved in ethanol were mixed at the appropriate ratio and dried under a nitrogen stream. To ensure no residual solvent remained, lipids were further dried in a vacuum desiccator for 1 h. Lipids were hydrated by addition of buffer (50 mM Tris pH 7.4, 150 mM NaCl) and frozen in liquid nitrogen. Lipid suspensions were then thawed at 37 °C and the freeze–thaw process was repeated two more times. The lipid suspensions were then extruded 21 times through a 200 nm diameter filter using an Avanti lipid extruder and the resulting vesicles were extruded again through a 100 nm filter 21 times. Liposomes were then frozen at −80 °C until further use. Lysenin monomer (480 μl of 1.3 mg ml −1 ) was incubated with liposomes (34 μl of 20 mM lipid) at 37 °C for 30 min to allow binding and pore formation. Unbound lysenin was removed by ultracentrifugation at 50,000 g for 45 min at 7 °C using a Beckman TLA 100 rotor. To screen for a suitable detergent that could efficiently extract and maintain the lysenin pores soluble, the pellets were resuspended in buffers containing 50 mM Tris pH 7.4, 150 mM NaCl and detergent (either 2.5% (w/v) β-OG or 30 mM LDAO or 40 mM C10E6 or 2% (w/v) DDM) and incubated at room temperature for 1 h with occasional shaking. Unsolubilized material was removed by ultracentrifugation as described above. For DDM extracted samples, solubilized lysenin oligomers were then bound to the Ni-NTA resin, which was subsequently washed with 20 vol of 50 mM Tris pH 7.4, 150 mM NaCl, 0.02% (w/v) DDM, followed by elution in 2 vol of 50 mM Tris pH 7.4, 150 mM NaCl, 500 mM imidazole and 0.02% (w/v) DDM.
Specimen preparation and data collection
Specimens were plunge-frozen using a custom fabricated plunger at 4 °C. Lysenin oligomers (3 μl of ∼0.2 mg ml −1 ) were applied to copper 300 square mesh Quantifoil R1.2/1.3 holey-carbon grids (Quantifoil Micro Tools, GmbH) overlaid with graphene oxide (see below) and left to adhere for 30 s. The grids were then blotted from the specimen side for 10 s before being plunge-frozen in liquid ethane. Specimens were imaged on an FEI Titan Krios transmission electron microscope operating at an accelerating voltage of 300 kV. Micrographs were recorded in super-resolution counting mode using a Gatan K2 Summit direct electron detector at the end of a Gatan Quantum energy filter in zero-loss mode and an energy selecting slit width of 20 eV. The total dose on the specimen was 47 e − per Å 2 fractionated over 20 frames with a calibrated pixel size of 0.715 Å for the super-resolution micrographs.
Image processing
Micrograph frame stacks were binned by two, subjected to drift-correction using MOTIONCORR 39 and contrast transfer function (CTF) parameters were determined using GCTF 40 . An initial model for refinement was generated using EMAN2 (ref. 41 ). All subsequent image processing steps were performed with RELION 42 . Semi-automated particle picking was performed using the documented procedures 43 , resulting in 53,779 particles from 268 micrographs. Two rounds of 2D classification were used to remove incorrectly selected particles, particularly ones at the graphene layer interfaces. The remaining 42,830 particles were then used for initial refinement and reconstruction that led to a map with a resolution of 3.4 Å with C9 symmetry or 4.2 Å with no symmetry imposed. Movie particle extraction followed by per particle beam-induced motion correction and radiation-damage weighting 22 resulted in a polished data set that was then subjected to 3D classification. Two of the 3 resulting 3D classes were combined and the resulting 29,329 particles were used for further refinement. The final map from these particles was sharpened with a B -factor of −61 Å 2 and the ‘gold standard' 42 resolution was 3.14 Å at a Fourier shell correlation (FSC) of 0.143 ( Supplementary Fig. 4a ). The accuracy of rotation and translation during refinement was 0.86 pixels and 0.33 pixels, respectively. Local resolution estimation was performed using RESMAP 44 as implemented in RELION.
Model building and refinement
The wild-type lysenin crystal structure 9 (PDB ID 3ZXD) was used as a template for de novo modelling of the N terminus after the C-terminal 150 residues, which form the β-trefoil receptor-binding domain. All model building was performed in Coot 45 . The model is lacking the 9N-terminal residues, for which we could not see density. Refinement of the model to improve fitting, geometry and atom clashes was carried out using REFMAC 5.8 (ref. 46 ) with non-crystallographic symmetry constraints to account for the ninefold symmetry and secondary structure restraints generated by PROSMART 47 . Cross-validation of the refinement parameters used to avoid over-fitting was carried out by refining the model against the first unfiltered half map and comparing the FSC of the same model versus both half maps ( Supplementary Fig. 4b ).
Graphene oxide specimen support preparation
Graphene oxide dispersion in H 2 O (Sigma) was diluted to 0.2 mg ml −1 in H 2 O and spun at 300 g for 30 s to remove large aggregates. Quantifoil R1.2/1.3 holey grids were glow discharged for 1 min and 3 μl of the graphene suspension was added to the grids for 1 min. Grids were subsequently blotted briefly using Whatman No1 filter paper and washed three times on 20 μl drops of H 2 O (twice on the graphene side and once on the reverse side). Grids were then used for plunge-freezing without further treatment.
Supplementary Material Supplementary Figures Supplementary Figures 1-6 Supplementary Movie 1 The movie shows the transition of the water-soluble monomers to the membrane-inserted state as seen from the side and top (extracellular) views. The monomers (PDB ID 3ZXD) have been arranged in a hypothetical pre-pore assembly by imposing 9-fold symmetry on the monomer, oriented in respect to the receptor-binding domain of the membrane-inserted form. The colouring scheme is as in the main text: β-hairpin domain (olive), cap domain (pink) and receptor binding domain (cyan).
📊 Figures
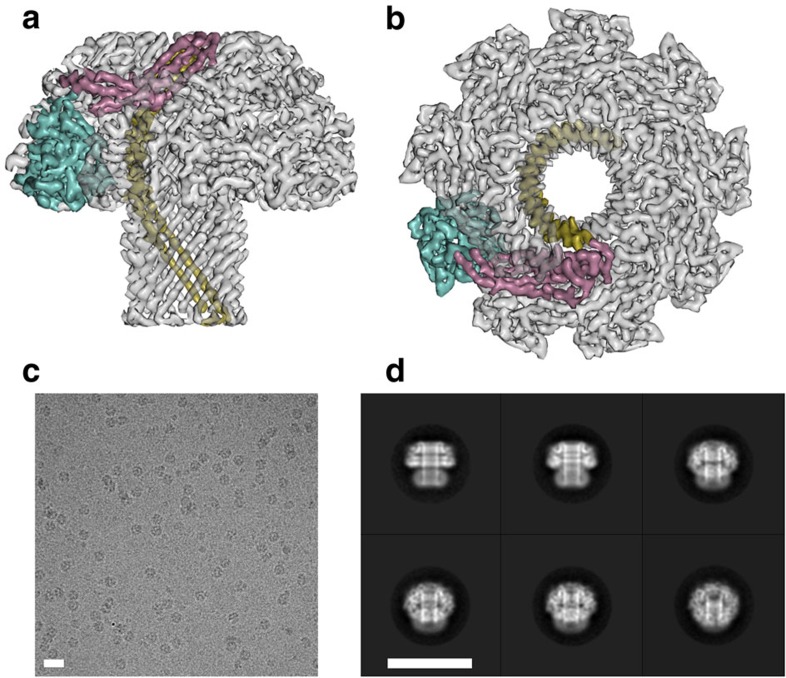
Figure 1
Cryo-EM reconstruction of the lysenin pore.
Surface representation of the sharpened 3.1u2009u00c5 map of lysenin shown from the side ( a ) and extracellular views ( b ). Side chain densities are clearly visible on the u03b2-barrel pore. The thr...
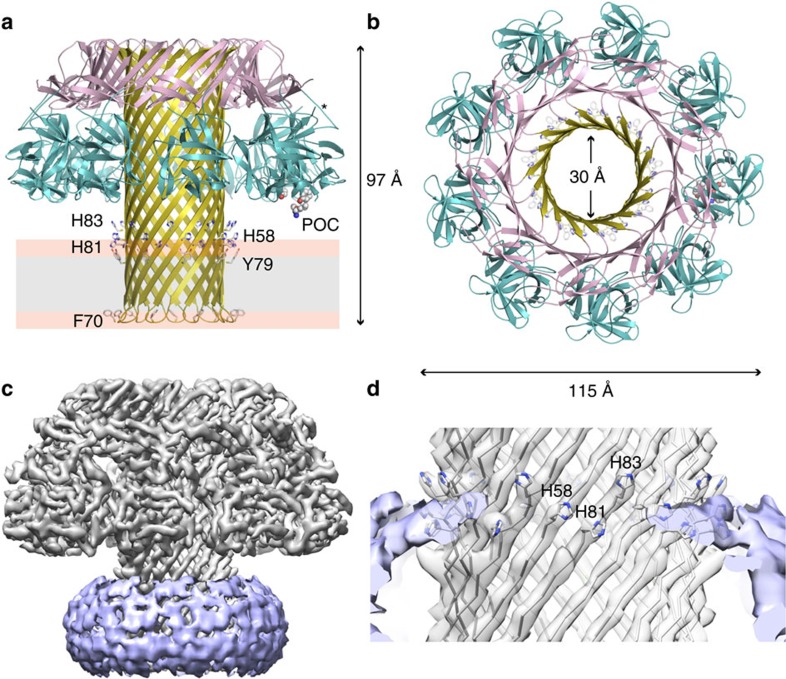
Figure 2
Atomic model of the lysenin pore.
Cartoon representation of lysenin shown from the side ( a ) and extracellular views ( b ). The three domains of lysenin are coloured as in Fig. 1 : u03b2-hairpin domain (olive), cap domain (pink) and ...
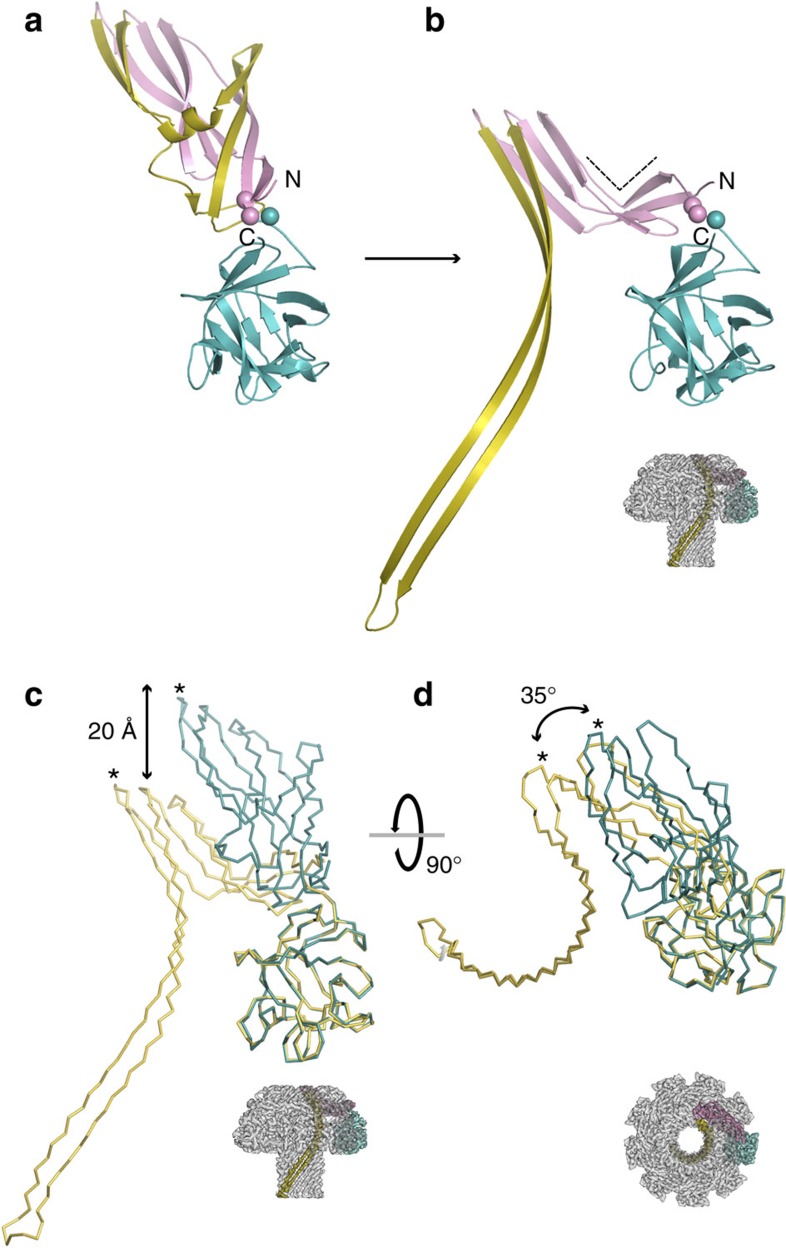
Figure 3
Transition of water-soluble lysenin monomer to its membrane-inserted state.
( a ) Cartoon representation of the lysenin monomer (PDB ID 3ZXD) and its membrane-inserted state ( b ) with both molecules aligned in respect to the receptor-binding domain in the orientation indicat...
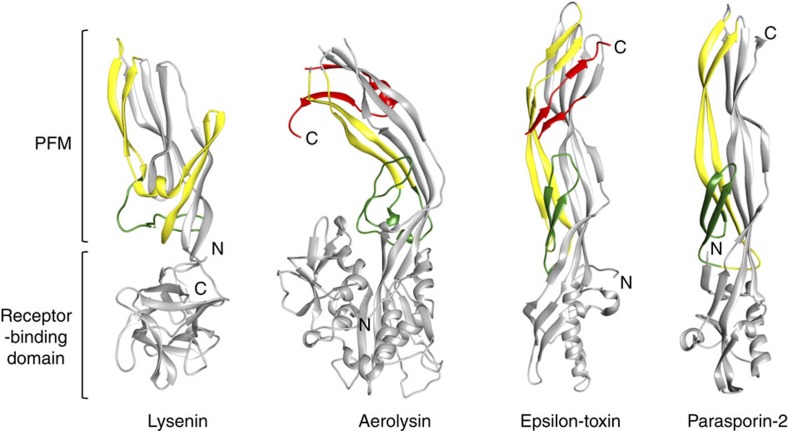
Figure 4
Conserved mechanism of membrane insertion by the aerolysin family.
Comparison of the water-soluble monomeric structure of lysenin with three other members of the aerolysin family. The putative u03b2-barrel-contributing regions in aerolysin (1PRE), epsilon toxin (3ZJX...
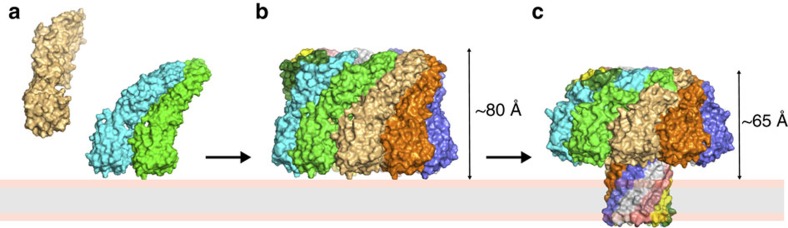
Figure 5
Model for the mode of action by lysenin.
( a ) Lysenin monomers (PDB ID 3ZXD) will initially bind to the target cell membrane through interactions between the receptor-binding domain and POC head groups. ( b ) On membrane binding, the local ...
Figure images are served from the NIH/NLM PubMed Central Open Access Subset or Europe PMC; copyright remains with the publishers and authors.
💬 Discussion
0 commentsNo comments yet. Be the first to start a discussion!
Leave a Comment