Abstract
TRPML3 channels are mainly localized to endolysosomes and play a critical role in the endocytic pathway. Their dysfunction causes deafness and pigmentation defects in mice. TRPML3 activity is inhibited by low endolysosomal pH. Here we present cryo-electron microscopy (cryo-EM) structures of human TRPML3 in the closed, agonist-activated, and low-pH-inhibited states, with resolutions of 4.06, 3.62, and 4.65 Å, respectively. The agonist ML-SA1 lodges between S5 and S6 and opens an S6 gate. A polycystin-mucolipin domain (PMD) forms a luminal cap. S1 extends into this cap, forming a 'gating rod' that connects directly to a luminal pore loop, which undergoes dramatic conformational changes in response to low pH. S2 extends intracellularly and interacts with several intracellular regions to form a 'gating knob'. These unique structural features, combined with the results of electrophysiological studies, indicate a new mechanism by which luminal pH and other physiological modulators such as PIP2 regulate TRPML3 by changing S1 and S2 conformations.
🔬 Techniques
🔭 Microscopes
✨ Fluorophores
🧪 Sample Preparation
🔬 Cell Lines
🏭 Microscope Brands
🧪 Reagent Suppliers
💻 Software Details
💾 Data Repositories
🏛️ Research Organizations (ROR)
Affiliated research institutions:
📋 Methods
Molecular biology The DNA fragment encoding full-length human TRPML3 channel was cloned into a modified pFastBac1 vector. A maltose binding protein (MBP) tag was added before the N terminus of TRPML3, and a linker sequence containing the tobacco etch virus (TEV) protease recognition sequence was inserted between the MBP tag and TRPML3. For electrophysiology experiments, the full-length TRPML3 gene was cloned into a pIRES2-EGFP vector. All site-specific mutants were subsequently generated in this TRPML3_pIRES2-EGFP construct by PCR-based overlapping extension.
Protein purification
The baculovirus of TRPML3 was generated with Sf9 cells using the standard Bac-to-Bac method (Invitrogen). Tni insect cells grown in suspension in ESF921 medium (Expression Systems) were infected with the TRPML3 virus. Forty-eight hours after infection, cells were harvested by centrifugation at 4 °C, and suspended in a buffer containing 50 mM NaH 2 PO 4 -Na 2 HPO 4 pH 8.0, 500 mM NaCl and 5% glycerol (buffer A) in the presence of cOmplete protease inhibitor cocktail (Roche). After cell disruption by sonication, cell debris was removed by centrifugation at 3,200 g for 10 min at 4 °C and cell membrane was pelleted from the supernatant by ultracentrifugation at 150,000 g for 1 h at 4 °C. Membrane was suspended in buffer A containing protease inhibitor cocktail and homogenized with a glass dounce homogenizer. TRPML3 protein was extracted with 1% Lauryl Maltose Neopentyl Glycol (LMNG, Anatrace) for 1 h at 4 °C. The solubilized membrane was clarified by ultracentrifugation at 150,000 g for 30 min and incubated with amylose resin (NEB) for 2 h at 4 °C with gentle agitation. Subsequently, the resin was collected by low speed spin at 800 g , transferred into a gravity column, and washed with buffer A containing 0.5 mM LMNG and 0.1 mg/ml soybean lipids (Avanti polar lipids). MBP-tagged TRPML3 protein was eluted from amylose resin with 20 mM maltose in the above wash buffer. For samples at pH 7.4, the eluted protein was mixed with amphipol A8–35 (Anatrace) at 1:6 (w/w) ratio and incubated overnight at 4 °C with gentle agitation. Detergent was removed by incubation with Bio-Beads SM-2 (Bio-Rad) for 8 h. After removal of Bio-Beads, the protein sample was mixed with TEV protease (100 μg/mg TRPML3) and incubated at 4 °C overnight to cleave the MBP tag. TRPML3 protein was concentrated and further purified on a Superose 6 (GE Healthcare) column in a buffer containing 20 mM HEPES-NaOH (pH7.4) and 150 mM NaCl. Fractions containing the TRPML3 protein were examined by negative staining EM, and then pooled and concentrated. ML-SA1 was added to for the complex before cryo sample was prepared (see below). For sample at pH 4.8 sample, the protein eluted from amylose resin in detergent solution was mixed with TEV protease (100 μg/mg TRPML3) and incubated overnight at 4 °C. Then the protein was concentrated and further purified on a superpose 6 column in a buffer containing 20 mM HEPES-NaOH (pH7.4), 150 mM NaCl, and 0.5 mM LMNG. Fractions containing the TRPML3 protein were pooled and concentrated, and the pH was changed to 4.8 before cryo sample preparation (see below). Proteins were concentrated by ultrafiltration using the Amicon Centrifugal Filter Units (EMD Millipore), and their concentrations were measured by using a Bradford Protein Assay kit (Bio-Rad).
Show full methods section
Molecular biology The DNA fragment encoding full-length human TRPML3 channel was cloned into a modified pFastBac1 vector. A maltose binding protein (MBP) tag was added before the N terminus of TRPML3, and a linker sequence containing the tobacco etch virus (TEV) protease recognition sequence was inserted between the MBP tag and TRPML3. For electrophysiology experiments, the full-length TRPML3 gene was cloned into a pIRES2-EGFP vector. All site-specific mutants were subsequently generated in this TRPML3_pIRES2-EGFP construct by PCR-based overlapping extension.
Protein purification
The baculovirus of TRPML3 was generated with Sf9 cells using the standard Bac-to-Bac method (Invitrogen). Tni insect cells grown in suspension in ESF921 medium (Expression Systems) were infected with the TRPML3 virus. Forty-eight hours after infection, cells were harvested by centrifugation at 4 °C, and suspended in a buffer containing 50 mM NaH 2 PO 4 -Na 2 HPO 4 pH 8.0, 500 mM NaCl and 5% glycerol (buffer A) in the presence of cOmplete protease inhibitor cocktail (Roche). After cell disruption by sonication, cell debris was removed by centrifugation at 3,200 g for 10 min at 4 °C and cell membrane was pelleted from the supernatant by ultracentrifugation at 150,000 g for 1 h at 4 °C. Membrane was suspended in buffer A containing protease inhibitor cocktail and homogenized with a glass dounce homogenizer. TRPML3 protein was extracted with 1% Lauryl Maltose Neopentyl Glycol (LMNG, Anatrace) for 1 h at 4 °C. The solubilized membrane was clarified by ultracentrifugation at 150,000 g for 30 min and incubated with amylose resin (NEB) for 2 h at 4 °C with gentle agitation. Subsequently, the resin was collected by low speed spin at 800 g , transferred into a gravity column, and washed with buffer A containing 0.5 mM LMNG and 0.1 mg/ml soybean lipids (Avanti polar lipids). MBP-tagged TRPML3 protein was eluted from amylose resin with 20 mM maltose in the above wash buffer. For samples at pH 7.4, the eluted protein was mixed with amphipol A8–35 (Anatrace) at 1:6 (w/w) ratio and incubated overnight at 4 °C with gentle agitation. Detergent was removed by incubation with Bio-Beads SM-2 (Bio-Rad) for 8 h. After removal of Bio-Beads, the protein sample was mixed with TEV protease (100 μg/mg TRPML3) and incubated at 4 °C overnight to cleave the MBP tag. TRPML3 protein was concentrated and further purified on a Superose 6 (GE Healthcare) column in a buffer containing 20 mM HEPES-NaOH (pH7.4) and 150 mM NaCl. Fractions containing the TRPML3 protein were examined by negative staining EM, and then pooled and concentrated. ML-SA1 was added to for the complex before cryo sample was prepared (see below). For sample at pH 4.8 sample, the protein eluted from amylose resin in detergent solution was mixed with TEV protease (100 μg/mg TRPML3) and incubated overnight at 4 °C. Then the protein was concentrated and further purified on a superpose 6 column in a buffer containing 20 mM HEPES-NaOH (pH7.4), 150 mM NaCl, and 0.5 mM LMNG. Fractions containing the TRPML3 protein were pooled and concentrated, and the pH was changed to 4.8 before cryo sample preparation (see below). Proteins were concentrated by ultrafiltration using the Amicon Centrifugal Filter Units (EMD Millipore), and their concentrations were measured by using a Bradford Protein Assay kit (Bio-Rad).
Cryo-EM sample preparation and data acquisition
Cryo-EM samples of TRPML3 in three different states were prepared. For the apo TRPML3 sample in pH 7.4 solution, a drop of 4 μl sample at a concentration of 1.9 mg/ml was loaded onto glow-discharged Quantifoil holey carbon grid (R1.2/1.3, 300 mesh, ELECTRON MICROSCOPY SCIENCES). After waiting for 3s, the grid was blotted for 4s under 100% humidity at 8℃ using FEI Vitrobot (double-sided, blot force 1) and immediately plunged into liquid ethane cooled by liquid-nitrogen. Cryo sample of the TRPML3/ML-SA1 complex was prepared the same way as the apo sample, except that 100 mM ML-SA1 in DMSO was added to protein sample to a final concentration of 100 μM before freezing. For TRPML3 sample at pH 4.8, protein in 20 mM HEPES-NaOH (pH7.4), 150 mM NaCl, and 0.5 mM LMNG was concentrated to 2 mg/ml. 1 M Na acetate pH 4.6 buffer was added to the protein solution to a final concentration of 100 mM. The pH of the mixed HEPES and acetate buffer was verified to be 4.8. The samples of TRPML3/MLSA1 complex and TRPML3 at pH 4.8 were observed using a Titan Krios microscope (FEI) operated at 300 kV, equipped with a K2 Summit direct electron detector (Gatan) working in super-resolution counting mode with a pixel size of 0.669 Å. The detector was placed at the end of a GIF Quantum energy filter (Gatan), operated in zero-energy-loss mode with a slit width of 20 eV. The Etas (developed by Bo Shen at Xueming Li lab) was used for data collection under a defocus ranged from −1.0 μm to −2.5 μm. Each micrograph was dose-fractionated to 32 frames with 0.25s exposure time in each frame. The dose rate was 8.2 counts per physical pixel per second, resulting in a total dose of ~ 50 e − /Å 2 . The data acquisition condition for the TRPML3 protein at pH 7.4 was mostly the same as described above except that the Titan Krios used was not equipped with GIF Quantum energy filter, the pixel size was 0.66 Å and the defocus ranged from −1.5 μm to −3.0 μm.
Image processing
The cryo-EM super-resolution micrographs were 2×2 binned. Motion correction was performed using the MotionCorr2 program 59 to generate integrated micrographs for further processing. CTFFIND3 program was used to determine defocus values 60 . As for the data of apo TRPML3 at pH 7.4, the full data set of 2,721 micrographs was divided into two subsets with 726 and 1,995 micrographs, respectively, each subset was subjected to two rounds of two-dimensional classification and then the selected particles were classified into four classes in the three-dimensional classification procedure. The map of CNG channel 61 low-pass filtered to 60 Å was used as the initial model. Particle heterogeneity was observed among the resulting 3D classes, which presented two typical conformations: a near-perfect tetramer in the first subset and a defective tetramer with two missing/flexible domain in the second subset. So two rounds of two-references 3D classification was performed as described previously 61 . Finally, 43,542 particles corresponding to the near-perfect tetramer were gathered and subjected to final 3D refinement with C4 symmetry imposed, which resulted in a final map at 4.06 Å resolution. As for TRPML3 at pH 4.8 buffer and TRPML3/MLSA1 complex, the image processing procedure was almost the same, after two rounds of 2D classification and one round 3D classification, the best one or two 3D classes were selected and gathered for final refinement. All the 2D classification, 3D classification and refinement procedure were performed by RELION 1.4 62 . The final refinement of TRPML3/ML-SA1 complex was done by using THUNDER, a software developed by Mingxu Hu, Hongkun Yu and colleagues in Xueming Li Lab and is in preparation for publication. The 3D reconstruction obtained by THUNDER had a 3.62 Å resolution, higher than the 3.82 Å resolution obtained by RELION 1.4. As for the sample at pH 4.8, a 4.65 Å map was reconstructed. All resolutions were estimated by the gold-standard Fourier shell correlation (FSC) = 0.143 criterion. ResMap 63 was used to calculate the local resolution map. The normalized difference map between the ML-SA1-bound pH 7.4 and apo pH 7.4 structures was calculated by using THUNDER and was filtered to 6.0 Å. Code Availability The THUNDER software is in preparation for publication and is available from X.L. upon request.
Model building and refinement and validation
Atomic models were built in Coot 64 . The 3.62 Å density map of the TRPML3/ML-SA1 complex was used for de novo manual model building of the transmembrane. Densities of the side chains for bulky residues (Trp, Tyr and Phe) and predicted transmembrane ranges were used to guide amino acid assignment. The homologous crystal structure of the I-II linker of human TRPML1 (PDB ID: 5TJA) was docked into the density map using USCF chimera 65 , mutated into human TRPML3 sequence and rebuilt in Coot. Atomic model for membrane-proximal N- and C- termini and cytoplasmic II-III linker was built, although the densities of the side chains of some amino acids were missing. Atomic model was built for one subunit, and then the tetramer model of the channel was generated by 4-fold rotational symmetry operation. This model was then used as an initial model and was rebuilt into the density map of apo TRPML3. Extra densities in the map of the TRPML3/ML-SA1 complex was found where an atomic model of the ligand ML-SA1 (coordinates downloaded from https://pubchem.ncbi.nlm.nih.gov ) was tentatively put in. For TRPML3 at pH 4.8, individual transmembrane fragments and the PMD domain from the apo model were fitted into the density in UCSF chimera. The model was then manually rebuilt in COOT. Residues missing side chain densities were mutated to alanine. All three models were refined in reciprocal-space using Phenix 66 . Coordinates and individual B-factors were refined using maximum likelihood refinement, with secondary structure restraints and strict NCS constraints. Overfitting of the atomic model was checked by using methods described previously 67 . The coordinates were randomly displaced up to 0.2 A, and the new model was then refined against one of the two half maps generated. FSC values were calculated between the resulting model and the two half maps, as well as the averaged map of two half maps. The quality of the models was evaluated by MolProbity 68 . PyMOL and UCSF Chimera were used to make figures. The pore radius was calculated with HOLE software 69 .
Electrophysiology
Human embryonic kidney (HEK) 293T cells (American Type Culture Collection (ATCC), not tested for mycoplasma) were grown in DMEM (Gibco) plus 10% Fetal Bovine serum (VWR) and penicillin (100 U/ml)/streptomycin (0.1 mg/ml) (SIGMA). HEK 293T cells were transiently transfected with WT or mutant TRPML3 using LipoD293 (SignaGen Laboratories) and used in 48 h. All experiments were performed at room temperature (~22 °C). Pipettes were fabricated from borosilicate glass (Corning PYREX) using a micropipette puller (PC-10, NARISHIGE), and were fire-polished to resistances of 2~3 MΩ for whole-cell recording. Whole-cell currents were elicited by 400-ms voltage ramps from −100 to +100 mV at a frequency of 0.5 Hz with a holding potential of 0 mV. Currents were amplified by Axopatch 200B and digitized by Digidata 1322A (Molecular Devices). Currents were low-pass filtered at 1 kHz and sampled at 1 kHz. pCLAMP 8.2 software (Molecular Devices) was used for data acquisition and analysis. The standard pipette solution contained (in mM) 120 Cesium methanesulfonate, 10 BAPTA, 2 MgCl 2 , 20 HEPES, pH 7.2 adjusted with CsOH. The pH 7.4 standard bath solution contained (in mM) 160 NaCl, 5 KCl, 10 D-glucose, 20 HEPES, pH adjusted with NaOH. The pH 4.6 standard bath solution contained (in mM) 160 NaCl, 5 KCl, 10 D-glucose, 10 HEPES, 10 MES, pH adjusted with NaOH. The pH7.4 Sodium-free solution contained (in mM) 165 NMDG, 10 D-glucose, 10 HEPES, 10 MES, pH adjusted with HCl. Data are presented as mean±s.e.m. Statistical significance was evaluated by using two-tailed Student’s t-test, with **P < 0.01.
Supplementary Material 1 2
📊 Figures
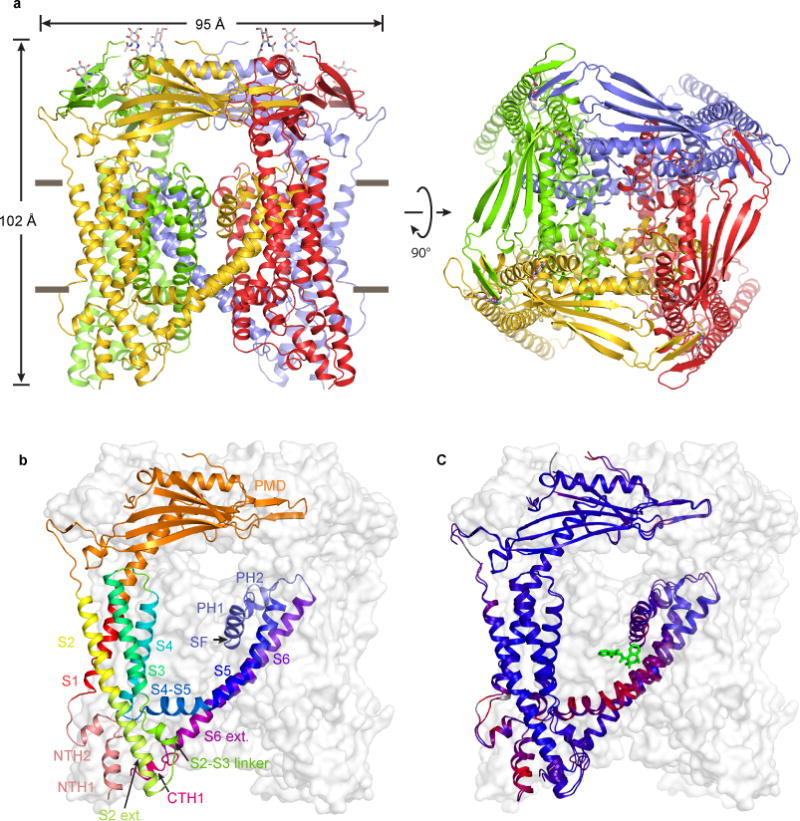
Figure 1
Structures of Apo and Agonist-bound TRPML3
(a) ML-SA1-bound structure, viewed parallel to the membrane (left) and from the luminal/extracellular side of the membrane (right). (b) Structure of a protomer, viewed parallel to the membrane. Differ...
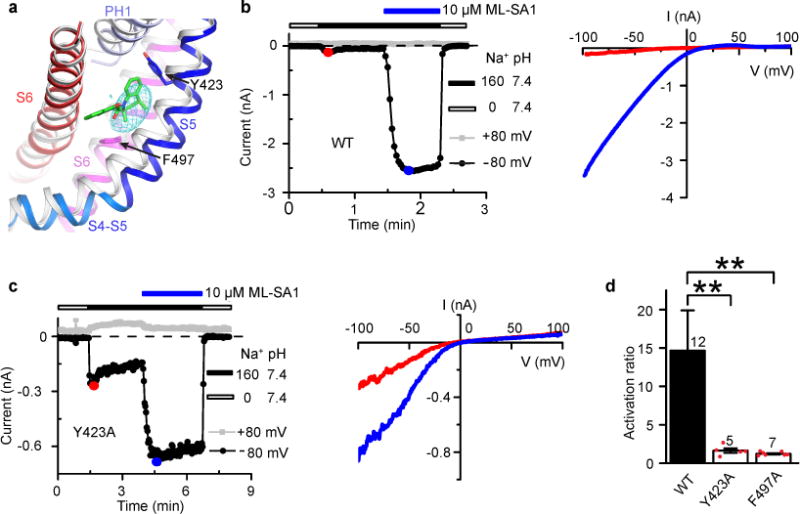
Figure 2
The ML-SA1 Binding Site
(a) Close-up view of the indicated regions in the apo (gray) and ML-SA1-bound (color) structures. The mesh shows the normalized difference density map between the apo and ML-SA1-bound structures. ML-S...
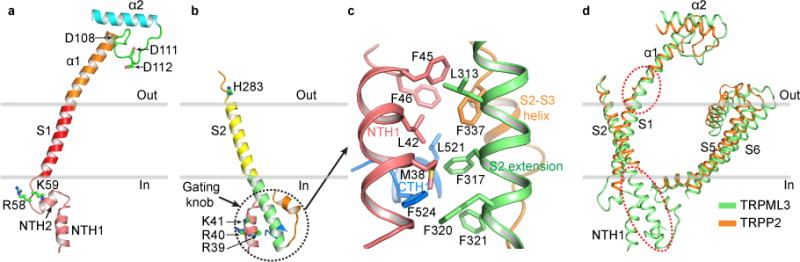
Figure 3
Unique Structural Features of TRPML3
(a) Structure of the S1 gating rod and its end connections, viewed parallel to the membrane. (b) Structure of the S2 gating knob, viewed parallel to the membrane. (c) Close-up view of the gating knob,...
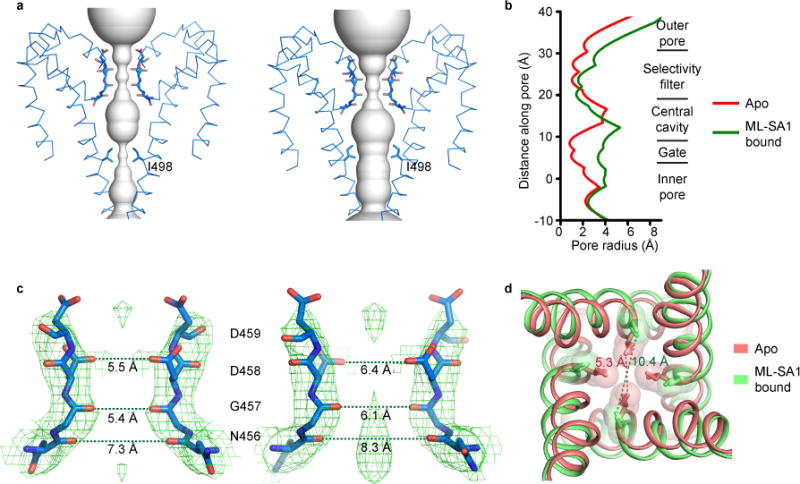
Figure 4
The Pore and Gate
(a) Solvent-accessible pathway in the TMD in the apo (left) and ML-SA1-bound (right) structures. Only two diagonally opposed subunits are shown. (b) Pore-size profile generated with the HOLE program o...
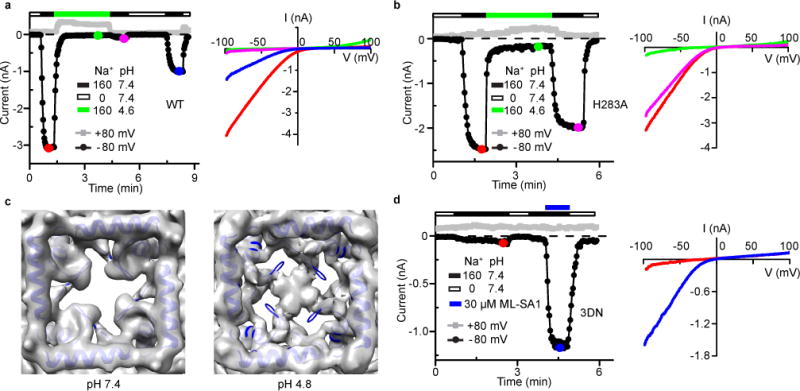
Figure 5
Low-pH-induced Current Inhibition and Conformational Change in the Luminal Pore-loop
(a) Time course (left) and I-V relationships (right) of WT channel currents in response to low pH. Similar results were obtained in 6 recordings. (b) Time course (left) and I-V relationships (right) o...
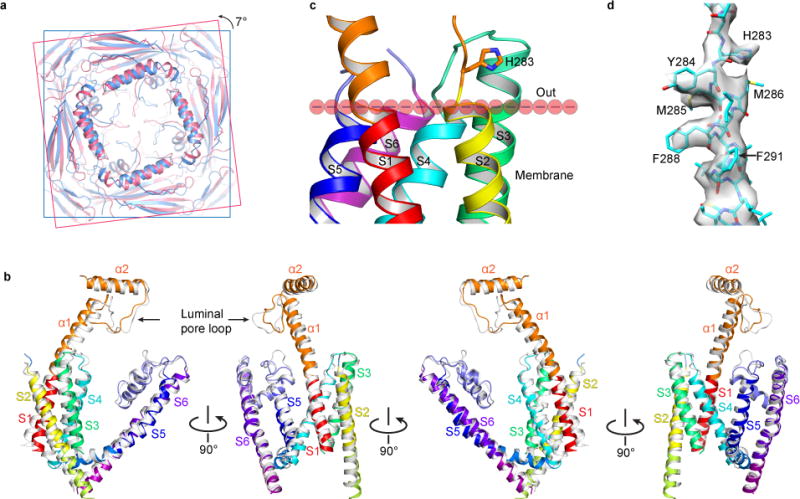
Figure 6
Low-pH-induced Conformational Changes in the PMD and TMD
(a) Superposition of the PMD in the pH 4.8 (creamy) and 7.4 (sky blue) apo structures, viewed from the luminal/extracellular side of the membrane. The former shows a 7-degree counterclockwise rotation...
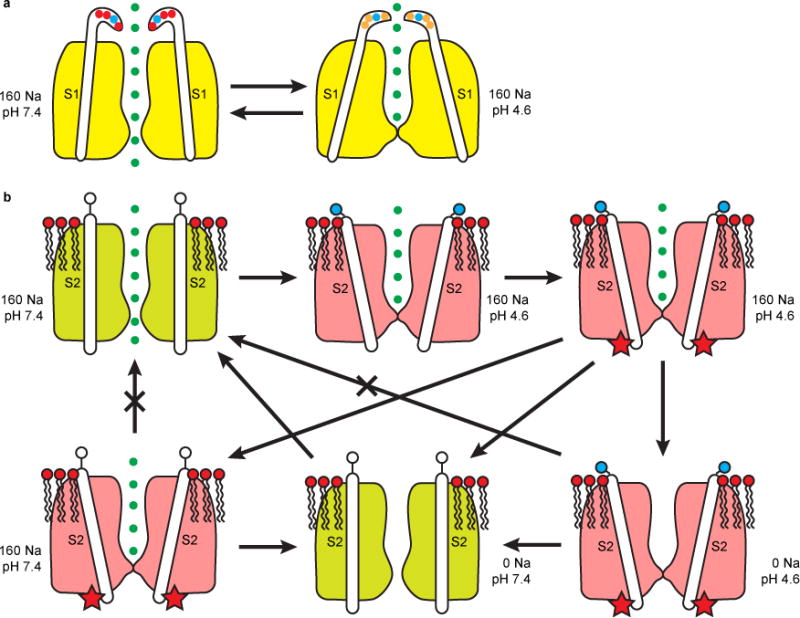
Figure 7
Model of Two Modes of Low-pH Inhibition of TRPML3
(a) Mode 1, reversible inhibition induced by protonation of the luminal pore-loop aspartates and transmitted through S1. (b) Mode 2, long-lasting inhibition induced by protonation of H283 and transmit...
Figure images are served from the NIH/NLM PubMed Central Open Access Subset or Europe PMC; copyright remains with the publishers and authors.
💬 Discussion
0 commentsNo comments yet. Be the first to start a discussion!
Leave a Comment