Abstract
AbstractRecent advances in optical technologies such as multi-photon microscopy and optogenetics have revolutionized our ability to record and manipulate neuronal activity. Combining optical techniques with electrical recordings is of critical importance to connect the large body of neuroscience knowledge obtained from animal models to human studies mainly relying on electrophysiological recordings of brain-scale activity. However, integration of optical modalities with electrical recordings is challenging due to generation of light-induced artifacts. Here we report a transparent graphene microelectrode technology that eliminates light-induced artifacts to enable crosstalk-free integration of 2-photon microscopy, optogenetic stimulation, and cortical recordings in the same in vivo experiment. We achieve fabrication of crack- and residue-free graphene electrode surfaces yielding high optical transmittance for 2-photon imaging down to ~ 1 mm below the cortical surface. Transparent graphene microelectrode technology offers a practical pathway to investigate neuronal activity over multiple spatial scales extending from single neurons to large neuronal populations.
🔬 Techniques
💻 Software
✨ Fluorophores
🧪 Sample Preparation
🔬 Cell Lines
🏭 Microscope Brands
🧪 Reagent Suppliers
🔴 Lasers
📷 Detectors
💻 Software Details
🏛️ Research Organizations (ROR)
Affiliated research institutions:
📋 Methods
Graphene transfer The bubbling transfer method 9 was adopted to protect graphene from cracking during the process. Therefore, 300 nm-thick 495 PMMA A4 was spin-coated on the graphene/copper bilayer structure. This PMMA/graphene/copper tri-layer was then connected to the cathode of a 20 V DC power supply, whereas the anode was submerged in 0.05 M NaOH in deionized water. As the trilayer was gently and gradually immersed into the NaOH solution, hydrogen gas bubbles formed in between the graphene and copper layer, and exfoliated PMMA/graphene from the copper foil. The graphene layer needed to be thoroughly cleansed by floating on the surface of deionized water for three times before it was placed onto the gold pads on the flexible substrate. Four-step cleaning procedure for photoresist removal Graphene electrode impedance and susceptibility toward light-induced artifacts are highly dependent on photoresist residue. Therefore, we developed a four-step stripping/cleaning protocol to remove organic residues from the graphene surface that was crucial to achieve arrays with low impedance at high yield. After oxygen plasma etching, the sample was soaked in AZ 1-Methyl-2-pyrrolidon and Remover PG to remove AZ1512 and PMGI, respectively. Another acetone bath was used to remove Remover PG residue. All three rinses were conducted at room temperature with gentle agitation. The last cleaning step included ten cycles of isopropanol/deionized water rinse. Graphene microelectrode array fabrication Using the new graphene transfer and photoresist removal methods, we developed the following fabrication process (see also Fig. 1b ). Fifty-micrometer-thick clear PET (Mylar 48-02F-OC, elastic modulus: 4.9–5.1 GPa) is used as substrate for its high optical transmittance. To provide mechanical support during fabrication, 20 µm-thick PDMS was spin-coated on a 4-inch silicon wafer, and PET film was placed on the PDMS adhesive layer. Ten nanometer of chromium and 100 nm gold were deposited onto the PET film with a Denton Discovery 18 Sputter System. Metal wires were patterned with photolithography and wet-etching. Graphene was then transferred onto the designed area as described above. The device was dried completely at room temperature first and baked at 125 ˚C for 5 min to enhance bonding between graphene and PET substrate. The PMMA scaffold was removed in a room-temperature acetone bath for 20 min, following by 10 cycles of isopropanol/deionized water rinse. Graphene contact pads were patterned with PMGI/AZ1512 bilayer photolithography and oxygen plasma etching (Plasma Etch PE100), followed by the four-step cleaning method as described above. Finally, an 8 µm-thick SU-8 2005 encapsulation layer with openings only at active electrode areas was patterned with photolithography, followed by 10 cycles of isopropanol/deionized water rinse to cleanse SU-8 residue.
Show full methods section
Graphene transfer The bubbling transfer method 9 was adopted to protect graphene from cracking during the process. Therefore, 300 nm-thick 495 PMMA A4 was spin-coated on the graphene/copper bilayer structure. This PMMA/graphene/copper tri-layer was then connected to the cathode of a 20 V DC power supply, whereas the anode was submerged in 0.05 M NaOH in deionized water. As the trilayer was gently and gradually immersed into the NaOH solution, hydrogen gas bubbles formed in between the graphene and copper layer, and exfoliated PMMA/graphene from the copper foil. The graphene layer needed to be thoroughly cleansed by floating on the surface of deionized water for three times before it was placed onto the gold pads on the flexible substrate. Four-step cleaning procedure for photoresist removal Graphene electrode impedance and susceptibility toward light-induced artifacts are highly dependent on photoresist residue. Therefore, we developed a four-step stripping/cleaning protocol to remove organic residues from the graphene surface that was crucial to achieve arrays with low impedance at high yield. After oxygen plasma etching, the sample was soaked in AZ 1-Methyl-2-pyrrolidon and Remover PG to remove AZ1512 and PMGI, respectively. Another acetone bath was used to remove Remover PG residue. All three rinses were conducted at room temperature with gentle agitation. The last cleaning step included ten cycles of isopropanol/deionized water rinse. Graphene microelectrode array fabrication Using the new graphene transfer and photoresist removal methods, we developed the following fabrication process (see also Fig. 1b ). Fifty-micrometer-thick clear PET (Mylar 48-02F-OC, elastic modulus: 4.9–5.1 GPa) is used as substrate for its high optical transmittance. To provide mechanical support during fabrication, 20 µm-thick PDMS was spin-coated on a 4-inch silicon wafer, and PET film was placed on the PDMS adhesive layer. Ten nanometer of chromium and 100 nm gold were deposited onto the PET film with a Denton Discovery 18 Sputter System. Metal wires were patterned with photolithography and wet-etching. Graphene was then transferred onto the designed area as described above. The device was dried completely at room temperature first and baked at 125 ˚C for 5 min to enhance bonding between graphene and PET substrate. The PMMA scaffold was removed in a room-temperature acetone bath for 20 min, following by 10 cycles of isopropanol/deionized water rinse. Graphene contact pads were patterned with PMGI/AZ1512 bilayer photolithography and oxygen plasma etching (Plasma Etch PE100), followed by the four-step cleaning method as described above. Finally, an 8 µm-thick SU-8 2005 encapsulation layer with openings only at active electrode areas was patterned with photolithography, followed by 10 cycles of isopropanol/deionized water rinse to cleanse SU-8 residue.
Animal procedures
All experimental procedures were performed in accordance with the guidelines established by the UCSD Institutional Animal Care and Use Committee. We used 9 adult mice of either sex including three Thy1-ChR2-YFP (Jackson Stock Number 007612; heterozygous on a mixed C57Bl6/ICR background), two GAD67-GFP 10 , and six wild-type ICR mice.
Surgical procedures in mice expressing
ChR2 were performed in a dark room using a 515 nm long-pass filter (Semrock) in the surgical microscope light source to avoid OG photostimulation during installation of the cortical window. Mice were anesthetized with isoflurane during surgical procedures (5% initially, 1–1.5% during all procedures). A catheter was inserted into the femoral artery. A metal holding bar was glued to the temporal bone for immobilization of the head during imaging. A ~ 4 × 4 mm cranial window was centered on the whisker area of primary somatosensory cortex; overlying skull contralateral to the holding bar was exposed and dura mater removed. In calcium imaging experiments, 50 μg calcium indicator Oregon Green 488 BAPTA-1 AM ester (OGB1; O-6807, Thermo Fisher) was first dissolved in 4 μl of 20% Pluronic F-127 in dimethyl sulfoxide (P3000MP, Thermo Fisher); 80 μl of ACSF were added to the OGB1 solution to yield a final concentration of 0.5 mM OGB1. OGB1 solution was pressure-microinjected into the cortical tissue 13 within the whisker area of the somatosensory cortex. SR101 (S7635, Sigma) in ACSF was applied topically for ~ 2 min to label astrocytes 12 , providing a contrast in tissue that was used for visual assessment of potential damage due to experimental procedures. Excess dye was washed away with ACSF. The graphene array was placed on the cortical surface, a drop of 0.7% (w/v) agarose (A9793, Sigma) in ACSF was applied on top of the array, and the exposure was covered with a rectangular glass coverslip and sealed with dental acrylic. To avoid herniation of the exposed brain due to excessive intracranial pressure, the dura mater over the IVth cerebral ventricle was punctured, thus allowing drainage of CSF. After the exposure was closed, the drainage hole was sealed with agarose. After closing the exposure, mice were left to rest under 1% isoflurane for 45 min, which minimized leakage of drugs onto the exposed cortical tissue through cut dural blood vessels. Then, isoflurane was discontinued and anesthesia was maintained with α-chloralose (50 mg kg –1 h – 1 , C0128, Sigma or 100459, MP Biochemicals). Mice were paralyzed with pancuronium bromide (0.4 mg kg – 1 h – 1 , P1918, Sigma) 48 , and ventilated (~ 110 min −1 ) with 100% O 2 . α-chloralose, pancuronium bromide, or 5% dextrose in saline were supplied through the femoral line every 30 min for the duration of data acquisition. Expired CO 2 was measured continuously using a micro-capnometer (Cl240, Columbus Instruments). Heart rate, blood pressure, and body temperature were monitored continuously. Blood gas was analyzed to cross-validate micro-capnometer measurements. Respiration was adjusted to achieve a PaCO 2 between 30 and 40 mm Hg and pH between 7.35 and 7.45. For vascular imaging experiments, 2 MDa dextran-conjugated FITC (FD-2000S, Sigma) or 2 MDa dextran-conjugated Alexa Fluor 680 were injected through the femoral line (50–100 μl of 5% (w/v) solution in PBS). To prepare 2 MDa Alexa Fluor 680-dextran, Alexa Fluor 680 NHS ester (A20008, Thermo-Fisher) was conjugated to 2 MDa amino dextran (AD2000x150, Finabio) using a custom conjugation protocol that can be found on the Devor lab academic website http://nil.ucsd.edu/ under “Resources”.
Two-photon imaging
Images were obtained using an Ultima 2-photon laser scanning microscopy system from Bruker Fluorescence Microscopy (formerly Prairie Technologies) equipped with an Ultra II femtosecond Ti:Sapphire laser (Coherent) tuned to 905 nm for imaging of EGFP and 950 nm for imaging of FITC. For penetration deeper than ~ 600 μm, an optical parametric oscillator (Chameleon Compact OPO, Coherent) pumped by the same Ti:Sapphire laser was tuned to 1280 nm. The OPO was used in conjunction with intravascular administration Alexa Fluor 680-dextran 11 . FITC, EGFP, and Alexa Fluor 680 were imaged using cooled GaAsP PMT tube detectors (H7422P-40, Hamamatsu). SR101 was imaged using a multialkali PMT (R3896, Hamamatsu). In experiments involving OG stimulation, the main dichroic mirror contained a 460–480 nm notch (Chroma ZT470/561/NIR TPC). An additional filter that blocks wavelengths in between 458 and 473 nm (Chroma ZET458-473/561/568/NIR M) was added in front of the PMT block. Nevertheless, residual bleed-through of the 473 nm light prevented us from using GaAsP PMT detectors. Therefore, in these experiments, FITC was imaged using a multialkali PMT. For imaging Alexa Fluor 680-dextran, custom-made filters (Chroma) were used; the main dichroic mirror contained a 440–480 nm notch and allowed light transmission from 780 to 1400 nm, the corresponding filter in front of the PMT blocks light between 440 and 480 nm, and above 750 nm. We used 4× (Olympus XLFluor4x/340, numerical aperture (NA) = 0.28) or 5× (Zeiss Plan-NEOFLUAR, NA = 0.16) objectives to obtain low-resolution images of the exposure. Olympus 20× (XLUMPlanFLNXW, NA = 1.0 and UMPlanFI, NA = 0.5) water-immersion objectives were used for high-resolution imaging. The laser beam diameter was adjusted to overfill the back aperture. Arteriolar diameter measurements were performed in a “free-hand” line-scan mode with a scan rate of 25–50 Hz. The scan resolution was 0.5 μm or less. Calcium imaging was performed in frame-scan mode at ~ 10 Hz per frame.
Sensory stimulation
Electrical stimulation was delivered to the whisker pad contralateral to the cortical exposure through a pair of thin needles inserted under the skin using 300 µs, 1 mA electrical pulses. For calcium imaging, 50 trials with 5 s interstimulus interval (ISI) were delivered at each measurement location. For mesoscopic imaging of cortical hemodynamics, a train of six electrical pulses (300 µs, 1 mA) were delivered at a rate of 3 Hz with an ISI of 30 s. The stimulation device (A365 stimulus isolator, WPI) was triggered using a separate PC that also acquired timing signals for data acquisition (“trigger out” signals for each frame/line) and physiological readings using a National Instruments IO DAQ interface (PCI-6229) controlled by custom-written software in MATLAB (MathWorks, Inc.). The timing of electrophysiological acquisition as well as each optical frame/line relative to the stimulus onset was determined during data analysis based on acquired triggering signals. OG stimulation In 2-photon experiments, OG stimulation was delivered though the objective using a 473 nm cylinder-shaped CW laser beam ~ 210 μm in diameter (FWHM) 16 . The beam was directed to defined locations in the sample using a dedicated set of galvanometer mirrors. The duration of the light pulse was controlled by a dedicated shutter and synchronized with imaging. Laser power was measured by directing the entire beam into the sensor of a broadband power meter (13PEM-001, Melles-Griot). The beam diameter was measured with a CCD-based laser beam profiler (LBP-2, Newport).
Recording and analysis of electrophysiological data
The electrophysiological data were recorded by the RHD2000 amplifier board and the RHD2000 evaluation system from Intan Technologies. The sampling rate was 10 kHz. The DC offset was removed by the built-in filters of the system. Data were analyzed in MATLAB using custom-written software. After import and conversion into MATLAB files, trigger signals were detected, artifacts from electrical stimulation were removed by linear interpolation, if necessary, and the sampling rate was reduced to 1 kHz for trial average and further processing. For normalization, data recorded 50 ms before stimulus delivery were averaged and used as baseline value.
Analysis of imaging data
Data were analyzed in MATLAB using custom-written software as described in 16 , 37 , 40 . For analysis of calcium imaging data, neuronal cell bodies were segmented from composite red (SR101) and green (OGB1) images. For individual regions of interest (ROIs), the calcium signal per frame was calculated as average OGB1 fluorescence of all pixels within the ROI. This calculation was repeated for each frame in the time series to generate a single-ROI time-course. All pixels outside astrocytic and vascular ROIs and neuronal cell bodies were specified as neuropil. Vessel diameters were measured using continuous line scans across the vessel that form a space-time image when stacked sequentially. Diameters are extracted from profile changes resulting from expansion or contraction of the intravascular lumen, which is labeled with FITC- or Alexa Fluor 680-dextran. Spectral imaging of blood oxygenation Spectral imaging of blood oxygenation was performed as previously described in 49 . Briefly, six different bandpass filters were placed on a six-position filter wheel (Thorlabs), which was mounted on a DC motor. The center wavelength of the filters ranged from 560 to 610 nm with 10 nm intervals. Light from a tungsten-halogen light source (Oriel, Spectra-Physics) was directed through the filter wheel, which was coupled to a 12 mm fiber bundle. Images were acquired with a cooled 16 bit CCD camera (Cascade 512B, Photometrics). Image acquisition was triggered at ~ 18 Hz by individual filters in the filter wheel passing through an optic sensor. The image set at each wavelength was averaged across trials and averaged data was converted to changes in HbO and Hb at each pixel using the modified Beer Lambert relationship as detailed in ref. 49 . Baseline concentrations of 60 and 40 μM were assumed for HbO and Hb, respectively 50 , 51 .
Two-photon imaging of fluorescent polystyrene beads
The graphene microarray device was fixed at its connecting wire to a 22 × 22 mm glass coverslip with UV-curable optical adhesive (Norland 61). Four 3 mm coverslips serving as spacers were fixed at each corner of the coverslip. One micrometer fluorescent polystyrene beads (Fluoresbrite YG Microspheres, Polysciences, 18860) were diluted to a final dilution of 1:10,000 in ProLong Gold mounting medium (Thermo Fisher, refractive index: 1.47 after curing). A drop of bead-containing mounting medium was added onto a glass slide and the coverslip with array was placed on top. Two-photon imaging was performed after curing of the mounting medium at an excitation wavelength of 800 nm using a 20× UMPlanFI (NA = 0.5) water-immersion objective. Data were analyzed in ImageJ using the MetroloJ plugin 52 .
Statistics
Improved array performance in vitro has been shown in four independent manufacturing processes with three arrays in each batch. Animal experiments were designed as proof-of-principle experiments to demonstrate graphene microarray performance in vivo; statistical comparison of experimental groups is therefore not applicable. Structural imaging in GAD67-GFP was performed in two independent experiments; calcium imaging with OGB was performed in four independent experiments; experiments involving OG stimulation were performed in three Thy1-ChR2 animals and one wild-type animal; and macroscopic hemodynamic imaging was performed in one animal.
Data availability
The data that support the findings of this study are available from the corresponding authors upon reasonable request.
Four-step cleaning procedure for photoresist removal Graphene electrode impedance and susceptibility toward light-induced artifacts are highly dependent on photoresist residue. Therefore, we developed a four-step stripping/cleaning protocol to remove organic residues from the graphene surface that was crucial to achieve arrays with low impedance at high yield. After oxygen plasma etching, the sample was soaked in AZ 1-Methyl-2-pyrrolidon and Remover PG to remove AZ1512 and PMGI, respectively. Another acetone bath was used to remove Remover PG residue. All three rinses were conducted at room temperature with gentle agitation. The last cleaning step included ten cycles of isopropanol/deionized water rinse.
Animal procedures
All experimental procedures were performed in accordance with the guidelines established by the UCSD Institutional Animal Care and Use Committee. We used 9 adult mice of either sex including three Thy1-ChR2-YFP (Jackson Stock Number 007612; heterozygous on a mixed C57Bl6/ICR background), two GAD67-GFP 10 , and six wild-type ICR mice.
Surgical procedures in mice expressing
ChR2 were performed in a dark room using a 515 nm long-pass filter (Semrock) in the surgical microscope light source to avoid OG photostimulation during installation of the cortical window. Mice were anesthetized with isoflurane during surgical procedures (5% initially, 1–1.5% during all procedures). A catheter was inserted into the femoral artery. A metal holding bar was glued to the temporal bone for immobilization of the head during imaging. A ~ 4 × 4 mm cranial window was centered on the whisker area of primary somatosensory cortex; overlying skull contralateral to the holding bar was exposed and dura mater removed. In calcium imaging experiments, 50 μg calcium indicator Oregon Green 488 BAPTA-1 AM ester (OGB1; O-6807, Thermo Fisher) was first dissolved in 4 μl of 20% Pluronic F-127 in dimethyl sulfoxide (P3000MP, Thermo Fisher); 80 μl of ACSF were added to the OGB1 solution to yield a final concentration of 0.5 mM OGB1. OGB1 solution was pressure-microinjected into the cortical tissue 13 within the whisker area of the somatosensory cortex. SR101 (S7635, Sigma) in ACSF was applied topically for ~ 2 min to label astrocytes 12 , providing a contrast in tissue that was used for visual assessment of potential damage due to experimental procedures. Excess dye was washed away with ACSF. The graphene array was placed on the cortical surface, a drop of 0.7% (w/v) agarose (A9793, Sigma) in ACSF was applied on top of the array, and the exposure was covered with a rectangular glass coverslip and sealed with dental acrylic. To avoid herniation of the exposed brain due to excessive intracranial pressure, the dura mater over the IVth cerebral ventricle was punctured, thus allowing drainage of CSF. After the exposure was closed, the drainage hole was sealed with agarose. After closing the exposure, mice were left to rest under 1% isoflurane for 45 min, which minimized leakage of drugs onto the exposed cortical tissue through cut dural blood vessels. Then, isoflurane was discontinued and anesthesia was maintained with α-chloralose (50 mg kg –1 h – 1 , C0128, Sigma or 100459, MP Biochemicals). Mice were paralyzed with pancuronium bromide (0.4 mg kg – 1 h – 1 , P1918, Sigma) 48 , and ventilated (~ 110 min −1 ) with 100% O 2 . α-chloralose, pancuronium bromide, or 5% dextrose in saline were supplied through the femoral line every 30 min for the duration of data acquisition. Expired CO 2 was measured continuously using a micro-capnometer (Cl240, Columbus Instruments). Heart rate, blood pressure, and body temperature were monitored continuously. Blood gas was analyzed to cross-validate micro-capnometer measurements. Respiration was adjusted to achieve a PaCO 2 between 30 and 40 mm Hg and pH between 7.35 and 7.45. For vascular imaging experiments, 2 MDa dextran-conjugated FITC (FD-2000S, Sigma) or 2 MDa dextran-conjugated Alexa Fluor 680 were injected through the femoral line (50–100 μl of 5% (w/v) solution in PBS). To prepare 2 MDa Alexa Fluor 680-dextran, Alexa Fluor 680 NHS ester (A20008, Thermo-Fisher) was conjugated to 2 MDa amino dextran (AD2000x150, Finabio) using a custom conjugation protocol that can be found on the Devor lab academic website http://nil.ucsd.edu/ under “Resources”.
Electronic supplementary material Supplementary Information Description of Additional Supplementary Files Supplementary Movie 1 Supplementary Movie 2 Supplementary Movie 3
📊 Figures
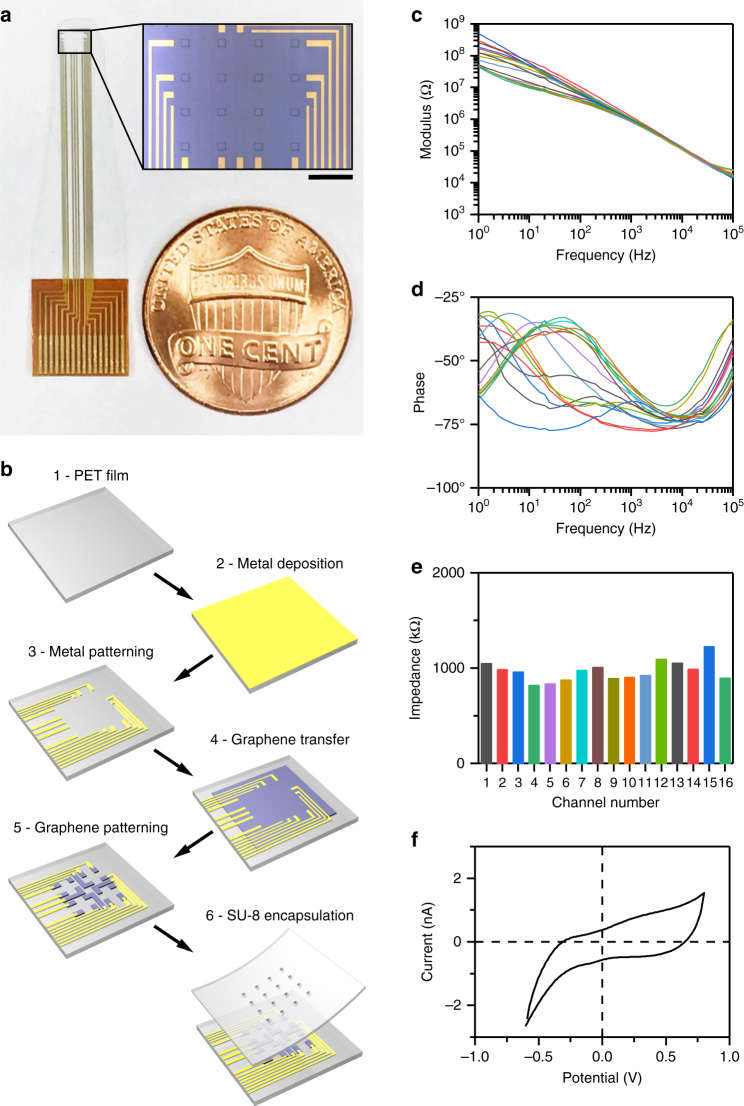
Fig. 1
Graphene microelectrode array fabrication and electrochemical characterization. a Design of the graphene microelectrode array. Each electrode is a 100u2009u00b5mu00d7100u2009u00b5m square and the spac...
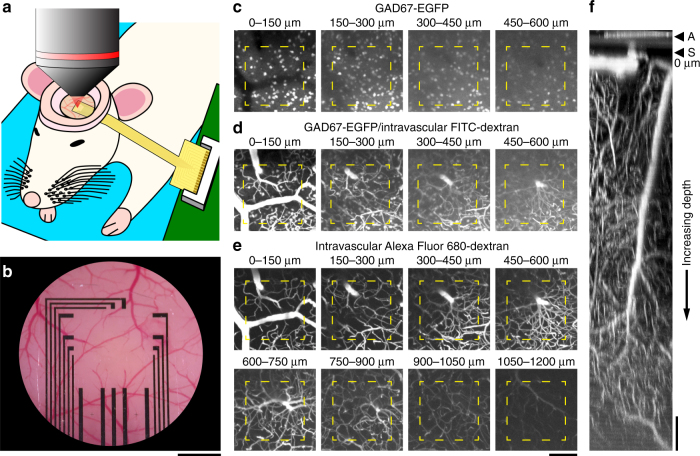
Fig. 2
Structural 2-photon imaging through a graphene microelectrode array. a After placement of head-post (not shown), craniotomy, and dura removal, the graphene microelectrode array is placed on the surfac...
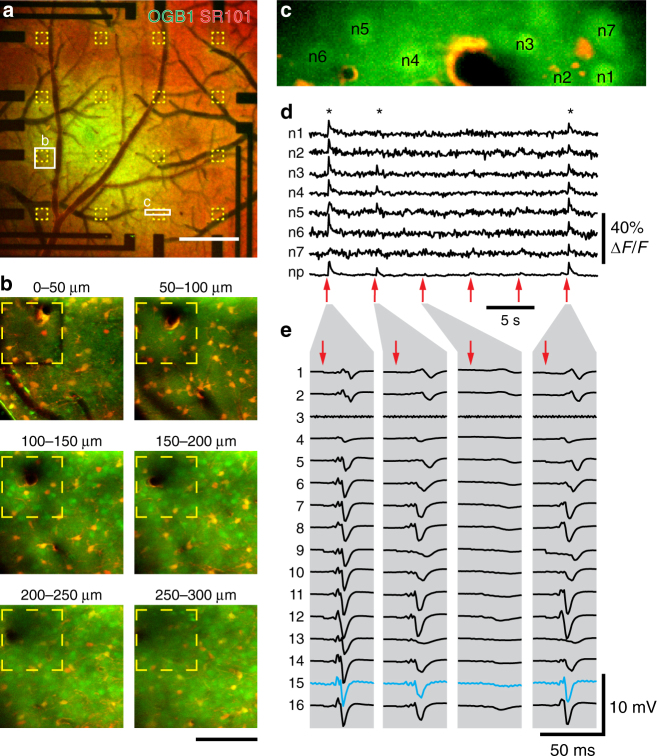
Fig. 3
Combination of 2-photon-based calcium imaging with electrical recordings. Before placement of the graphene microelectrode array, the calcium indicator Oregon Green 488 BAPTA-1 (OGB1) AM ester was pres...
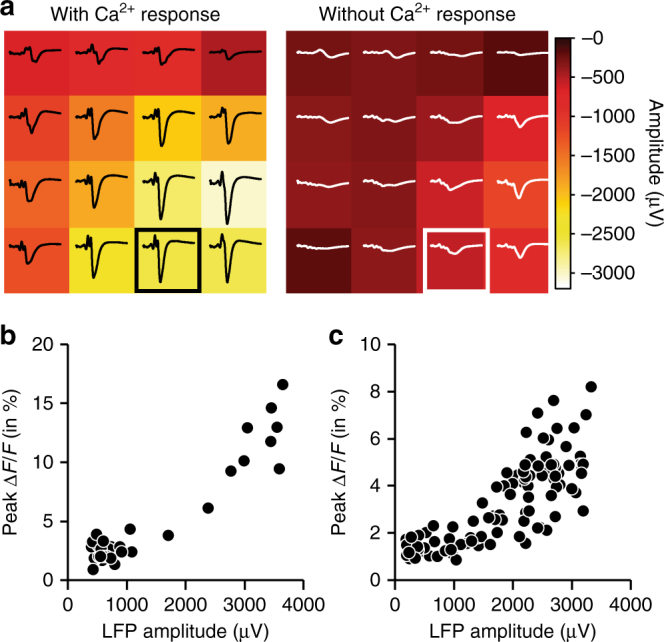
Fig. 4
Relationship between local field potential (LFP) and Ca 2+ transients. a Comparison of LFP amplitudes across the array in trials where Ca 2+ transients were observed (left; 10 trials) or not observed ...
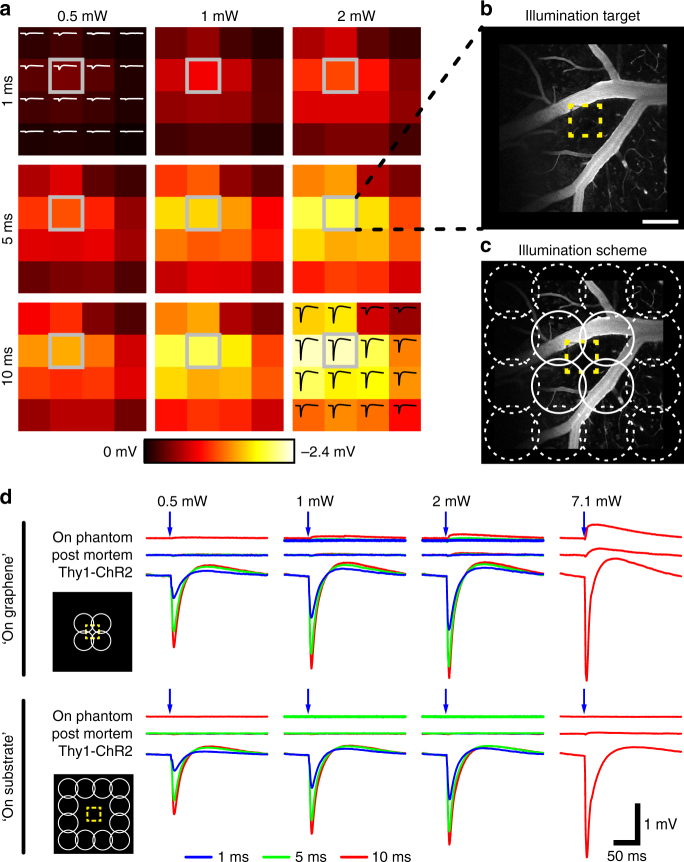
Fig. 5
Measurement of optogenetic photostimulation-induced electrical potentials in Thy1-ChR2 mice that express channelrhodopsin-2 (ChR2) in layer-V pyramidal neurons. a A 473u2009nm laser beam (diameter: 21...
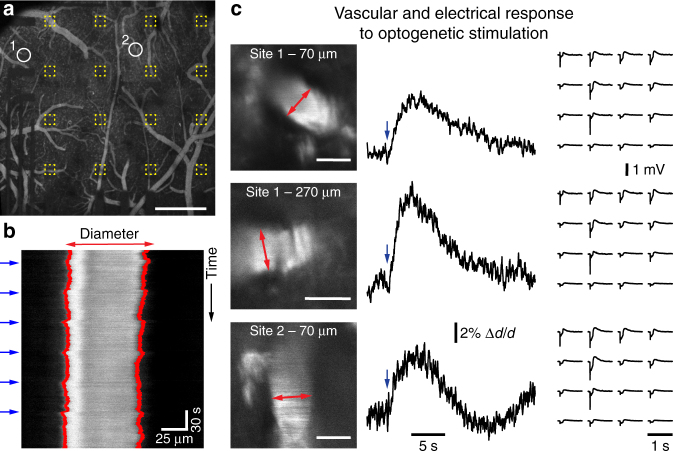
Fig. 6
Measurement of vascular responses to optogenetic (OG) photostimulation below graphene microelectrode arrays in Thy1-ChR2 mice. a Location of diving arterioles for diameter measurements with 2-photon i...
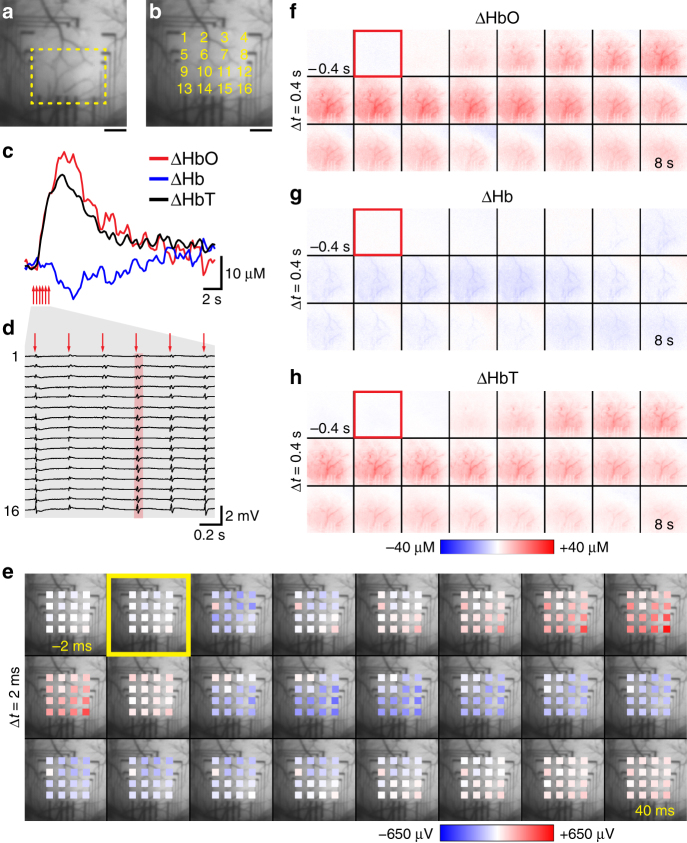
Fig. 7
Combination of macroscopic hemodynamic optical imaging with electrical recordings. Light absorption at six wavelength ranges (560u2013610u2009nm, 10u2009nm step size) was recorded with a CCD camera at...
Figure images are served from the NIH/NLM PubMed Central Open Access Subset or Europe PMC; copyright remains with the publishers and authors.
💬 Discussion
0 commentsNo comments yet. Be the first to start a discussion!
Leave a Comment