Abstract
Microtubule post-translational modifications impart functional diversity to microtubules by affecting their dynamics, organization, and interaction with proteins. Using super-resolution microscopy, we show that only a small subpopulation of microtubules are detyrosinated in epithelial cells, while acetylated and tyrosinated microtubules comprise the majority of all microtubules. Surprisingly, lysosomes are enriched by approximately threefold on detyrosinated microtubules. Further, their motility on detyrosinated microtubules is impaired, showing shorter runs and more frequent and longer pauses. Lysosome enrichment is mediated through a kinesin-1-dependent mechanism, since knocking down this motor abolishes enrichment. Finally, correlative live-cell and super-resolution microscopy showed that lysosomes interact with autophagosomes on detyrosinated microtubules. Removal of detyrosinated microtubules or knockdown of kinesin-1 leads to a decrease in the percentage of autolysosomes, a fusion intermediate of autophagosomes and lysosomes. Taken together, our data reveal a new role of detyrosinated microtubules as hubs that spatially concentrate lysosomes on a small subset of microtubules and facilitate their interaction and fusion with autophagosomes to initiate autophagy.
🔬 Techniques
🧬 Organisms
✨ Fluorophores
🧪 Sample Preparation
🔬 Cell Lines
🏭 Microscope Brands
🧪 Reagent Suppliers
📷 Detectors
🔎 Objectives
🎨 Filters
💻 Software Details
🏛️ Research Organizations (ROR)
Affiliated research institutions:
📋 Methods
Cell culture and treatments
A stable cell line for GFP-tubulin and mCherry-tubulin was derived from African green monkey ( Cercopithecus aethiops ) kidney epithelial cells (BS-C-1; CCL-26; American Type Culture Collection).
Cell culture consisted of complete growth medium
(Eagle’s minimum essential medium with Earle’s salts and nonessential amino acids, plus 10% [vol/vol] FBS, 2 mM L-glutamine, 1 mM sodium pyruvate, 500 µg/ml Geneticin [G418 Sulfate; Thermo Fisher Scientific], and penicillin-streptomycin) at 37°C and 5% carbon dioxide. A double stably transfected cell line for GFP-tubulin and LAMP2-mCherry (Lgp120NL-mCherry) was derived from the BS-C-1 GFP-tubulin cell line following pHyg-LGP120NL-mCherry plasmid transfection and clone selection. Cell culture medium included an additional 100 µg/ml Hygromycin B (10687010; Invitrogen). A double stably transfected cell line for GFP-tubulin and LC3B-mCherry (mCherry-hLC3B-pcDNA3.1) was derived from the BS-C-1 GFP-tubulin cell line following pHyg-hLC3B-mCherry plasmid transfection and clone selection. Cell culture medium included an additional 100 µg/ml Hygromycin B (10687010; Invitrogen). mCherry-hLC3B-pcDNA3.1 was a gift from D. Rubinsztein, Cambridge Institute for Medical Research, Cambridge, UK ( Jahreiss et al., 2008 ; plasmid 40827; Addgene). BS-C-1 wild-type or stable cell lines for mCherry tubulin derived from BS-C-1 were transiently transfected with plasmid ptfLC3, a gift from T. Yoshimori, Osaka University, Osaka, Japan ( Kimura et al., 2007 ; plasmid 21074; Addgene). Cells were plated on fiduciary markers (Carboxyl Fluorescent Yellow microspheres 260 nm or Carboxyl Fluorescent Nile Red microspheres 240 nm; Spherotech) and fibronectin (20 µg/ml)–coated eight-well Lab-Tek 1 coverglass chambers (Nunc). Cell culture media and additives were purchased from Gibco (Life Technologies). A complete list of siRNAs used to knock down motor proteins in this work is shown in Table S1. Drug treatments and starvation Cells were treated with 10 µM nocodazole (Sigma-Aldrich) in complete growth medium for 2 h at 37°C, to depolymerize the microtubules completely, and subsequently recovered with 10 µM parthenolide (Sigma-Aldrich) in complete growth medium for 16 h at 37°C, to suppress the formation of detyrosinated microtubules in the recovered cells. Cells transfected with ptfLC3 were incubated with Hanks’ Balanced Salt Solution (Life Technologies) for 2 h at 37°C to induce a starvation condition and generate additional pure autophagosomes. Immunostaining Cells were fixed and immunostained as described in Bálint et al. (2013) . Briefly, fixation was done with 3% (vol/vol) paraformaldehyde and 0.1% glutaraldehyde in PBS. A 0.1% NaBH 4 solution in PBS was used to quench background fluorescence. Cells were blocked with 3% (wt/vol) BSA and 0.2% Triton X-100 (vol/vol; Thermo Fisher Scientific) in PBS and incubated with the appropriate dilution of primary and secondary antibodies in the same blocking buffer. Cells were rinsed with washing buffer (0.2% BSA and 0.05% Triton X-100; Thermo Fisher Scientific) between antibody incubations. A complete list of antibodies used in this work is provided in Table S2. The secondary antibodies used were AffiniPure donkey anti-rabbit IgG (H+L, 711-005-152; Jackson ImmunoResearch) at a dilution of 1:100, AffiniPure donkey anti-rat IgG (H+L, 712-005-150; Jackson ImmunoResearch) at a dilution of 1:100, and AffiniPure donkey anti-chicken IgY (IgG; H+L, 703-005-155; Jackson ImmunoResearch,) at a dilution of 1:100. For stochastic optical reconstruction microscopy (STORM), the secondary antibodies were labeled with an Alexa Fluor 405–Alexa Fluor A647 or Alexa Fluor 405–Cyb activator/reporter dye pair combination at concentrations of 0.12–0.15 mg/ml ( Bates et al., 2007 ).
Show full methods section
Cell culture and treatments
A stable cell line for GFP-tubulin and mCherry-tubulin was derived from African green monkey ( Cercopithecus aethiops ) kidney epithelial cells (BS-C-1; CCL-26; American Type Culture Collection).
Cell culture consisted of complete growth medium
(Eagle’s minimum essential medium with Earle’s salts and nonessential amino acids, plus 10% [vol/vol] FBS, 2 mM L-glutamine, 1 mM sodium pyruvate, 500 µg/ml Geneticin [G418 Sulfate; Thermo Fisher Scientific], and penicillin-streptomycin) at 37°C and 5% carbon dioxide. A double stably transfected cell line for GFP-tubulin and LAMP2-mCherry (Lgp120NL-mCherry) was derived from the BS-C-1 GFP-tubulin cell line following pHyg-LGP120NL-mCherry plasmid transfection and clone selection. Cell culture medium included an additional 100 µg/ml Hygromycin B (10687010; Invitrogen). A double stably transfected cell line for GFP-tubulin and LC3B-mCherry (mCherry-hLC3B-pcDNA3.1) was derived from the BS-C-1 GFP-tubulin cell line following pHyg-hLC3B-mCherry plasmid transfection and clone selection. Cell culture medium included an additional 100 µg/ml Hygromycin B (10687010; Invitrogen). mCherry-hLC3B-pcDNA3.1 was a gift from D. Rubinsztein, Cambridge Institute for Medical Research, Cambridge, UK ( Jahreiss et al., 2008 ; plasmid 40827; Addgene). BS-C-1 wild-type or stable cell lines for mCherry tubulin derived from BS-C-1 were transiently transfected with plasmid ptfLC3, a gift from T. Yoshimori, Osaka University, Osaka, Japan ( Kimura et al., 2007 ; plasmid 21074; Addgene). Cells were plated on fiduciary markers (Carboxyl Fluorescent Yellow microspheres 260 nm or Carboxyl Fluorescent Nile Red microspheres 240 nm; Spherotech) and fibronectin (20 µg/ml)–coated eight-well Lab-Tek 1 coverglass chambers (Nunc). Cell culture media and additives were purchased from Gibco (Life Technologies). A complete list of siRNAs used to knock down motor proteins in this work is shown in Table S1. Drug treatments and starvation Cells were treated with 10 µM nocodazole (Sigma-Aldrich) in complete growth medium for 2 h at 37°C, to depolymerize the microtubules completely, and subsequently recovered with 10 µM parthenolide (Sigma-Aldrich) in complete growth medium for 16 h at 37°C, to suppress the formation of detyrosinated microtubules in the recovered cells. Cells transfected with ptfLC3 were incubated with Hanks’ Balanced Salt Solution (Life Technologies) for 2 h at 37°C to induce a starvation condition and generate additional pure autophagosomes. Immunostaining Cells were fixed and immunostained as described in Bálint et al. (2013) . Briefly, fixation was done with 3% (vol/vol) paraformaldehyde and 0.1% glutaraldehyde in PBS. A 0.1% NaBH 4 solution in PBS was used to quench background fluorescence. Cells were blocked with 3% (wt/vol) BSA and 0.2% Triton X-100 (vol/vol; Thermo Fisher Scientific) in PBS and incubated with the appropriate dilution of primary and secondary antibodies in the same blocking buffer. Cells were rinsed with washing buffer (0.2% BSA and 0.05% Triton X-100; Thermo Fisher Scientific) between antibody incubations. A complete list of antibodies used in this work is provided in Table S2. The secondary antibodies used were AffiniPure donkey anti-rabbit IgG (H+L, 711-005-152; Jackson ImmunoResearch) at a dilution of 1:100, AffiniPure donkey anti-rat IgG (H+L, 712-005-150; Jackson ImmunoResearch) at a dilution of 1:100, and AffiniPure donkey anti-chicken IgY (IgG; H+L, 703-005-155; Jackson ImmunoResearch,) at a dilution of 1:100. For stochastic optical reconstruction microscopy (STORM), the secondary antibodies were labeled with an Alexa Fluor 405–Alexa Fluor A647 or Alexa Fluor 405–Cyb activator/reporter dye pair combination at concentrations of 0.12–0.15 mg/ml ( Bates et al., 2007 ).
Live-cell imaging
Live-cell imaging was performed with a custom-built, wide-field fluorescence microscope as described before ( Bálint et al., 2013 ). Dual-color live-cell imaging was performed by using two laser sources: a 488-nm laser line for exciting GFP-tubulin or GFP-LC3B, and a 560-nm fiber laser for exciting mCherry-tubulin, cy3b, LAMP2-mCherry, or mCherry-LC3B. The emitted fluorescence was split by a quad band set ( TRF89902 -ET-405/488/561/647 Laser Quad Band Set for total internal reflection fluorescence applications; Chroma Technology) for the two-color tracking experiments or by two separate emission filters (ET525/50 and ET605/52; Chroma Technology) for the rest of the experiments. The exposure time in the dual-color live-cell imaging experiments was 100 ms.
STORM imaging
STORM was acquired with the same custom-built microscope or an Oxford Nanoimaging system. For the custom-built setup, laser light at 647 nm from an argon-krypton laser (Spectrum IC70; Coherent) was used for exciting Alexa Fluor 647 (Invitrogen), and a 405-nm solid-state laser (Cube; Coherent) was used for reactivating the Alexa Fluor 647 (Invitrogen) via an activator dye (Alexa Fluor 405). The emitted light from Alexa Fluor 647 (Invitrogen) was collected by the 100× objective, filtered by an emission filter (ET705/72m; Chroma), and imaged onto the EM-CCD camera at 20 ms per frame. For multi-color STORM, the emitted light from Alexa Fluor 647 and Cy3b was filtered by a quad band set ( TRF89902 -ET-405/488/561/647 Laser Quad Band Set for total internal reflection fluorescence applications; Chroma Technology). Some of the images were acquired on the Nanoimager-S microscope (Oxford Nanoimaging) with the following configuration: 405-, 488-, 561-, and 640-nm lasers, 498–551- and 576–620-nm band-pass filters in channel 1, and 665–705-nm band-pass filters in channel 2, 100× 1.4 NA objective (Olympus), and a Hamamatsu Flash 4 V3 sCMOS camera. Localization microscopy images were acquired with 16-ms exposure for 30,000 frames with 405-nm activation and then processed using the NimOS localization software (Oxford Nanoimaging).
Data analysis Image registration
Channel registration between the live-cell videos of lysosomes or autophagosomes (mCherry emission) excited by a 560-nm wavelength laser line, acquired using the quad band filter set and the multicolor super-resolution images of modified and unmodified microtubules (Cy3b emission and Alexa Fluor 647 emission), excited with two different alternating laser lines at wavelengths of 560 and 647 nm, and acquired with the same quad band filter set, was done as previously reported ( Verdeny-Vilanova et al., 2017 ). Briefly, to account for sample drift between the live-cell and the super-resolution imaging, we calculated a rigid shift in x , y , and z , using fiduciary markers on the glass surface of the samples and visible both in the live-cell video and the super-resolution image. The rigid shift was applied to the super-resolution raw localizations. The alignment precision (∼10 nm) was calculated as the root mean square difference in the aligned position of the fiduciary markers present in the sample in x , y , as previously described ( Verdeny-Vilanova et al., 2017 ).
Single-particle tracking
Lysosome and autophagosome positions were tracked by a semiautomated, custom-written, particle-tracking software. To determine the x and y positions, trajectories were analyzed by performing a 2D Gaussian fit to the object point spread function. Sample drift during acquisition was calculated by tracking the x , y , and z positions of the fiduciary markers adsorbed onto the glass surface and subsequently subtracted from the trajectories. A custom-written MATLAB script was used to determine active and passive phases from the 2D trajectory information, as previously described ( Verdeny-Vilanova et al., 2017 ). We performed a moving window analysis (four-point segments) along the trajectory data points. We then calculated the ratio between the total displacement between the initial and final points of the segment and the sum of displacements between the points within the segment. Because the segments overlap, each point within a trajectory will appear in multiple segments. Thus, for every data point, the ratios were averaged over all segments containing this specific point. This ratio estimates the linearity of each segment, and hence, values close to 1 correspond to active phases. A threshold ratio of 0.8 was chosen to distinguish between active and passive phases. Additionally, we used an angle criterion (successive displacement vectors showing angles less than 90° are categorized as passive) to further filter the initial categorization. The chosen parameters were optimized by visual inspection and comparison of a select number of trajectories ( n = 10) to a published method based on a Hidden Markov Model analysis ( Monnier et al., 2015 ). After this analysis, we considered the segments >12 data points and calculated the power-law exponent from the mean square displacement (MSD) to further confirm the previous categorization. The exponents were calculated by fitting the MSD curves to a power law: [ MS (Δ t )] = α × log (Δ t ) + C . Active transport was separated from passive transport based on α > 1.5. In all cases, the determined power-law exponent matched our initial categorization, confirming that this analysis was effective. Next, we considered the segments of trajectories of
📊 Figures
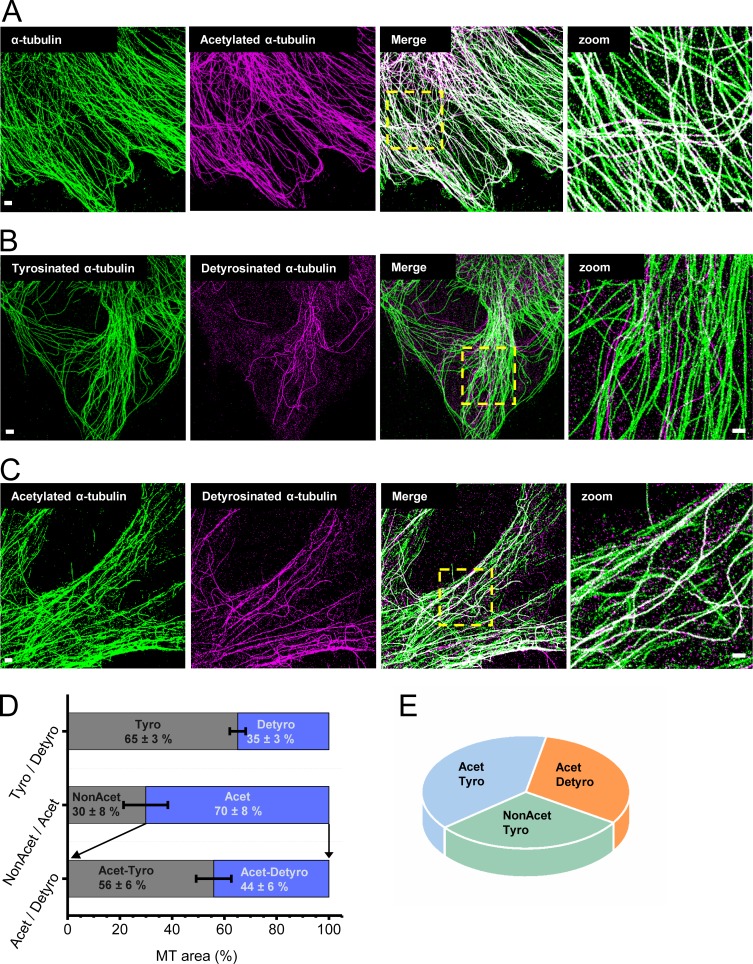
Figure 1.
Detyrosinated microtubules form a small subset of all microtubules. (Au2013C) Two-color super-resolution images of total u03b1-tubulin (green), acetylated u03b1-tubulin (magenta), and overlay (A); tyr...
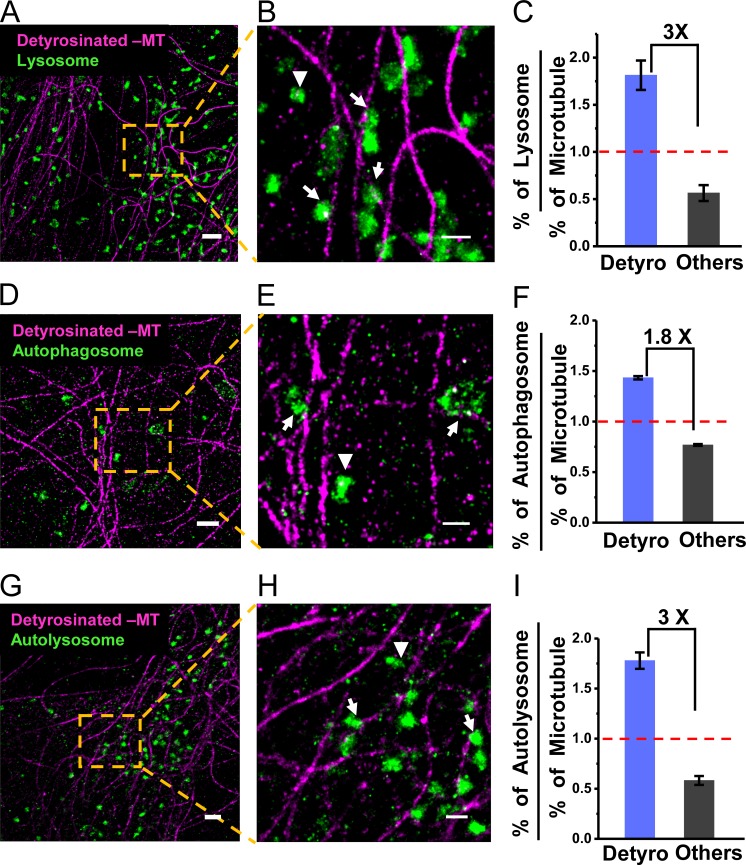
Figure 2.
Lysosomes, autophagosomes, and autolysosomes are enriched on detyrosinated microtubules. Two-color super-resolution images showing lysosomes (green; A and B), autophagosomes (green; D and E), and auto...
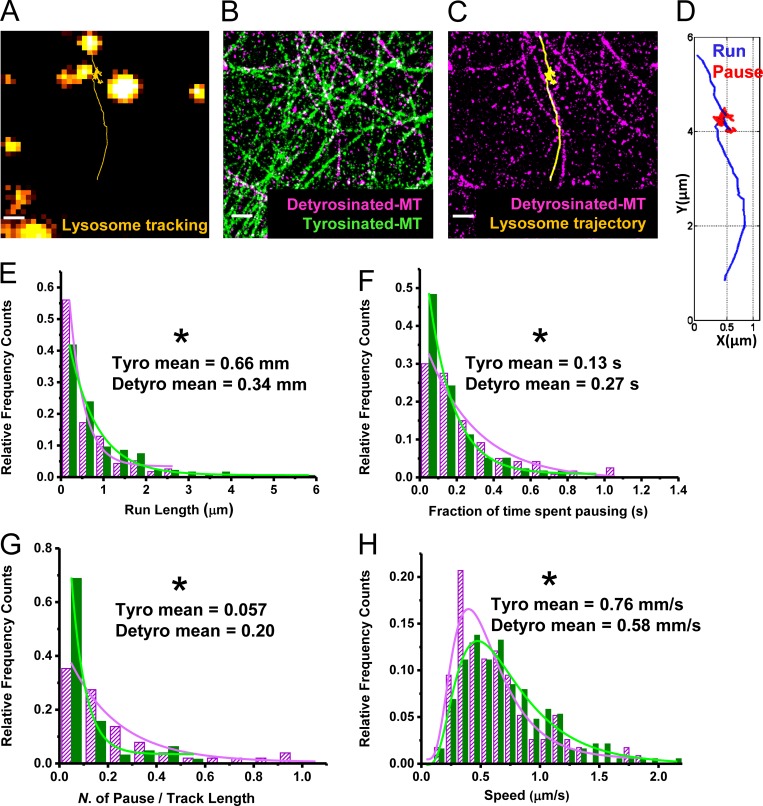
Figure 3.
Lysosomes show hindered motility on detyrosinated microtubules. (A) Trajectory (yellow) shows the motility of a lysosome (orange). (B) Super-resolution image of the same region showing detyrosinated u...
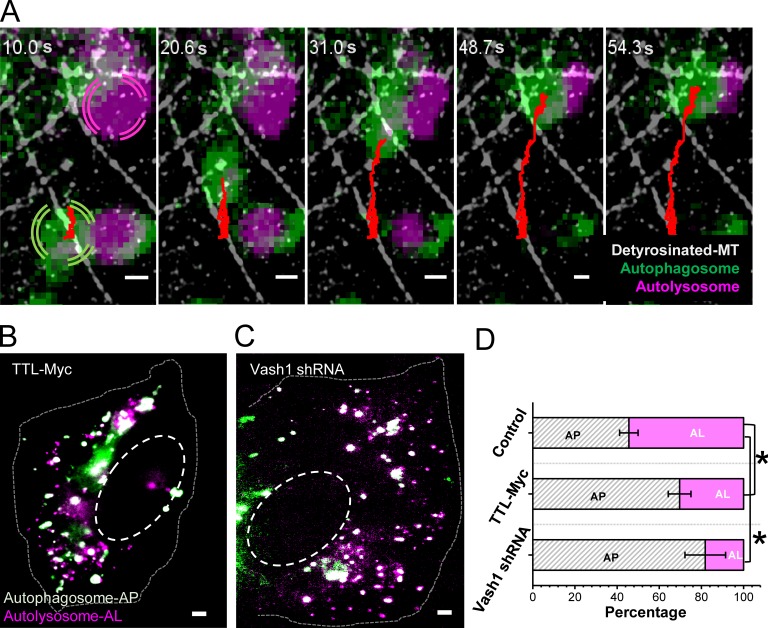
Figure 4.
Heterotypic interactions between autophagosomes and lysosomes happen on detyrosinated microtubules. (A) Snapshots from a time-lapse video where an autophagosome (green) moves toward and interacts with...
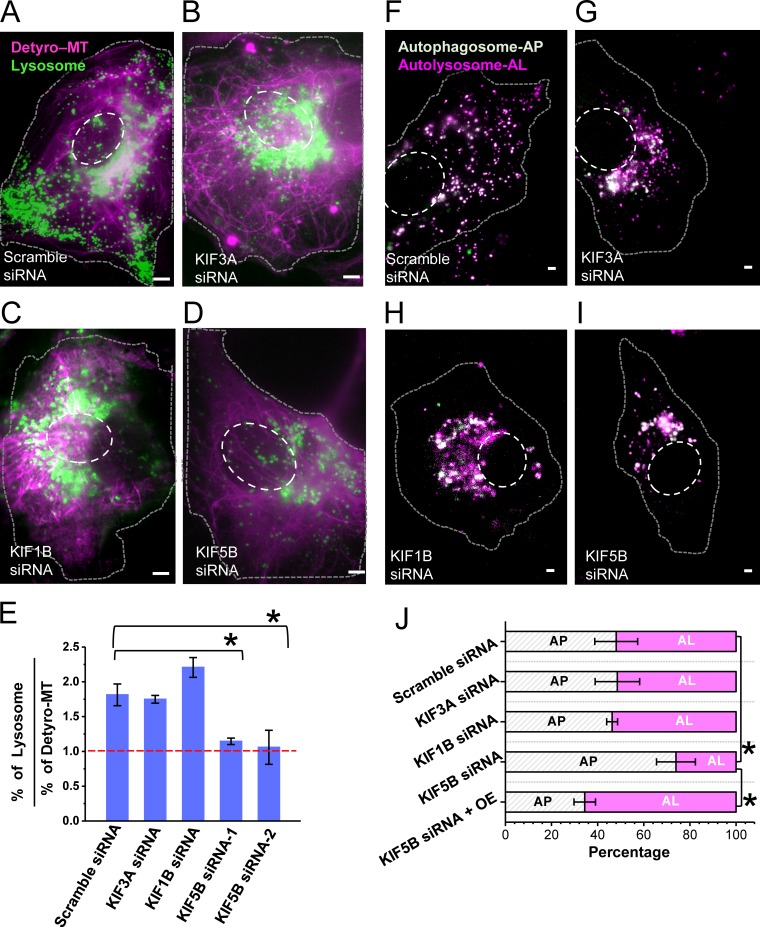
Figure 5.
KIF5B knockdown abolishes the enrichment of lysosomes on detyrosinated microtubules and impacts lysosomeu2013autophagosome fusion. (Au2013D) Conventional epifluorescence images of cells stably express...
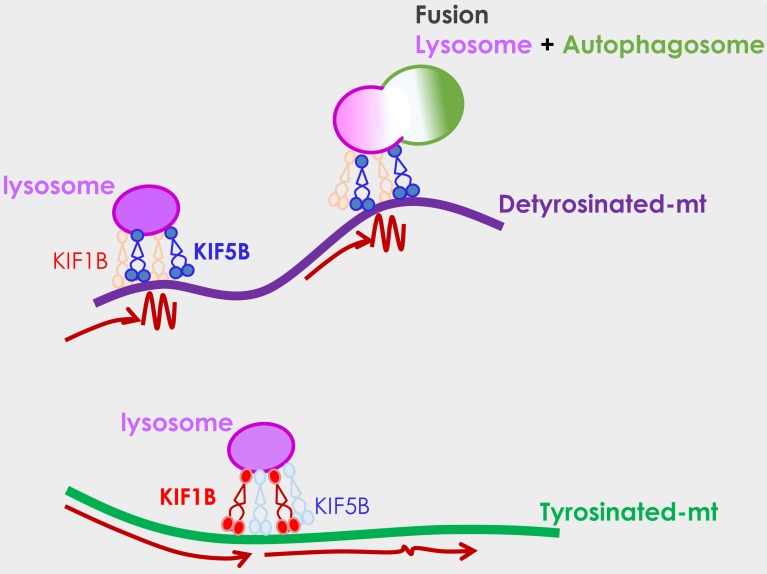
Figure 6.
Proposed model. Lysosomes (magenta) and autophagosomes (green) are enriched on a small subset of microtubules that are detyrosinated, where they can encounter each other, interact, and undergo fusion....
Figure images are served from the NIH/NLM PubMed Central Open Access Subset or Europe PMC; copyright remains with the publishers and authors.
💬 Discussion
0 commentsNo comments yet. Be the first to start a discussion!
Leave a Comment