Abstract
BACKGROUND: Intravascular leukocyte recruitment in most vertebrate tissues is restricted to postcapillary and collecting venules, whereas capillaries and arterioles usually support little or no leukocyte adhesion. This segmental restriction is thought to be mediated by endothelial, rather than hemodynamic, differences. The underlying mechanisms are largely unknown, in part because effective tools to distinguish, isolate, and analyze venular endothelial cells (V-ECs) and non-venular endothelial cells (NV-ECs) have been unavailable. We hypothesized that the atypical chemokine receptor DARC (Duffy Antigen Receptor for Chemokines, a.k.a. ACKR1 or CD234) may distinguish V-ECs versus NV-ECs in mice. METHODS: We generated a rat-anti-mouse monoclonal antibody (MAb) that specifically recognizes the erythroid and endothelial forms of native, surface-expressed DARC. Using this reagent, we characterized DARC expression and distribution in the microvasculature of murine tissues. RESULTS: DARC was exquisitely restricted to post-capillary and small collecting venules and completely absent from arteries, arterioles, capillaries, veins, and most lymphatics in every tissue analyzed. Accordingly, intravital microscopy showed that adhesive leukocyte-endothelial interactions were restricted to DARC+ venules. DARC was detectable over the entire circumference of V-ECs, but was more concentrated at cell-cell junctions. Analysis of single-cell suspensions suggested that the frequency of V-ECs among the total microvascular EC pool varies considerably between different tissues. CONCLUSIONS: Immunostaining of endothelial DARC allows the identification and isolation of intact V-ECs from multiple murine tissues. This strategy may be useful to dissect the mechanisms underlying segmental microvascular specialization in healthy and diseased tissues and to characterize the role of EC subsets in tissue-homeostasis, immune surveillance, infection, inflammation, and malignancies.
🔬 Techniques
🔭 Microscopes
💻 Software
✨ Fluorophores
🧪 Sample Preparation
🔬 Cell Lines
🏭 Microscope Brands
🧪 Reagent Suppliers
📷 Detectors
💻 Software Details
💾 Data Repositories
🏷️ Research Resource Identifiers (RRIDs)
Verified research resources used in this paper:
🏛️ Research Organizations (ROR)
Affiliated research institutions:
📋 Methods
We generated a rat-anti-mouse monoclonal antibody (MAb) that specifically recognizes the erythroid and endothelial forms of native, surface-expressed DARC. Using this reagent, we characterized DARC expression and distribution in the microvasculature of murine tissues.
Electronic supplementary material The online version of this article (doi:10.1186/s12915-017-0381-7) contains supplementary material, which is available to authorized users.
Methods Mice
C57BL/6 (catalog number 027) and BALB/c mice (RRID: IMSR_JAX:000651, catalog number 000651), 6–12 weeks old, were purchased from Charles River or Jackson Laboratories. DARC –/– mice [ 25 ] were bred at the University of York and used as tissue donors. Apoe −/− mice [ 26 ] were obtained from Jackson Laboratories (RRID: IMSR_JAX:002052, catalog number 002052). BM chimeras were generated by irradiating C57BL/6 mice (2 × 650 Rad) followed by intravenous (IV) injection of unfractionated DARC –/– BM mononuclear cells and a rest period of more than 12 weeks before use. Mice were housed under specific pathogen-free conditions in accordance with NIH guidelines. Experimental protocols were approved by the Institutional Animal Care and Use Committee at Harvard Medical School.
Construction of expression plasmids
The entire open reading frame of murine DARC was PCR amplified from brain cDNA and subcloned into pCR4Blunt-TOPO (Invitrogen Life Technologies). A DARC-eGFP fusion construct was created by overlap extension PCR [ 27 ]. BamHI and ECORI were used to insert DARC-eGFP into pcDNA3.1 expression vector (Invitrogen). Primer sequences are provided in Table 1 . Table 1 Primers Primers to create DARC-eGFP fusion protein DARC Fwd 5′- GCC ACC ATG GGG AAC TGT CT DARC Rvs 5′-GGA CTT GCC TGC AAG GGC AT BamH1-DARC Fwd 5′- GGA TCC GCC ACC GCC ACC ATG GGG AAC TGT CTG TAT C DARC-linker1 Rvs 5′- CCC TTG CTC ACC ATC TCG AGG GAC TTG CCT GCA AGG GCA TC DARC-linker3 Rvs 5′- CGC CGC GCT GCC GCC GCC GCC GGA CTT GCC TGC AAG GGC ATC GFP-linker1 Fwd 5′- TTG CAG GCA AGT CCC TCG AGA TGG TGA GCA AGG GCG AGG AG GFP-linker3 Fwd 5′- GGC GGC GGC AGC GCG GCG GCG ATG GTG AGC AAG GGC GAG GAG GFP-ECORI Rvs 5′- GAA TTC TTA CTT GTA CAG CTC GTC CAT GCC G Primers for RT-qPCR GAPDH Fwd CCAATGTGTCCGTCGTGGATCT GAPDH Rvs GTTGAAGTCGCAGGAGACAACC DARC Fwd TCCGGTGGAAAACCTTTCACTA DARC Rvs GCTGGTGTCAGGCTGTAGTC Selp Fwd TGTTTGGCTTCTGGGATCTGGACA From Kokkinaki et al. [ 69 ] Selp Rvs AGGCAGCAATTGGGTGCATACAG Madcam1 Fwd GACCCATAGAAAGGAGATTCCAGTA Madcam1 Rvs TGAGCCCAGTGGAGACTG Sele Fwd TGAACTGAAGGGATCAAGAAGACT From McEver et al. [ 70 ] Sele Rvs GCCGAGGGACATCATCACAT Chst4 Fwd TGCCCCACCTCCAAACAT From Ruddle et al. [ 71 ] Chst4 Rvs GACCAACGCCACGCCTGAGA Fut7 Fwd GGACCTCCTCGGGCCACCTACG From Ruddle et al. [ 71 ] Fut7 Rvs CGCCAAGCAAAGAAGCCACGATAA Monoclonal anti-mouse DARC antibody The rat cell line PC-12 (ATCC) was grown in F-12 K media (Gibco) with 2.5% fetal bovine serum (FBS) and 15% horse serum. The human embryonic kidney cell line HEK-293 was grown in DMEM (Corning) with 10% FBS. Both cell lines were stably transfected in 10-cm Petri dishes with 2 μg of plasmid using Lipofectamin 2000 (Invitrogen) following the manufacturer’s protocol. PC-12 cells were transfected with DARC-eGFP fusion protein and linker LG (named DARC-eGFP1) and HEK-293 were transfected with DARC-eGFP fusion protein and linker GGGGSAAA (named DARC-eGFP3). The antibiotic G418 (GIBCO) was added at a final concentration of 400 μg/mL 24 h after transfection. The selection medium was renewed every 3–4 days. Stable transfectants were further selected by cell sorting based on GFP expression. PC-12 DARC-eGFP transfectants were conditioned overnight with media supplemented with 10 mM sodium butyrate solution to boost transgene expression before immunization. Adult rats were immunized four times at 2-week intervals with 5 × 10 6 sodium butyrate-conditioned DARC-eGFP PC-12 cells. For the first immunization, transfectants were suspended in complete Freund’s adjuvant and injected by sub-cutaneous (s.c.) and intra-peritonal (i.p.) routes; the first booster injection of transfectants suspended in incomplete Freund’s adjuvant was performed by i.p. and subsequent injections were performed without adjuvants by the i.p. route. Immunization and fusion of hybridomas were performed by Abpro Biotechnology company under a service contract. Cloning and sub-cloning of the hybridomas was performed in the Dana Farber Monoclonal Antibody Core, Boston. Immune sera were screened by flow cytometry for reactivity with DARC ectodomains using HEK-293 cells expressing DARC-eGFP fusion protein and RBCs from wildtype (WT) or DARC –/– mice. Following splenocyte fusion, twelve 96-well plates were screened by flow cytometry. Two wells showed reactivity against mouse DARC. One clone producing an anti-mouse DARC MAb was isolated, expanded, and subcloned; the MAb was determined to be a rat IgG2a,k isotype. See Additional file 1 : Figure S1.
Show full methods section
We generated a rat-anti-mouse monoclonal antibody (MAb) that specifically recognizes the erythroid and endothelial forms of native, surface-expressed DARC. Using this reagent, we characterized DARC expression and distribution in the microvasculature of murine tissues.
Electronic supplementary material The online version of this article (doi:10.1186/s12915-017-0381-7) contains supplementary material, which is available to authorized users.
Methods Mice
C57BL/6 (catalog number 027) and BALB/c mice (RRID: IMSR_JAX:000651, catalog number 000651), 6–12 weeks old, were purchased from Charles River or Jackson Laboratories. DARC –/– mice [ 25 ] were bred at the University of York and used as tissue donors. Apoe −/− mice [ 26 ] were obtained from Jackson Laboratories (RRID: IMSR_JAX:002052, catalog number 002052). BM chimeras were generated by irradiating C57BL/6 mice (2 × 650 Rad) followed by intravenous (IV) injection of unfractionated DARC –/– BM mononuclear cells and a rest period of more than 12 weeks before use. Mice were housed under specific pathogen-free conditions in accordance with NIH guidelines. Experimental protocols were approved by the Institutional Animal Care and Use Committee at Harvard Medical School.
Construction of expression plasmids
The entire open reading frame of murine DARC was PCR amplified from brain cDNA and subcloned into pCR4Blunt-TOPO (Invitrogen Life Technologies). A DARC-eGFP fusion construct was created by overlap extension PCR [ 27 ]. BamHI and ECORI were used to insert DARC-eGFP into pcDNA3.1 expression vector (Invitrogen). Primer sequences are provided in Table 1 . Table 1 Primers Primers to create DARC-eGFP fusion protein DARC Fwd 5′- GCC ACC ATG GGG AAC TGT CT DARC Rvs 5′-GGA CTT GCC TGC AAG GGC AT BamH1-DARC Fwd 5′- GGA TCC GCC ACC GCC ACC ATG GGG AAC TGT CTG TAT C DARC-linker1 Rvs 5′- CCC TTG CTC ACC ATC TCG AGG GAC TTG CCT GCA AGG GCA TC DARC-linker3 Rvs 5′- CGC CGC GCT GCC GCC GCC GCC GGA CTT GCC TGC AAG GGC ATC GFP-linker1 Fwd 5′- TTG CAG GCA AGT CCC TCG AGA TGG TGA GCA AGG GCG AGG AG GFP-linker3 Fwd 5′- GGC GGC GGC AGC GCG GCG GCG ATG GTG AGC AAG GGC GAG GAG GFP-ECORI Rvs 5′- GAA TTC TTA CTT GTA CAG CTC GTC CAT GCC G Primers for RT-qPCR GAPDH Fwd CCAATGTGTCCGTCGTGGATCT GAPDH Rvs GTTGAAGTCGCAGGAGACAACC DARC Fwd TCCGGTGGAAAACCTTTCACTA DARC Rvs GCTGGTGTCAGGCTGTAGTC Selp Fwd TGTTTGGCTTCTGGGATCTGGACA From Kokkinaki et al. [ 69 ] Selp Rvs AGGCAGCAATTGGGTGCATACAG Madcam1 Fwd GACCCATAGAAAGGAGATTCCAGTA Madcam1 Rvs TGAGCCCAGTGGAGACTG Sele Fwd TGAACTGAAGGGATCAAGAAGACT From McEver et al. [ 70 ] Sele Rvs GCCGAGGGACATCATCACAT Chst4 Fwd TGCCCCACCTCCAAACAT From Ruddle et al. [ 71 ] Chst4 Rvs GACCAACGCCACGCCTGAGA Fut7 Fwd GGACCTCCTCGGGCCACCTACG From Ruddle et al. [ 71 ] Fut7 Rvs CGCCAAGCAAAGAAGCCACGATAA Monoclonal anti-mouse DARC antibody The rat cell line PC-12 (ATCC) was grown in F-12 K media (Gibco) with 2.5% fetal bovine serum (FBS) and 15% horse serum. The human embryonic kidney cell line HEK-293 was grown in DMEM (Corning) with 10% FBS. Both cell lines were stably transfected in 10-cm Petri dishes with 2 μg of plasmid using Lipofectamin 2000 (Invitrogen) following the manufacturer’s protocol. PC-12 cells were transfected with DARC-eGFP fusion protein and linker LG (named DARC-eGFP1) and HEK-293 were transfected with DARC-eGFP fusion protein and linker GGGGSAAA (named DARC-eGFP3). The antibiotic G418 (GIBCO) was added at a final concentration of 400 μg/mL 24 h after transfection. The selection medium was renewed every 3–4 days. Stable transfectants were further selected by cell sorting based on GFP expression. PC-12 DARC-eGFP transfectants were conditioned overnight with media supplemented with 10 mM sodium butyrate solution to boost transgene expression before immunization. Adult rats were immunized four times at 2-week intervals with 5 × 10 6 sodium butyrate-conditioned DARC-eGFP PC-12 cells. For the first immunization, transfectants were suspended in complete Freund’s adjuvant and injected by sub-cutaneous (s.c.) and intra-peritonal (i.p.) routes; the first booster injection of transfectants suspended in incomplete Freund’s adjuvant was performed by i.p. and subsequent injections were performed without adjuvants by the i.p. route. Immunization and fusion of hybridomas were performed by Abpro Biotechnology company under a service contract. Cloning and sub-cloning of the hybridomas was performed in the Dana Farber Monoclonal Antibody Core, Boston. Immune sera were screened by flow cytometry for reactivity with DARC ectodomains using HEK-293 cells expressing DARC-eGFP fusion protein and RBCs from wildtype (WT) or DARC –/– mice. Following splenocyte fusion, twelve 96-well plates were screened by flow cytometry. Two wells showed reactivity against mouse DARC. One clone producing an anti-mouse DARC MAb was isolated, expanded, and subcloned; the MAb was determined to be a rat IgG2a,k isotype. See Additional file 1 : Figure S1.
Antibodies for immunofluorescence staining Anti-mouse DARC
MAb was conjugated to Alexa Fluor dyes 488, 546, or 647. Anti-Lyve-1 (clone ALY7; eBiosciences) was conjugated to Pacific blue using a commercial kit (Molecular Probes). DAPI (Invitrogen) was used to stain nuclei in immunohistochemistry. UEA-1 lectin (Vector Labs) against mTECs was conjugated to Alexa Fluor 647. Insulin was detected using GP-anti-bovine insulin serum (Linco Research Inc.). See complete list of antibodies in Table 2 . Table 2 Antibodies for immunofluorescence staining Label Antibody Clone Company Catalog number RRID number Alexa Fluor 488 conjugated Anti-DARC Clone 6B7 Generated in-house anti-CD31 Clone 390 MEC13.3 Biolegend 102414 102502 AB_493408 AB_312913 anti-PNAd Clone MECA-79 eBioscience 53-6036 AB_10804391 anti-MAdCAM-1 Clone MECA-367 Biolegend 120707 AB_493399 Anti-LYVE1 Clone ALY7 eBioscience 53-0443 AB_1633415 Rat IgG2a, κ isotype control Biolegend 400525 AB_389320 Rat IgM, κ isotype control Biolegend 400811 AB_1659271 PE conjugated anti-CD31 Clone 390 Biolegend 102408 AB_312903 Anti-ICAM-1 3E2 BD Pharmingen 553253 AB_394735 Armenian Hamster IgG Isotype control Biolegend 400908 AB_326594 PE-Cy7 conjugated anti-gp38 Clone 8.1.1 Biolegend 127411 AB_10613294 anti-TER-119 Clone TER-119 Biolegend 116222 AB_2281408 Alexa Fluor 647 conjugated Anti-DARC Clone 6B7 Generated in-house rat IgG2a,k isotype control Biolegend 400526 AB_389342 APC-Cy7 conjugated anti-TER-119 Clone TER-119 Biolegend 116223 AB_2137788 Anti-CD45.2 Clone 104 Biolegend 109824 AB_830789 anti-CD11b Clone M1/70 Biolegend 101226 AB_10784810 Pacific blue conjugated anti-CD45.2 Clone 104 Biolegend 109820 AB_492872 Anti-CD45 Clone 30-F11 Biolegend 103126 AB_493535 Anti-CD31 Clone 390 102422 AB_10612926 Brilliant violet 510 conjugated Anti-CD45 Clone 30-F11 Biolegend 103138 AB_2563061 Alexa Fluor 546 conjugated Anti-DARC Clone 6B7 Generated in-house Alexa Fluor 605 conjugated Anti-CD31 Clone 390 Biolegend 102427 AB_2563982 Anti-CD45 Clone 30-F11 103139 AB_2562341 Confocal microscopy and image analysis For whole-mount staining, omentum, ear, cremaster muscle, and bladder were harvested from young adult donor mice and immediately fixed in phosphate-buffered 1% paraformaldehyde/1.5% L -lysine/0.2% sodium periodate (PLP) sodium phosphate dibasic (0.1 M Na 2 HPO 4 ) solution, pH = 7, overnight at 4 °C. Conjunctivae were fixed in acetone for 10 min at room temperature. For frozen sections, tissues were fixed in PLP overnight (4 °C) followed by incubation in 30% sucrose in phosphate-buffered saline (PBS). Samples were snap-frozen in Tissue Freezing Medium (Triangle Biomedical Sciences) and stored at –80 °C. Thin sections (30 μm) were prepared on a cryostat, mounted on Superfrost Plus slides (VWR), and stained with fluorescent antibodies in a humidified chamber after FcR blockade with 2.4G2 antibody. 2.4G2 mAb blocks non-antigen-specific binding of immunoglobulins to the FcγIII and FcγII, and possibly FcγI, receptors. Tissues were stained (overnight, 4 °C) in blocking buffer and washed (see list of buffers in Table 3 ). Whole-mount preparations were mounted between two coverslips (VWR) with Genteal (Acori); frozen sections were mounted in FluorSave reagent (Calbiochem) and stored at 4 °C. Table 3 Buffer recipes Buffer name Recipe IHC blocking buffer PBS with 0.5% BSA (Calbiochem) and 0.3% Triton X-100 (Sigma) IHC washing buffer PBS with 0.2% BSA (Calbiochem) and 0.1% Triton X-100 (Sigma) Digestion buffer HBSS (Corning) with 2% FBS (Gemini), 10 mM HEPES (Corning) and 2 mM CaCl 2 (Sigma) FACS buffer PBS (Lonza) with 5% FCS (Invitrogen-Gibco) and 5 mM EDTA (Boston BioProducts) Two whole mounts of fresh murine omentum were prepared and stained for CD31 and DARC, as described above, and z-stacks of confocal micrographs were acquired (10 or 15 images at 2.9 μm vertical step intervals). Fluorescent images were used for 3D rendering using Imaris software. Supporting data values for all surface areas are included in Additional file 2 . Confocal images were acquired on an Olympus Fluoview BX50WI inverted microscope with × 10/0.4, ×20/0.5, and × 40/1.3 objectives. Image stacks for three-dimensional reconstructions were acquired at 1–4.5 μm Z-intervals. Image analysis was performed using Volocity (Improvision) or Imaris (Bitplane) software.
Preparation of aorta
To induce atherosclerosis, Apoe –/– mice were fed a Western diet (Harlan Teklad) for 12 weeks prior to analysis [ 28 ]. Aortic root tissue was frozen in OCT and 5-μm thick sections were cut with a cryostat. Sections were fixed in isopropanol for 10 min at 4 °C and blocked with PBS + 10% goat serum + 0.5% BSA. Staining was performed overnight at 4 °C with AF546-anti-DARC antibody + APC-anti-CD31 (MEC 13.3). Samples were fixed in 4% PFA for 10 min, nuclei were stained with Yoyo-1, and sections were mounted using Prolong Gold reagent. Images of the vasa vasorum of aorta were acquired on a Leica SP5 microscope. Tissue digestion Lymph node and brain tissues were digested with 2.5 mg/mL Collagenase D (Roche), 50 μg/mL DNAse I (Roche), and 0.4× protease inhibitor (Roche) in digestion buffer at 37 °C. Digestion of LNs was adapted from Fletcher et al. [ 29 ], such that tissues were digested for 20 min without protease inhibitor followed by three 10-min incubations with protease inhibitor. Brain tissues were digested for 15–20 min at 37 °C. Enrichment of ECs was performed by centrifugation at 5000 g for 30 min at 4 °C in a dextran solution (17% dextran (Sigma, catalog number 31392)/20 mM HEPES). Skin, colon, and small intestine tissues were digested with 2.5 mg/mL Collagenase D (Roche), 50 μg/mL DNAse I (Roche), and 1× protease inhibitor (Roche) in digestion buffer for 30 min at 37 °C on a rotisserie wheel. Colon and small intestine were washed with 5% FBS and 25 mM HEPES, followed by 2 mM EDTA and 25 mM HEPES, and finally 10% FBS, 5 mM EDTA, and 15 mM HEPES prior to enzymatic digestion to remove epithelial cells. Pancreatic and adipose tissues were digested with 1.25 mg/mL Collagenase D (Roche), 50 μg/mL DNAse I (Roche), and 1× protease inhibitor (Roche) in digestion buffer for 30 min at 37 °C on a rotisserie wheel. Cells were resuspended in FACS buffer (PBS (Lonza), 5% FBS (Invitrogen-Gibco), 5 mM EDTA (Boston BioProducts)) for analysis.
Flow cytometry
Single-cell suspensions were immunostained, washed, and resuspended in FACS buffer containing 7-AAD viability stain (BioLegend) for immediate acquisition using a BD FACS CANTO, BD LSRII (BD Biosciences), or CytoFlex (Beckman Coulter) and analyzed using FlowJo software (Treestar). RT-qPCR EC subsets were FACS-sorted using an Aria I cell sorter (BD Biosciences) and collected in Trizol (Ambion). RNA extraction was performed prior to cDNA synthesis using the iScript kit (BioRad). qPCR was performed on a LightCycler 480 II (Roche) using SybGreen Quantifast kit (Qiagen). Relative gene expression was calculated using the ∆CT method. See list of primers in Table 1 . Intravital microscopy (IVM) IVM of subiliac lymph node, skin, BM, and cremaster muscle was performed as previously described [ 5 , 30 – 32 ] using an IV-500 intravital microscope (Mikron Instruments), equipped with a Rapp OptoElectronic SP-20 xenon flash lamp system and QImaging Rolera-MGi EMCCD camera.
Western blot analysis
Protein extracts were loaded on a 4–12% Tris-Glycine precast gel (Invitrogen). Precision Plus protein Kaleidoscope standards (Bio-Rad, catalog number 161-0375) were used as controls for molecular weight. Heat-denaturation of protein samples was performed. Membranes were incubated with anti-mouse DARC MAb and revealed using HRP-linked anti-rat antibody (Cell Signaling, RRID AB_10694715, catalog number 7077S). Anti-β-actin antibody (Sigma, RRID AB_476743, catalog number A5316) was used for loading control. Immunoreactive proteins were detected with Pierce ECL Western Blotting Substrate (Thermo Scientific).
Chemokine binding assay
Chemokine binding to RBCs was assessed as previously described [ 33 ], with slight modifications. RBCs were incubated with increasing chemokine concentrations (10 –10 –10 –5 M or 10 –11 –10 –7 M of CXCL8 or mCXCL1, respectively), with either anti-human DARC MAb Fy6 (gift from Dr. M. Uchikawa, Japanese Red Cross) or anti-mouse DARC MAb. Mean fluorescence of MAb staining was analyzed by FACS. IC 50 was calculated using GraphPad Prism software.
Statistical analysis
Results are expressed as means ± SEM. All statistical analyses were performed in Prism (GraphPad Software) or Excel Software. Means between two groups were compared by two-tailed t-test. Means between three or more groups were compared by one-way or two-way ANOVA with Tukey’s or Dunnett’s Multiple Comparison Test. The numbers of replicates or animals are indicated in figure legends.
Additional files Additional file 1: Figure S1.
Generation of monoclonal anti-mouse
DARC antibody. To generate the monoclonal anti-mouse DARC antibody, rats were immunized with a stably transfected PC-12 rat cell line expressing DARC-eGFP fusion protein. (A) Validation of membrane expression was performed by confocal microscopy using HEK-293 cells stably transfected to express DARC-eGFP. (B) Before immunization, DARC-eGFP PC-12 cells were treated with sodium butyrate to maximize the expression of the transfected fusion protein. Flow cytometry histogram shows eGFP fluorescence intensity on PC-12 cells before (grey) and after 24 hours of sodium butyrate treatment (black). (C) Adult rats were immunized four times at 2-week intervals with 5 × 10 6 sodium butyrate conditioned DARC-eGFP PC-12 transfectants. The first immunization was performed with Complete Freund Adjuvant via s.c. and i.p. routes, the second injection was performed with Incomplete Freund Adjuvant i.p., and the third and last injections were each administered i.p. without adjuvant. (D) Immune sera were screened by flow cytometry for reactivity with DARC ectodomains using HEK-293 cells expressing DARC-eGFP fusion protein. Fluorescence intensity is expressed as geometric mean of fluorescence (GeoMFI). Following splenocyte fusion, twelve 96-well plates were screened by flow cytometry, only two wells showed reactivity against mouse DARC. One clone producing an anti-mouse DARC MAb was isolated, expanded, subcloned, purified, and labeled for this study. (PDF 190 kb) Additional file 2: Raw data for Fig 2b , Fig 5 , Fig 6g , Additional file 7 : Figure S6B and Additional file 8 : Figure S7. (XLS 217 kb) Additional file 3: Figure S2. Anti-mouse DARC MAb cross-reactivity and function. (A) Representative flow cytometry histograms of TER-119 + RBCs and CD45 + hematopoietic cells stained with anti-mouse DARC MAb (black) and isotype control (grey) from C57BL/6 and BALB/c mice (n = 6 mice per group). (B) Representative flow cytometry histograms of mouse, rat, and human RBCs stained with anti-mouse DARC MAb (black) and isotype control (grey). The anti-mouse DARC MAb does not show specific reactivity for the rat and human erythrocyte form of DARC protein (n = 2 individuals per group), (C) Blood was taken from Duffy-positive laboratory donors and 10 6 red cells were incubated with increasing concentrations of CXCL8 and mCXCL1 in 100 μL PBS with 0.5% BSA for 1 h at 37 °C and subsequently 1 μL of anti-human Fy6 for 30 min, and finally 1 μL of PE-conjugated goat anti-mouse antibody added. For determination of inhibition of directly conjugated anti-murine DARC antibody binding by chemokines, blood was taken from wildtype mice and 10 6 red cells were incubated with increasing concentrations of CXCL8 and mCXCL1 in 100 μL PBS with 0.5% BSA for 1 h at 37 °C and subsequently 1 μL of Alexa-647 conjugated anti-murine DARC for 30 min. Mean fluorescence of DARC MAb stainings were measured by flow cytometry. (PDF 218 kb) Additional file 4: Figure S3. Quantification of DARC expression on blood microvasculature. To determine DARC expression on arterioles, capillaries, pre-venular capillaries (PVC), post-capillary venules (PCV), and collecting venules, we analyzed DARC expression in a microvascular network stained with anti-CD31 (green) and anti-DARC (red). White squares indicate the regions selected to illustrate positive, partial, or negative pre-venular capillaries (PVC) for DARC expression as well as partial DARC expression on post-capillary venules (PCV) in Fig. 2 ; 20× objective, scale bars = 200 μm. (PDF 391 kb) Additional file 5: Figure S4. DARC expression on vein and artery. Representative confocal micrographs of whole mount staining of femoral vessels stained with anti-DARC or isotype control (red), anti-CD31 (green), and DAPI (blue) as indicated. Bright field indicates the localization of vein and artery. DARC is not detected on vein and artery but is expressed on venules (arrowhead) in the microvasculature of the surrounding connective tissue; 10× objective, scale bars = 300 μm (n = 3 experiments). (PDF 731 kb) Additional file 6: Figure S5. DARC positive vessels in vasa vasorum of aorta of wildtype (WT) and Apoe –/– mice. Representative confocal micrographs of DARC expression on venules in the vasa vasorum of aorta of WT (A) or Apoe –/– mice (B). Tissues were stained with anti-CD31 (green), anti-DARC MAb (red), and Yoyo-1 (blue) was used to stain nuclei. Arrows indicate DARC + vessels and arrowheads indicate DARC – vessels (WT n = 5 experiments, Apoe –/– n = 8 experiments). (PDF 426 kb) Additional file 7: Figure S6. DARC epitope sensitivity to enzymatic digestion. (A) Representative flow cytometry histograms of DARC expression on RBCs. RBCs from blood were digested at 37 °C with different concentration of enzymes as indicated: Collagenase VII (1×) = 86 μg/mL, Collagenase D (1×) = 2.5 mg/mL and Collagenase II (1×) = 1.5 mg/mL. RBCs at 4 °C and 37 °C without digestion are used as positive controls for DARC expression. Flow cytometry was performed to detect DARC expression (n = 5 experiments). (B) Quantification of DARC expression on RBCs, results are shown as delta Geometric Mean Intensity of Fluorescence (n = 3 mice/group). Error bars show mean ± SEM. ns P > 0.05, ** P ≤ 0.01, *** P ≤ 0.001. Supporting data values are included in Additional file 2 . (PDF 180 kb) Additional file 8: Figure S7. DARC expression in whole mount adipose tissue. Confocal micrographs of whole mount staining of adipose tissue (omentum) were analyzed for CD31 (green) and DARC (red) expression. The fluorescence intensity images (upper panels) and the corresponding 3D rendering images (lower panels) are shown. Surface area for CD31 and DARC channels were calculated using Imaris software and shown as μm 2 . 10× objective, scale bars = 100 μm. Supporting data values are included in Additional file 2 . (PDF 261 kb) Additional file 9: Figure S8. DARC expression on lymphatic endothelial cells. (A) Flow cytometry analysis of DARC expression on lymphatic endothelial cells (LECs) in mesenteric lymph node (MLN), peripheral lymph node (PLN), adipose tissue, and skin. Live LECs are defined as followed: CD45 negative, CD31 and gp38 positive. DARC expression is shown as frequency of LEC subset. (B) Bar graph showing the frequency of DARC + LECs among total LEC population in MLN (n = 7), PLN (n = 6), adipose tissue (AT) (n = 6), and skin (n = 6). Data were excluded from the analysis if number of events in LEC gate was less than 500. Error bars show mean ± SEM. * P ≤ 0.05, *** P ≤ 0.001. (C) DARC expression shown as geometric mean of intensity of fluorescence (Geo.MFI) on venules (V-EC), lymphatic EC (LEC), and non-venules (NV-EC). Error bars show mean ± SEM. ns P > 0.05, ** P ≤ 0.01, *** P ≤ 0.001. “#” Identical statistic results for skin, MLN, and PLN. Statistic results for AT are indicated in blue. (PDF 186 kb)
Availability of data and materials The following reagents used in the paper are subject to MTA: DARC-eGFP PC12 cell line, DARC-eGFP HEK-293 cell line, DARC HEK-293 cell line, and anti-mouse DARC MAb (Clone 6B7). All reasonable requests for materials used in the research will be fulfilled, provided that a written agreement is executed in advance between Harvard Medical School and the requester (and his or her affiliated institution). Such inquiries or requests for additional data should be directed to the corresponding author. The data supporting the conclusions of this article are included within the article and its additional files.
📊 Figures
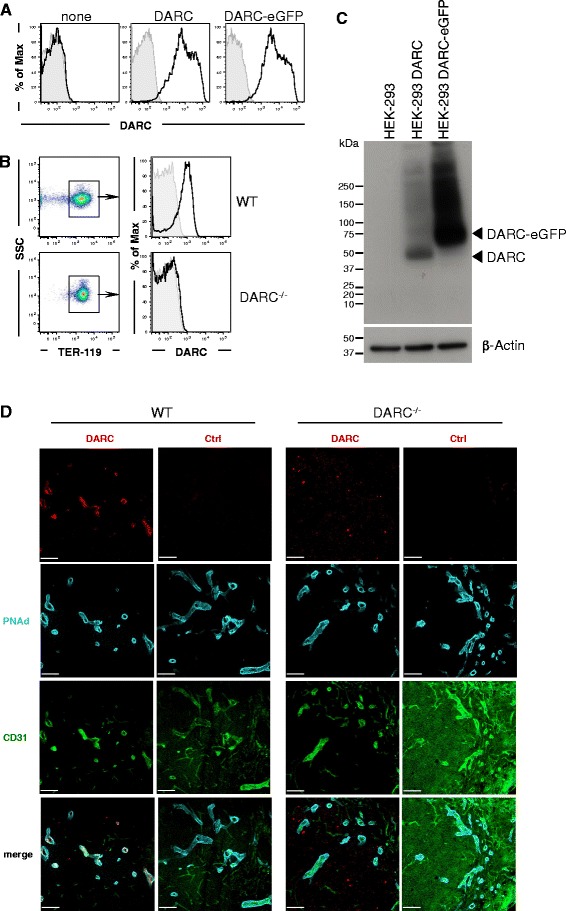
Fig. 1
Validation of anti-mouse DARC MAb reactivity. a Representative flow cytometry histograms of control HEK-293 cells (none) and HEK-293 cells transfected with DARC or DARC-eGFP fusion protein stained wit...
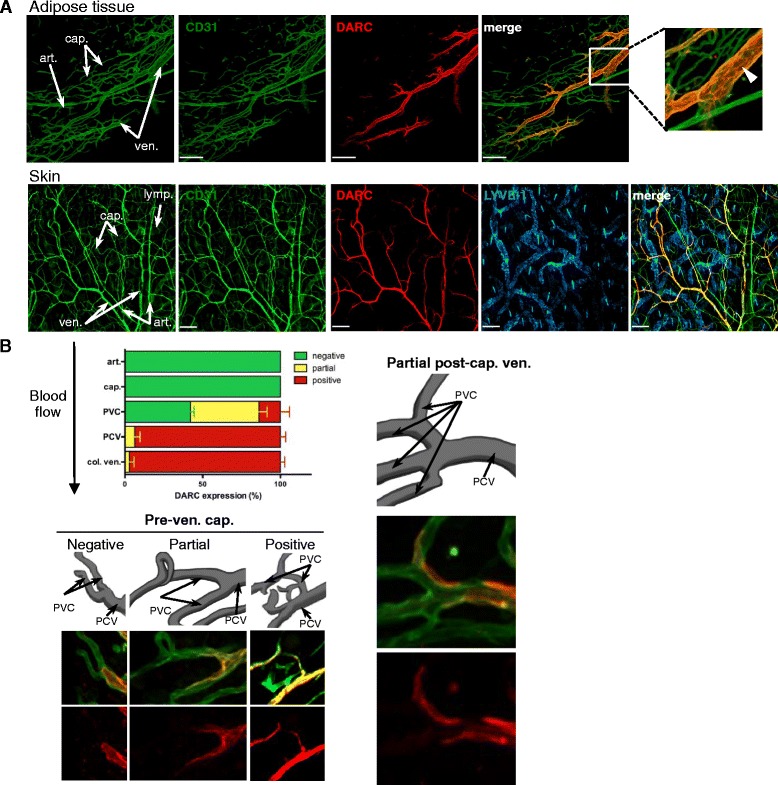
Fig. 2
DARC is a robust marker of venular endothelial cell differentiation. a Representative confocal micrographs of whole mount stainings of adipose tissue (omentum, 20u00d7 objective, scale barsu2009=u2009...
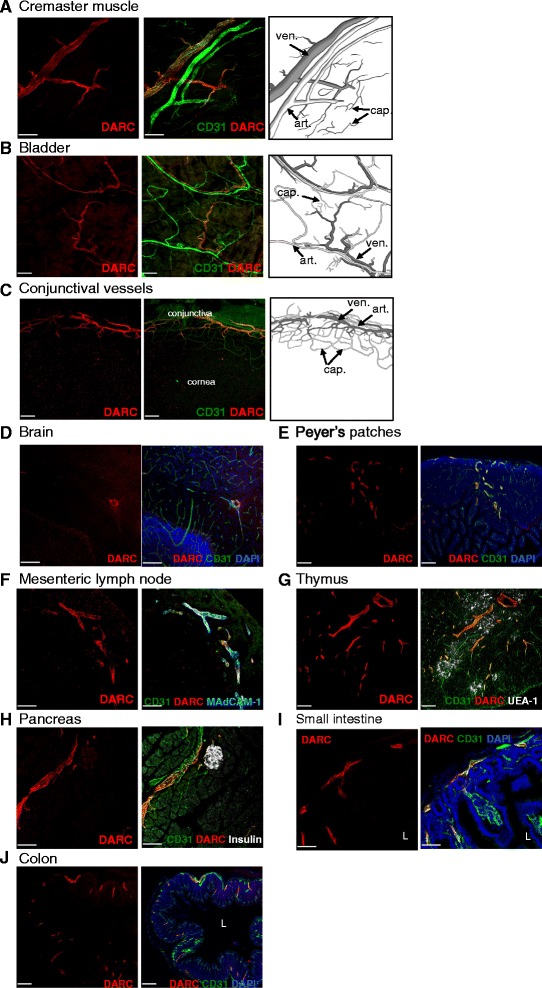
Fig. 3
DARC expression on whole mount and frozen section stainings. Representative confocal micrographs of whole mount staining of ( a ) cremaster muscle (20u00d7 objective, scale baru2009=u2009200u00a0u03bc...
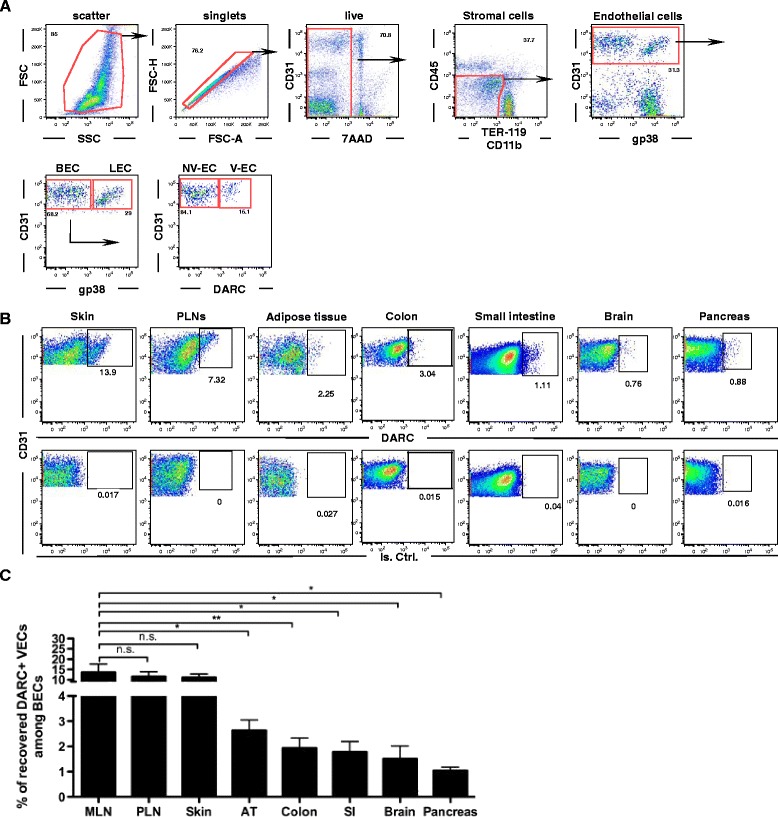
Fig. 4
Identification of DARC + venular endothelial cells (V-ECs) by flow cytometry. a Gating strategy to identify EC subsets in single cell suspensions of murine lymph nodes; BEC blood ECs, LEC lymphatic EC...
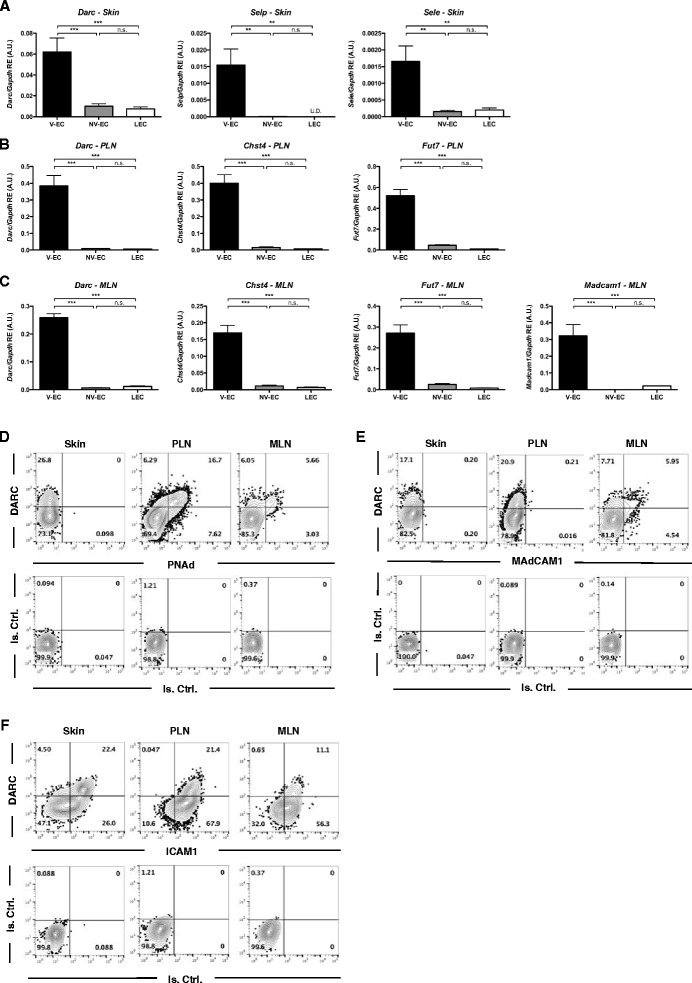
Fig. 5
Correlation of DARC expression and known venular markers. a RT-qPCR showing DARC ( Darc ), P- ( Selp ), and E-selectins ( Sele ) expression at the mRNA level in cell-sorted V-EC (CD45-CD31u2009+u2009g...
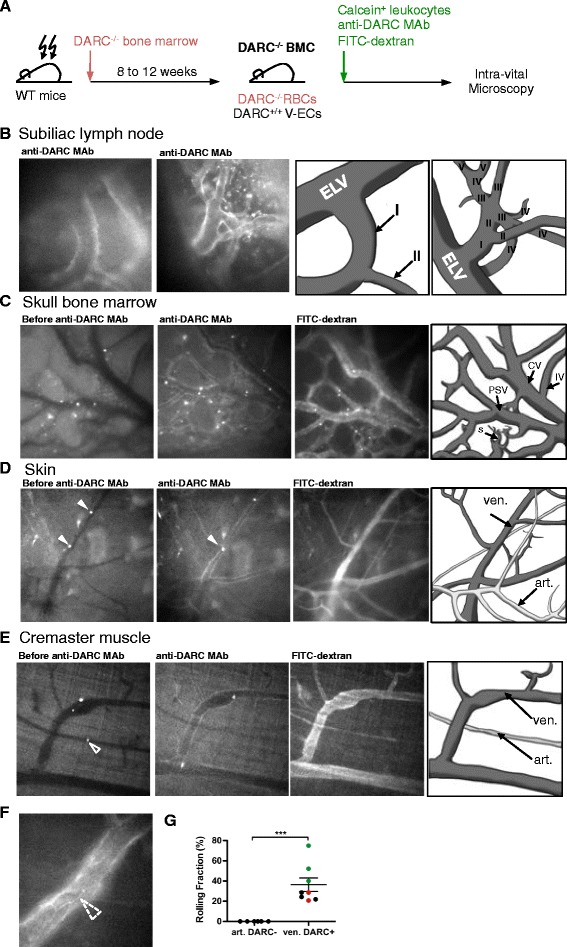
Fig. 6
Intravital microscopy (IVM) of leukocyte adhesion in DARC + venules. a Schematic representation of IVM experiment. b Alexa Fluor 488 labeled anti-mouse DARC MAb staining of microvessels in subiliac ly...
Figure images are served from the NIH/NLM PubMed Central Open Access Subset or Europe PMC; copyright remains with the publishers and authors.
💬 Discussion
0 commentsNo comments yet. Be the first to start a discussion!
Leave a Comment