Abstract
Transmission of malaria parasites relies on the formation of a specialized blood form called the gametocyte. Gametocytes of the human pathogen, Plasmodium falciparum, adopt a crescent shape. Their dramatic morphogenesis is driven by the assembly of a network of microtubules and an underpinning inner membrane complex (IMC). Using super-resolution optical and electron microscopies we define the ultrastructure of the IMC at different stages of gametocyte development. We characterize two new proteins of the gametocyte IMC, called PhIL1 and PIP1. Genetic disruption of PhIL1 or PIP1 ablates elongation and prevents formation of transmission-ready mature gametocytes. The maturation defect is accompanied by failure to form an enveloping IMC and a marked swelling of the digestive vacuole, suggesting PhIL1 and PIP1 are required for correct membrane trafficking. Using immunoprecipitation and mass spectrometry we reveal that PhIL1 interacts with known and new components of the gametocyte IMC.
🔬 Techniques
🔭 Microscopes
🧬 Organisms
💻 Software
✨ Fluorophores
🧪 Sample Preparation
🏭 Microscope Brands
🧪 Reagent Suppliers
🎨 Filters
💻 Software Details
💾 Data Repositories
🏛️ Research Organizations (ROR)
Affiliated research institutions:
📋 Methods
Parasite culture
Asexual stage parasites were grown in O+ RBCs (Australian Red Cross blood service) at 5% hematocrit. The parasites were maintained in complete culture media containing RPMI-GlutaMAX-HEPES (Invitrogen) supplemented with 5% v/v human serum (Australian Red Cross blood service), 0.25% w/v AlbuMAX II (Invitrogen), 200 μM hypoxanthine, 10 mM D-glucose (Sigma) and 20 μg/ml gentamicin (Sigma). To obtain ring stage cultures sorbitol (5%) synchronization was performed [ 37 ]. Transfectants were maintained in media supplemented with WR99210 (5 nM). High gametocyte producing NF54 and 3D7 parasite lines were used [ 38 , 39 ]. Gametocytes were generated as previously described [ 13 , 40 , 41 ]. Asexual stage parasites were sorbitol synchronized to produce a ring stage culture and the parasitemia adjusted to 3% parasitemia at 5% hematocrit (day -4). The culture was grown in complete culture media until day -1 resulting in a culture containing 8–10% trophozoite stage parasites. The culture was adjusted to 2% parasitemia 5% hematocrit by addition of fresh media and RBCs. The spent culture media was left on the culture at a ratio of 1:4 with fresh media to induce gametocyte induction. N-acetyl-D-glucosamine (GluNac; 62.5 mM final concentration) was added from day 0 of the culture [ 40 ]. This protocol results in synchronized gametocyte production. Gametocyte stage development was monitored by thin blood films and Giemsa staining. The following timing of stage progression is used as a guide but can vary depending on the cell line and age of asexual cells when the assay was established. Day 0–1: stage I; Day 2–3: stage II; Day 4–5: stage III, Day 6–7: stage IV; day 8 –onwards: stage V. Gametocytes were purified from culture at the required development stage by Percoll density gradient or magnet separation [ 40 , 41 ].
Show full methods section
Parasite culture
Asexual stage parasites were grown in O+ RBCs (Australian Red Cross blood service) at 5% hematocrit. The parasites were maintained in complete culture media containing RPMI-GlutaMAX-HEPES (Invitrogen) supplemented with 5% v/v human serum (Australian Red Cross blood service), 0.25% w/v AlbuMAX II (Invitrogen), 200 μM hypoxanthine, 10 mM D-glucose (Sigma) and 20 μg/ml gentamicin (Sigma). To obtain ring stage cultures sorbitol (5%) synchronization was performed [ 37 ]. Transfectants were maintained in media supplemented with WR99210 (5 nM). High gametocyte producing NF54 and 3D7 parasite lines were used [ 38 , 39 ]. Gametocytes were generated as previously described [ 13 , 40 , 41 ]. Asexual stage parasites were sorbitol synchronized to produce a ring stage culture and the parasitemia adjusted to 3% parasitemia at 5% hematocrit (day -4). The culture was grown in complete culture media until day -1 resulting in a culture containing 8–10% trophozoite stage parasites. The culture was adjusted to 2% parasitemia 5% hematocrit by addition of fresh media and RBCs. The spent culture media was left on the culture at a ratio of 1:4 with fresh media to induce gametocyte induction. N-acetyl-D-glucosamine (GluNac; 62.5 mM final concentration) was added from day 0 of the culture [ 40 ]. This protocol results in synchronized gametocyte production. Gametocyte stage development was monitored by thin blood films and Giemsa staining. The following timing of stage progression is used as a guide but can vary depending on the cell line and age of asexual cells when the assay was established. Day 0–1: stage I; Day 2–3: stage II; Day 4–5: stage III, Day 6–7: stage IV; day 8 –onwards: stage V. Gametocytes were purified from culture at the required development stage by Percoll density gradient or magnet separation [ 40 , 41 ].
Plasmid construction and transfection
The pPhIL1-3xHA plasmid was created by amplifying full length PhIL1 sequence from genomic 3D7 DNA with the P1FHA (GC AGATCT AAAATGCTTTCTTCCATATCACCAAAAAG) and P1RHA (AA CTGCAG CCATATCTTGGTTATAATTTTCTTGATC) primers (restriction enzyme sites in bold). The resulting PCR product was directionally cloned into the Bgl II and Pst I sites of the pD3HA plasmid. The pPfs16-PhIL1-GFP construct is an episomally maintained plasmid that utilizes the promoter region of the early gametocyte specific protein Pfs16 [ 12 ]. The full-length coding sequence of PhIL1 was amplified from genomic 3D7 DNA with the PIGFPF (GC GTCGAC AAAATGCTTTCTTCCATATCACCAAAAAG) and PIGFPR (AA CTGCAG TGCTGCTGCTGCTGCTGCTGCTGCCATATCTTGGTTATAATTTTCTTGATC) primers containing Bgl II and Pst I restrictions sites respectively. This product was directionally cloned into the p16proPfs16-GFP Entry plasmid [ 12 ] which had been predigested with Bgl II and Pst I to remove the Pfs16 coding sequence. The resulting plasmid pPfs16pro-PhIL1-GFP was recombined with the pHH1 Destination vector as previously described to obtain the pHH1-Pfs16pro-PhIL1-GFP plasmid [ 12 ]. The pGLMS-PhIL1-HA inducible knockdown construct was made as described above for the pPhIL1-3xHA plasmid, with cloning of the same full-length PhIL1 fragment into the pGlmS plasmid. To generate the pGlmS-PIP1-HA plasmids the coding sequence of PIP1 was PCR amplified from 3D7 genomic DNA using the PIPF (GTCGACGGATCCATGAATAACGGATCTAATAAA) and PIPR (CTGCAGTGCTCTTTTTTTAAATTGCATAGG) primers and directionally cloned into the pGLMS-HA plasmid using the Bam HI and Pst I restriction sites. Parasite transfections were performed by electroporation as previously described [ 42 ]. Drug cycling was performed to enrich for integrated parasites. Integration of the lines was confirmed by PCR using the PHILINT (GAACCTTCCATAACAGAC) or PIPINT (CCGCGGCCTATATTATTTTCATTAAACATTGAC) primers that target genomic sequence upstream of the targeting sequence in combination with the vector specific HArev (CGAACATTAAGCTGCCATAT) reverse primer. Recombinant protein and antibody production A codon optimized (for E . coli ) sequence of full length PhIL1 (PlamsoDB ID: PF3D7_0109000.1) was commercially synthesized by GenScript. This sequence was directionally cloned into the Pst I and Bgl II sites of the pQE-30 protein expression plasmid, which will place a 6xHis tag at the N-terminus of the resulting protein. The plasmid was transformed into BL21 (DE3) E . coli (Bioline) and grown in the presence of 100 μg/ml Ampicillin. The expression of recombinant PhIL1 was induced with the addition of 2 mM isopropyl-D-1-thiogalactopyranosid (IPTG). After 3 h, cells were pelleted via centrifugation at 4,000 x g for 20 min at 4°C and the pellet was then re-suspended in lysis buffer (50 mM NaH 2 PO 4 , 300 mM NaCl, 10 mM imidazole, pH 8.0). Lysozyme (1 mg/mL) was also added and cells were incubated on ice for 30 min. The lysate was then sonicated and drawn through a 21-gauge syringe before being frozen at -80°C overnight. After thawing, the lysate was centrifuged at 10,000 x g for 20 min at 4°C and the supernatant containing the soluble protein fraction was discarded. The pellet was re-suspended in a denaturing lysis buffer (100 mM NaH 2 PO 4 , 10 mM Tris-Cl, 8 M urea, pH 8.0) and after a 1 h incubation period, the E . coli lysate was centrifuged at 10,000 x g for 20 min. His-tagged PhIL1 was purified from the supernatant fraction using a batch purification method. The bacterial lysate was mixed with 50% Ni-NTA agarose resin for 1 h on a rotary mixer and then placed into a column. The agarose resin was washed three times using a wash buffer (100 mM NaH 2 PO 4 , 10 mM Tris-Cl, 8 M urea, pH 6.3). Recombinant PhIL1 was eluted using elution buffer A (100 mM NaH 2 PO 4 , 10 mM Tris-Cl, 8M urea, pH 5.9) and then elution buffer B (100 mM NaH 2 PO 4 , 10 mM Tris-Cl, 8 M urea, pH 4.5). All elution fractions were collected. Those containing PhIL1 protein were pooled and the buffer was exchanged for 1x PBS via dialysis. The resultant protein was then sent to the Walter and Eliza Hall Institute antibody facility, Bundoora. Rabbits were immunized to produce polyclonal antibodies against P . falciparum PhIL1.
Immunofluorescence microscopy
Glass coverslips were primed for immunofluorescence assays by incubating with 0.1 mg/mL PHAE (erythroagglutinating phytohemagglutinin, Sigma Aldrich) for 15–30 min in a humid chamber at 37°C [ 43 ]. Parasites were harvested by centrifugation at 2,000 x g for 2 min, washed in 1x PBS and placed onto the PHAE coated coverslip and incubated at room temperature for 15 min. Washing of samples with 1x PBS was carried out between each step of the following protocol. Cells were incubated on the slides and then fixed in a solution of 4% v/v paraformaldehyde and 0.0065% v/v glutaraldehyde. Parasite permeabilization was carried out using 0.1% Triton X-100. Immobilized cells were stained with primary antibodies for 1 h at room temperature (RT) (anti-PhIL1 rabbit (1:500), anti-HA rat (1:250, Sigma Aldrich) anti-HA mouse (1:250, Sigma Aldrich), anti-GAP45 rabbit (1:1000, [ 44 ]) anti-GFP mouse (1:500, Roche) anti-β-tubulin mouse (1:500, Sigma Aldrich), anti-Pfs16 mouse (1:1000, [ 12 ]). The secondary antibody was added for 1 h at RT (goat anti-mouse Alexa Fluor 488, 568, 647; anti-rabbit 488, 568, 647; anti-rat 647, were used at 1:250). Parasite nuclei were stained with DAPI (2 μg/mL) for 10 min at room temperature. The slides were mounted in p -phenylenediamine antifade and kept at 4°C. Samples were imaged on a DeltaVision Elite Restorative Widefield Deconvolution Imaging System (GE Healthcare) using the 100x UPLS Apo (1.4NA) objective lens under oil immersion. Samples were excited with solid state illumination (Insight SSI, Lumencor). The following filter sets with excitation and emission wavelengths were used: DAPI Ex390/18, Em435/48; FITC, Ex475/28, Em523/26; TRITC, Ex542/27, Em594/45; Cy5 Ex 632/22, 676/34 nm. For higher resolution imaging via 3D Structured Illumination microscopy (3D-SIM), the DeltaVision OMX V4 Blaze was used (GE Healthcare). Samples were excited using 488, 568 or 642 nm lasers and imaged using band pass filters at 528/48, 609/37 and 683/40 nm with a 60X Olympus Plan APO N (1.42 NA) oil immersion lens. Images were processed using the Fiji ImageJ software [ 45 ]. Solubility studies For the solubility assay, a culture enriched in gametocytes from stage III to stage V was magnet purified. Gametocytes were lysed in 0.03% saponin and the pellet fractions incubated with 0.1 M sodium carbonate, pH 11 (4°C) or in 8 M urea (RT) or 1% Triton X-100 in PBS, pH 7.4 (4°C) or in 2% SDS (RT) for 30 min. The soluble supernatant and the insoluble pellet were collected and taken up in 1x SDS loading buffer. Proteins fractions were analysed by immunoblotting. Immunoblotting For SDS-PAGE, protein samples were prepared by lysis with 0.03% saponin for 25 min on ice. Protein samples were separated on 4–12% Bolt Bis-Tris gels (Invitrogen) and transferred to 0.2 μm nitrocellulose membrane using the iBlot system (Invitrogen). The nitrocellulose membrane was blocked in 3.5% skim milk/1xPBS for 1 h at RT prior to antibody probing. Primary and secondary antibodies were prepared in 3.5% skim milk and incubated with the membranes for 1 h at RT. The membranes were washed with 1x PBS/0.05% Tween20 after the primary and secondary antibody incubations. The following primary antibodies were used in this study: anti-PhIL1 pre/post-immune (1:500), anti-HA mouse (1:500, Sigma Aldrich), anti-ERC (1:1000), anti-GAP45 (1:1000, [ 44 ]), anti-GAP50 (1:500, [ 44 ], anti-GFP, 1:500, Roche)). Horseradish peroxidase conjugated anti-mouse or anti-rabbit antibodies were used (1:25,000, Millipore). The washed immunoblots were incubated with enhanced chemiluminescent (ECL) reagents before being imaged using the FujiFilm LAS3000 digital imaging system (GE Healthcare). Electron microscopy-high pressure freezing/Freeze substitution Gametocytes were fixed using 2% paraformaldehyde and 0.1% glutaraldehyde. Cells were mounted to membrane carriers (Leica Microsystems) with a cell depth of 200 μm. The cells were then rapidly frozen by liquid nitrogen jet under 2100 bar pressure in a high pressure freezer (EM PACT2, Leica Microsystems) and quickly transferred to liquid nitrogen. A quick freeze substitution method was used (McDonald and Webb, 2011). The samples were transferred to cryotubes containing fixative: 1% osmium tetroxide, 0.5% uranyl acetate 5% water in acetone at liquid nitrogen temperature. The cryotubes were mounted on a cooled aluminum heat block in a polystyrene box filled with liquid nitrogen. To initiate the freeze substitution, the liquid nitrogen was replaced with dry ice pellets. The box was placed on a rotary shaker at 125 rpm. The dry ice was removed after 2 h and the shaking continued. After 1 h the cryotubes were removed from the block.
Transmission electron microscopy
The samples were washed three times with pure acetone after returning to RT. They were then infiltrated and embedded with EPON resin. Polymerization of the resin was carried out at 60°C before 60 nm sections were prepared with an ultramicrotome (Leica EM UC7, Leica Microsystems). The specimens were post-stained with 7% uranyl acetate in methanol and Reynold’s lead citrate. Samples were observed on Transmission Electron Microscope (TEM) at 200 kV (Tecnai G2 F30, FEI). Serial block face-scanning electron microscopy (SBF-SEM) The staining method (ROTO) was adapted from a previous publication [ 46 ]. Parasite pellets were fixed with 2.5% glutaraldehyde in PBS for 1 h at 4°C. Following agarose pre-embedding and washing with 0.175 M sodium cacodylate buffer, cells were stained in ferrocyanide-reduced osmium tetroxide in 0.1 M cacodylate buffer for 1 h on ice. After washing with double distilled H 2 O, the cells were incubated with freshly prepared 1% thiocarbonhydrazide solution in H 2 O for 20 min at RT. The cells were then rinsed and further stained with 2% osmium tetroxide in H 2 O for 30 min at RT. Subsequently the cells were rinsed and en-bloc stained with 1% uranyl acetate in H 2 O overnight at RT. In the final step of staining the specimens were rinsed and treated en-bloc with Walton’s lead aspartate for 30 min at 60°C [ 47 ]. Following the removal of lead aspartate and several washes, the cells were dehydrated in a graded series of ethanol-H 2 O mixes, followed by several washes in dry ethanol and dry acetone and then progressively infiltrated with EPON resin. After resin polymerization, a 200 x 200 x 200 μm resin block was trimmed off using the mesa trimming method [ 48 ] on an ultramicrotome (Leica EM UC7, Leica Microsystems). The resin block was mounted on a microtome stub and immobilized using silver glue. After the silver glue was completely dried, the resin block was coated with a layer of gold and the top surface was then cleansed by diamond knife. The serial images (every 50 nm) were collected by a serial block face-scanning electron microscope (SEM), which was equipped with an in-chamber diamond knife, (Teneo VolumeScope, FEI Company) using back scattered electron signals at 3 kV under low vacuum conditions.
SBF-SEM image analysis
Serial sections were optimized and aligned using IMOD software (Boulder Laboratory for 3D Electron Microscopy of Cells). The regions of interest were segmented and reconstructed into 3D models, using a semi-automatic method described previously [ 49 ]. Briefly, the pixel size of the greyscale images was binned to 20–50 nm, the images were subjected to Gaussian smoothing and a threshold value was selected manually from each reconstructed tomogram using a noise-estimate variance criterion, after marking some of the relevant cellular features, as described by others [ 50 ]. Connected regions were identified semi-automatically using connected component analysis [ 51 ]. Where required, a rough bounding area was drawn manually on every a few 2D sections. The regions were labeled with different colors, and 3D models were generated and rendered [ 52 ]. The volumes of the 3D models were determined for the organelles, while the parasite volume was determined after manual segmentation. For polarity assessment, the IMOD Slicer tool was used to orient slices at the maximum length or width of the cells and organelles and the relative distances from the ends were measured using open contours in IMOD. The correct positioning of the open contours was confirmed on 3D models.
Immunoprecipitation and mass spectrometry
Purified gametocytes were harvested and washed in 1xPBS for co-immunoprecipitation experiments. Parasites were solubilized using 1% TX-100/PBS (in 150 mM NaCl, 50 mM Tris, 2 mM EDTA) plus Complete protease inhibitors (Roche) on ice for 30 min, re-suspending every 10 min. Insoluble material was pelleted by centrifugation 16,000 x g for 10 min at 4°C. The supernatant was also re-pelleted to remove any residual insoluble material. The soluble fraction was incubated with 50 μL of Pierce protein A agarose beads (Pierce) for 30 min at 4°C to remove non-specific binding proteins. The resin was pelleted by centrifugation at 3,420 x g for 2 min and supernatant was incubated for 2 h with 25 μL GFP-Trap A (Chromotek) or anti-HA agarose (Sigma) depending on parasite cell line, at 4°C. After pelleting the resin at 3,420 g for 2 min, the beads were washed five times with 1% Triton X-100. Proteins were then either eluted using SDS and analysed via Western blotting or the beads were washed two times with 1 mM Tris and analysed via mass spectrometry. For mass spectrometry, proteins was eluted from beads with 5 μL trifluroethanol and 20 μL 0.1% formic acid (pH 2.5) and incubated at 50°C for 5 min. Beads were pelleted at 3,420 x g for 2 min and 20 μL of the supernatant collected. The sample was neutralized with the addition of 1 μL of 1 M tetraethylammonium bicarbonate. To reduce disulphide bonds, 0.2 μL of tris(2-carboxyethyl)phosphine (final concentration of 5 mM) was added to the supernatant and the solution was incubated at 70°C for 10 min. Proteins were digested with trypsin overnight at 37°C. Mass spectrometry was performed using a Thermo NanoLC/ OrbiTRAP ELITE ETD for GFP-Trap samples, and a Thermo NanoLC/ Q Exactive Plus for the anti-HA Agarose samples. Mass spectra were searched in MASCOT (Matrix Science) against a custom database comprised of P . falciparum (PlasmoDB) and H . sapiens (UniProt) non-redundant proteomes. Protein hits were considered significant if they were present in two biological replicates, had ≥2 significant peptide MS/MS spectra, and were at least 5 times enriched compared to the 3D7 or NF54 parental control. The mass spectrometry proteomics data have been deposited to the ProteomeXchange Consortium via the PRIDE [ 53 ] partner repository with the dataset identifier PXD007564.
Quantification and statistical analysis
All statistical analyses were performed using the Graph Pad Prism 5 software package. P values were calculated using an unpaired t-test, the mean values plus or minus the standard error are shown. This information is provided in the figure legends. The numbers of repeat experiments, internal replicates and cell numbers measured are noted in the figure legends.
Ethics statement Red Blood
Cells and serum was obtained from the Australian Red Cross blood service. All blood products were anonymous and individual donors could not be identified. This work was approved by the University of Melbourne Human Research Ethics Committee (Approval number 1135799).
Supporting information S1 Fig Quantitative analysis of cellular compartment dimensions. Related to Fig 1 . Length and width measurements for (A) parasite, (B) nucleus and (C) mitochondrion assessed from SBF-SEM data for stage II–V gametocytes. Data represent mean ± SEM. The Tables below the graphs show the number of cells assessed, mean values, standard deviations and the standard errors for each set of measurements. Unpaired t-test; * P
📊 Figures
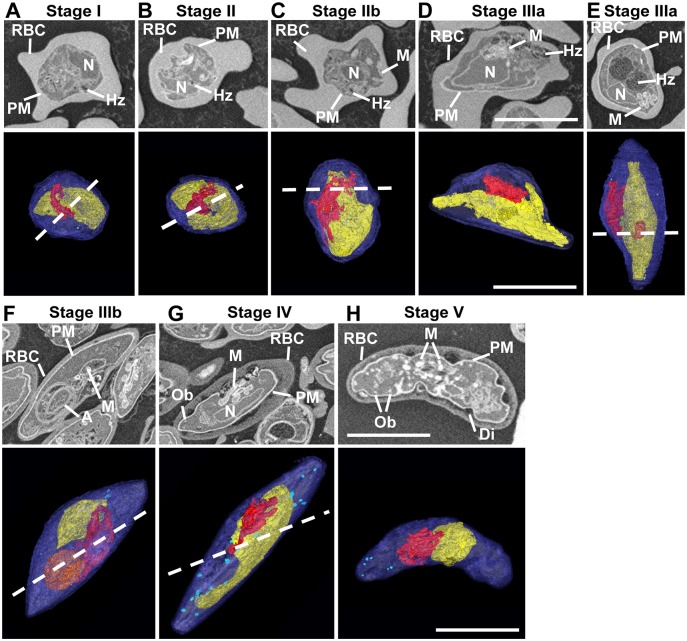
Fig 1
Whole cell reconstructions reveal organelle organization during gametocyte development.
(A-H) Individual SBF-SEM images of different stages (top rows), and rendered images of serial SBF-SEM sections (bottom rows). The following structures are labeled in the sections and color-coded in th...
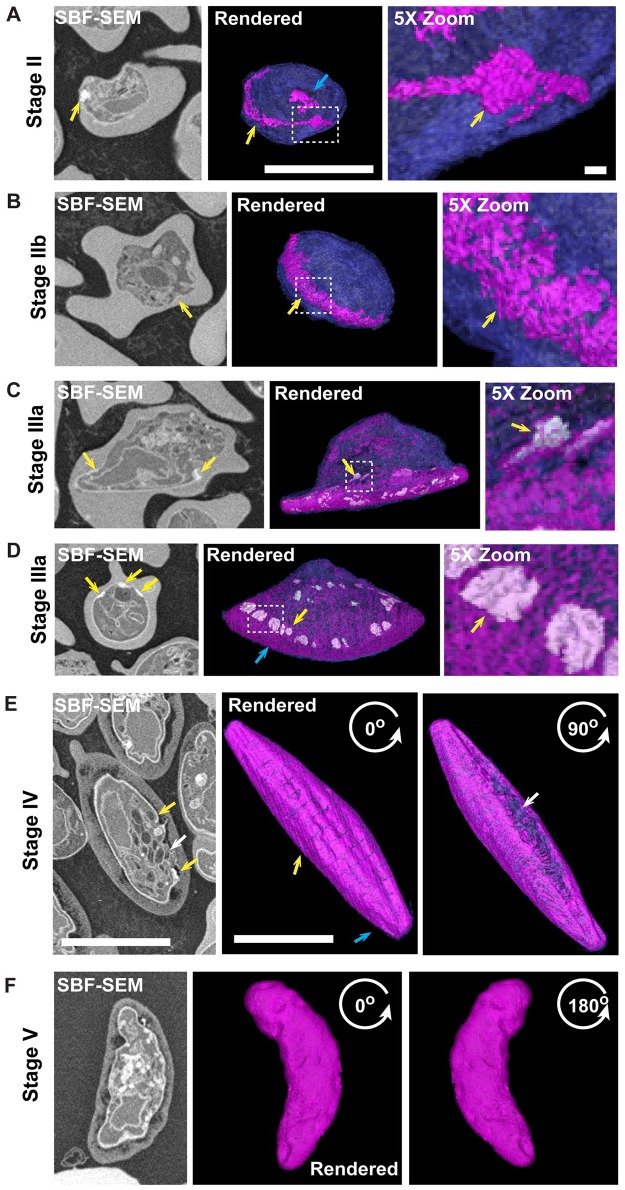
Fig 2
The IMC is expanded from the leading edge.
(A-F) SBF-SEM showing the organization and genesis of the IMC plates at the gametocyte periphery. Rendered models (right) and individual SBF-SEM sections (left) are shown. The IMC is identified as an ...
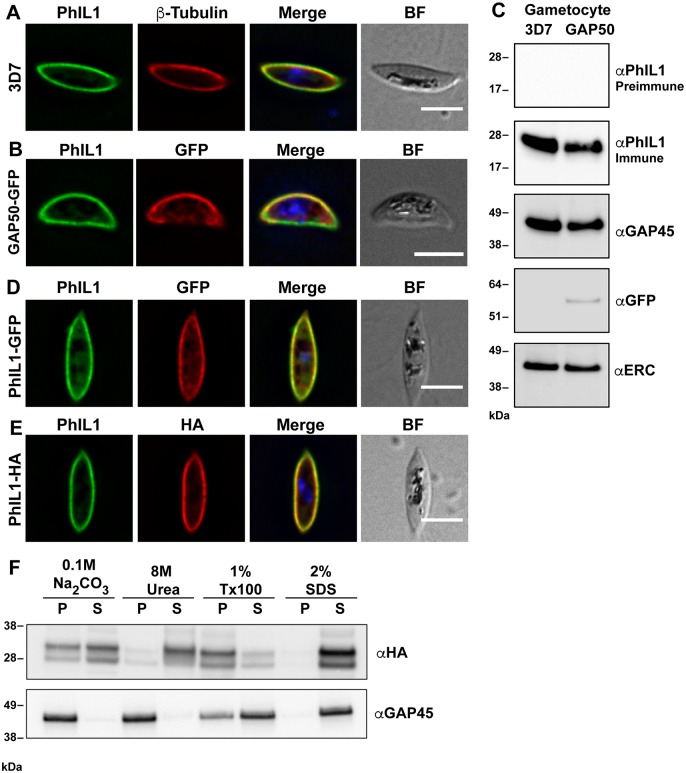
Fig 3
PhIL1 is located at the IMC in gametocytes.
(A) Immunofluorescence microscopy showing anti-PhIL1 (green) at the periphery of a 3D7 stage IV gametocyte, showing fluorescence close to the anti-u03b2-tubulin (red) labeling. (B) Immunofluorescence ...
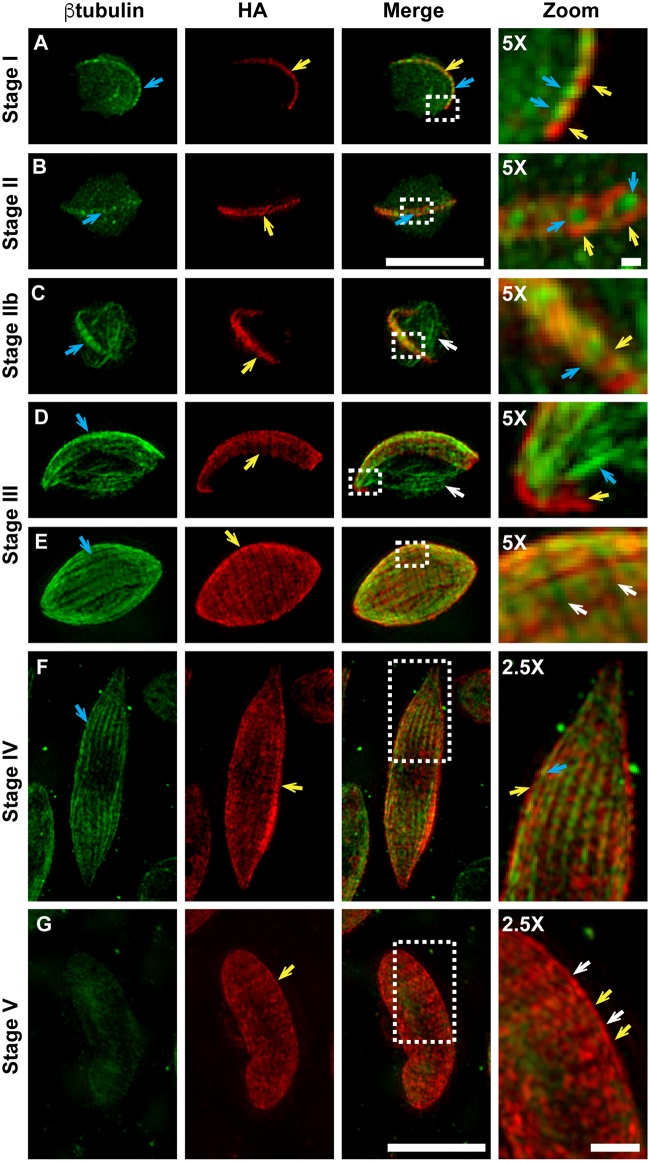
Fig 4
Genesis and development of the gametocyte IMC.
(A-G) 3D-SIM immunofluorescence microscopy reveals the location of PhIL1-HA (red) relative to u03b2-tubulin (green) for PhIL1-HA gametocytes from stage I-V of development. (A) A row of PhIL1-HA labele...
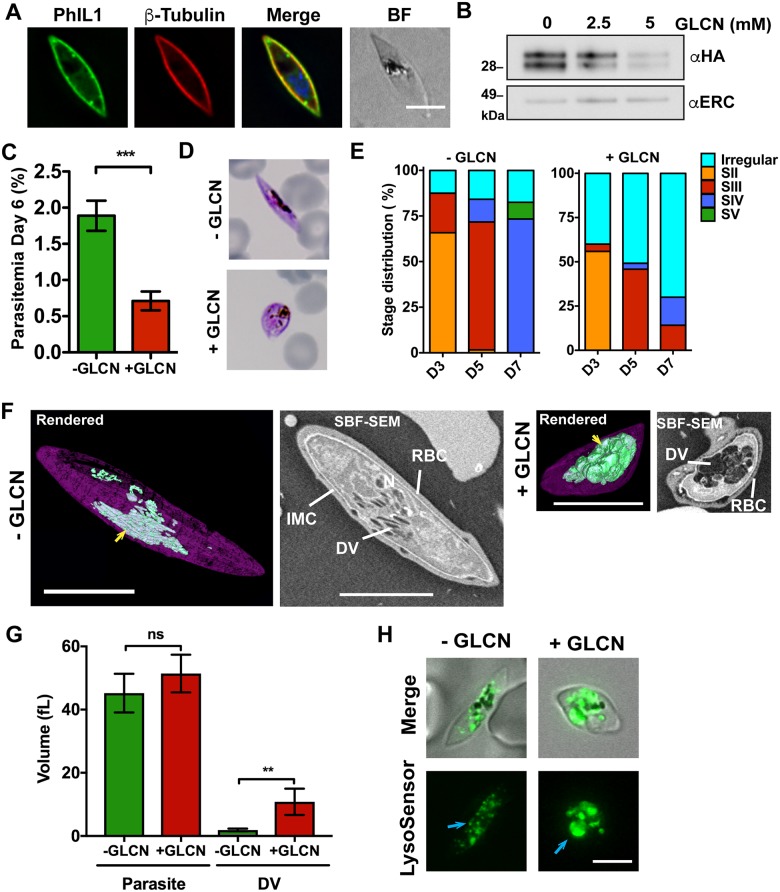
Fig 5
Knockdown of PhIL1 arrests gametocyte development.
(A) PhIL1-HA- glmS (green) is located at the parasite periphery, closely associated with u03b2-tubulin (red). (B) Stage IV PhIL1-HA- glmS gametocytes treated with a range of glucosamine concentrations...
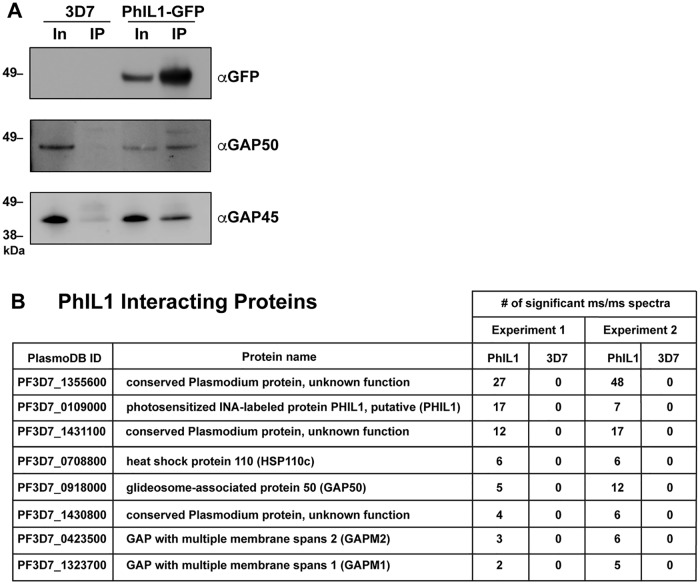
Fig 6
Identification of new IMC proteins in gametocytes.
(A) 3D7 parent and PhIL1-GFP transfectant gametocytes, purified at stage IV, were detergent-solubilized and proteins were immunoprecipitated using GFP-Trap. The input and precipitated eluates (IP) wer...
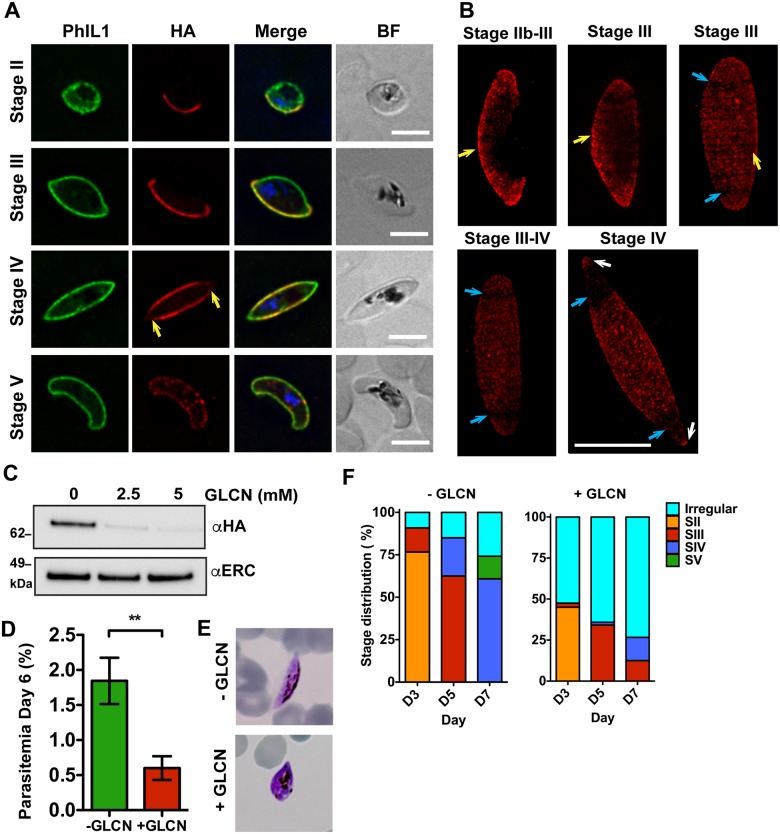
Fig 7
PhIL1-interacting protein, PIP1, is located at the gametocyte IMC and is essential for gametocyte development.
(A) PIP1-HA- glmS transfectants were labeled with anti-PhIL1 rabbit (green) and anti-HA (red) at different developmental stages (IIu2013V). Nuclei were labeled with DAPI. There is an apparent reductio...
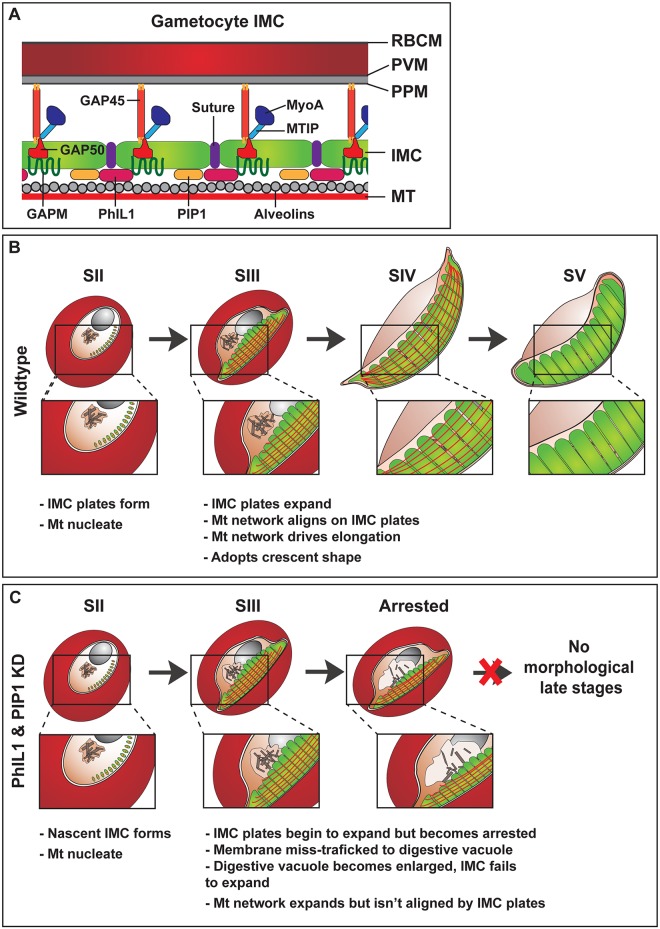
Fig 8
Model and schematic of the gametocyte IMC development.
(A) Schematic showing the proposed positioning of proteins in the gametocyte IMC. Red blood cell membrane (RBCM); Parasitophorous vacuole membrane (PVM); parasite plasma membrane (PPM); inner membrane...
Figure images are served from the NIH/NLM PubMed Central Open Access Subset or Europe PMC; copyright remains with the publishers and authors.
💬 Discussion
0 commentsNo comments yet. Be the first to start a discussion!
Leave a Comment