Abstract
A common goal of fluorescence microscopy is to collect data on specific biological events. Yet, the event-specific content that can be collected from a sample is limited, especially for rare or stochastic processes. This is due in part to photobleaching and phototoxicity, which constrain imaging speed and duration. We developed an event-driven acquisition framework, in which neural-network-based recognition of specific biological events triggers real-time control in an instant structured illumination microscope. Our setup adapts acquisitions on-the-fly by switching between a slow imaging rate while detecting the onset of events, and a fast imaging rate during their progression. Thus, we capture mitochondrial and bacterial divisions at imaging rates that match their dynamic timescales, while extending overall imaging durations. Because event-driven acquisition allows the microscope to respond specifically to complex biological events, it acquires data enriched in relevant content.
🔬 Techniques
💻 Software
✨ Fluorophores
🧪 Sample Preparation
🔬 Cell Lines
🏭 Microscope Brands
🧪 Reagent Suppliers
📷 Detectors
💻 Software Details
💾 Data Repositories
🏛️ Research Organizations (ROR)
Affiliated research institutions:
📋 Methods
Sample preparation Cos-7 cells for mitochondrial imaging
African green monkey kidney (Cos-7) cells were obtained from HPA culture collections (COS7-ECACC-87021302) and were cultured in Dulbecco’s modified Eagle medium (DMEM, ThermoFisher Scientific, 31966021) supplemented with 10% fetal bovine serum (FBS) at 37°C and 5% CO 2 . For imaging, cells were plated on 25 mm, #1.5 glass coverslips (Menzel) 16-24 h prior to transfection at a confluency of ~1×10 5 cells per well. Lipofectamine 2000 (ThermoFisher Scientific, 11668030) was used for dual transfections of Cox8-TagRFP and Emerald-DRP1. Transfections were performed 16-24 h before imaging, using 150 ng of plasmid and 1.5 μl of Lipofectamine 2000 per 100 μl Opti-MEM (ThermoFisher Scientific, 31985062). Imaging was performed at 37°C in pre-warmed Leibovitz medium (ThermoFisher Scientific, 21083027). Caulobacter crescentus cells for bacterial imaging Liquid C . crescentus cultures were grown overnight at 30 °C in 3 ml of 2x PYE 1 (Peptone, Merck, #82303; Yeast Extract, Merck, #Y1626) medium under mechanical agitation (200 rpm). Liquid cultures were re-inoculated into fresh 2x PYE medium to grow cells until log-phase (OD 660 =0.2-0.4). Antibiotics (5 μg ml −1 kanamycin and 1 μg ml −1 gentamicin) were added in liquid cultures for selecting cells containing fluorescent protein fusions. To induce the expression of FtsZ-sfGFP and mScarlet-I under the P xyl and P van promoter respectively, 0.5mM of vanillate and 0.2% weight/volume xylose were added to the culture 2 hours before imaging or synchronization 2 . C . crescentus cell cultures were spotted onto a 2x PYE agarose pad for imaging. To make the agarose pad, a gasket (Invitrogen™, Secure-Seal ™ Spacer, S24736) was placed on a rectangular glass slide, and filled with 1.5% 2x PYE agarose (Invitrogen™, UltraPure™ Agarose, 16500100) containing 0.5mM of vanillate and 0.2% of xylose. No antibiotics were added. Another glass slide was placed on the top of the silicone gasket, and the sandwich-like pad was placed at 4 °C until the agarose solidified. After 20 min, the top cover slide was removed, and a 1-2 μl drop of cell suspension was placed on the pad. After full absorption of the droplet, the pad was sealed with a plasma-cleaned #1.5 round coverslip of a diameter of 25mm (Menzel). For imaging the synchronized cells, a 1x PYE agarose pad was used to let cells grow slower. iSIM imaging Imaging was performed on a custom built instant structured illumination microscope (iSIM), previously described in detail 3 . Emerald/sfGFP and TagRFP/mScarlet-I fluorescence was excited using 488 and 561 nm lasers respectively. A system of microlens and pinhole arrays together with a galvo actuated mirror allows for instant super-resolution imaging on the camera chip (Photometrics Prime95B sCMOS). The implementation of a mfFIFI setup allows for homogeneous excitation over the full field of view 3 .
Show full methods section
Sample preparation Cos-7 cells for mitochondrial imaging
African green monkey kidney (Cos-7) cells were obtained from HPA culture collections (COS7-ECACC-87021302) and were cultured in Dulbecco’s modified Eagle medium (DMEM, ThermoFisher Scientific, 31966021) supplemented with 10% fetal bovine serum (FBS) at 37°C and 5% CO 2 . For imaging, cells were plated on 25 mm, #1.5 glass coverslips (Menzel) 16-24 h prior to transfection at a confluency of ~1×10 5 cells per well. Lipofectamine 2000 (ThermoFisher Scientific, 11668030) was used for dual transfections of Cox8-TagRFP and Emerald-DRP1. Transfections were performed 16-24 h before imaging, using 150 ng of plasmid and 1.5 μl of Lipofectamine 2000 per 100 μl Opti-MEM (ThermoFisher Scientific, 31985062). Imaging was performed at 37°C in pre-warmed Leibovitz medium (ThermoFisher Scientific, 21083027). Caulobacter crescentus cells for bacterial imaging Liquid C . crescentus cultures were grown overnight at 30 °C in 3 ml of 2x PYE 1 (Peptone, Merck, #82303; Yeast Extract, Merck, #Y1626) medium under mechanical agitation (200 rpm). Liquid cultures were re-inoculated into fresh 2x PYE medium to grow cells until log-phase (OD 660 =0.2-0.4). Antibiotics (5 μg ml −1 kanamycin and 1 μg ml −1 gentamicin) were added in liquid cultures for selecting cells containing fluorescent protein fusions. To induce the expression of FtsZ-sfGFP and mScarlet-I under the P xyl and P van promoter respectively, 0.5mM of vanillate and 0.2% weight/volume xylose were added to the culture 2 hours before imaging or synchronization 2 . C . crescentus cell cultures were spotted onto a 2x PYE agarose pad for imaging. To make the agarose pad, a gasket (Invitrogen™, Secure-Seal ™ Spacer, S24736) was placed on a rectangular glass slide, and filled with 1.5% 2x PYE agarose (Invitrogen™, UltraPure™ Agarose, 16500100) containing 0.5mM of vanillate and 0.2% of xylose. No antibiotics were added. Another glass slide was placed on the top of the silicone gasket, and the sandwich-like pad was placed at 4 °C until the agarose solidified. After 20 min, the top cover slide was removed, and a 1-2 μl drop of cell suspension was placed on the pad. After full absorption of the droplet, the pad was sealed with a plasma-cleaned #1.5 round coverslip of a diameter of 25mm (Menzel). For imaging the synchronized cells, a 1x PYE agarose pad was used to let cells grow slower. iSIM imaging Imaging was performed on a custom built instant structured illumination microscope (iSIM), previously described in detail 3 . Emerald/sfGFP and TagRFP/mScarlet-I fluorescence was excited using 488 and 561 nm lasers respectively. A system of microlens and pinhole arrays together with a galvo actuated mirror allows for instant super-resolution imaging on the camera chip (Photometrics Prime95B sCMOS). The implementation of a mfFIFI setup allows for homogeneous excitation over the full field of view 3 .
Event detection Construction of input and output datasets
Detection of potential division events was performed using a neural network with U-net architecture 4 . An input dataset was constructed using 3700 dual-color images labeling mitochondria and DRP1, 1000 of which contain states close to division. This dataset was enhanced 10-fold by rotating the images, to make up the final dataset (37000 images). This data set was recorded on a fast dual-color SIM setup at Janelia Research Campus 5 and published previously 6 , but processed via Gaussian filtering to imitate the expected resolution of raw iSIM data before deconvolution. The output ground truth dataset was generated from the fluorescence channels, followed by manual curation. Briefly, to identify division sites in the presence of a molecular marker, we identified constriction sites by looking for local saddle points. Saddle points are characterized by opposing principal curvatures, or eigenvalues of the local Hessian matrix. The product of the principal curvatures, or the Gaussian curvature, will therefore be negative - as will be reflected by the determinant of the local Hessian matrix. Therefore, computing the Hessian matrix for both the mitochondrial and the DRP1 channel highlights saddle-points in the mitochondrial channel overlapping with high-intensity DRP1 spots. (1) G T = max − ( ( H m i t o , 1 × H m i t o , 2 ) × ( H D R P 1 , 1 × H D R P 1 , 2 ) × I D R P 1 , 0 ) where H channel,i represents the largest or smallest eigenvalue of the Hessian matrix for i = 1, 2 respectively, I channel represents the raw fluorescence channel and × element-wise multiplication. The final GT matrix is normalized so that the full range is rescaled to 0-255 to make 8-bit heat-maps, with higher values representing more likely constriction sites. Since mitochondrial division sites represent a large fraction, but not all events with DRP1 overlapping with mitochondrial saddle points, the processed frames were then curated manually to increase accuracy for real constriction events by visually removing false positives or ensuring consistent detection of active constriction sites. False positives most frequently corresponded to close mitochondrial contacts with nearby DRP1 bound to the outer membrane (but not constricting), very bright DRP1 spots and mitochondria with bi-concave disk-like shapes where thinning of the mitochondrion gets mistaken for a constriction site. False negatives were most often due to very late stages of fission or moments after fission as well as the onset of constriction which is nuanced and develops progressively. This ensured that the event detection network was able to discriminate events of interest with high accuracy. The dataset was then split 80:20 into training (29600 images) and testing (7400 images) datasets.
Network architecture and training
The network was trained on 29600 dual-color images (128x128x2) of mitochondria and DRP1 as input, and using the ground-truth images (128x128) marking the respective locations of divisions as output ( Supplementary Note 3 ). We used pixel-wise mean-squared error as loss function, and trained the model using the Adam optimizer for 20 epochs with a batch size of 256. As neural network architecture we used a U-Net 4 of depth 2 and kernelsize 7x7, with the number of initial feature channels set to 16 that were doubled after every pooling layer. Training was performed using tensorflow/keras and python 3.9. 7 .
Assessment of network prediction accuracy
To assess the accuracy of the network, individual event scores were first isolated from the heat maps using an intensity threshold of 80, since weak predictions and weak ground truth signals represent a low relative event probability and as such, will not contribute to the decision making step of the acquisition. Then, instead of counting discrete events, each event was weighed by its ground truth or predicted intensity: true positives were weighed by normalized ground truth intensity (representing what was the true value of the event that was detected), false positives were weighed by normalized predicted intensity (representing how wrong the prediction was, given no event was present) and false negatives were weighed by normalized ground truth intensity (representing the cost of missing the ground truth event). This way the strength of the prediction and true underlying signal is taken into account when evaluating the performance of the network. The total score for true positives was then divided by the sum of total true positives (false positives and false negatives) to produce an accuracy metric. With this, the network reaches an accuracy of 86.7% when tested on test data, that was not used during training, with 5.4% false positives and 7.9% false negatives. The output of inference is a two dimensional map of relative division probabilities in the range 0 to 255. Inspecting false positives shows that events that most frequently contributed to false positives were close mitochondrial contacts with nearby DRP1 bound to the outer membrane (but not constricting), very bright DRP1 spots and mitochondria with bi-concave-disk-like shapes where thinning of the mitochondrion gets mistaken for a constriction site. False negatives were most often due to very late stages of fission or moments after fission as well as the onset of constriction which is nuanced and develops progressively. Event-driven acquisition for adaptive temporal sampling The different parts of the EDA framework were implemented in separated modules that allowed for continuous and independent testing of the components. Data handling The EDA framework is distributed over Micro-Manager 8 for general microscope handling, and Matlab (MathWorks) for the control of the timing of the microscope components and Python for network inference. Furthermore, the Python module was used on a machine in the network due to hardware restrictions on the local computer used for microscope control. A network attached storage (NAS) unit was used to allow for communication of the different components of the system over the local 10 Gbit network. Recorded frames were stored as single .tif files to the NAS by Micro-Manager. A server implemented using the watchdog module (Python) on the remote machine detected new files for inference. After calculation of the decision parameter, the value was saved to a binary file that was used by Matlab to calculate the values for the next sequence of imaging. Event Server When a new file for each channel respectively was detected on the NAS, the event server implemented in Python running on a remote machine first performed data preparation on the recorded frames. The frames were resized by a factor of 0.7 to match the pixel size of the training data. Both frames were smoothed using a Gaussian with σ 1.5 px with an additional background subtraction in the DRP1 channel (Gaussian with σ 7.5 px). The frames were tiled into overlapping 128x128 px sized tiles to match the size of the training data. The individual tiles of the structure (mitochondria/ C . crescentus ) channel were again normalized individually. Inference was performed on pairs of structure/foci tiles and the output was stitched together. The maximum value from the stitched frame was recorded as the highest relative probability in the frame for a division event and saved to the binary file on the NAS. Hardware control The timing of the microscope hardware is controlled using a PCI 6733 analog output device (National Instruments). The device is used in background mode requesting data when the existing sequence buffer has 1 s remaining. For mitochondria imaging, the slow mode sends a sequence containing one frame over five seconds (0.2 Hz) and a sequence containing five frames in one second (5 Hz) in the fast mode. For bacterial imaging, sequences with one frame over 3/9 or 2/12 minutes is provided for slow/fast and normal or synchronized colonies respectively. The parameters are chosen depending on which value was read from the binary file on the NAS that contains the latest event information written by the event server. In addition to a threshold, a hysteresis band is implemented here by defining an upper and a lower threshold. Fast acquisition starts at surpassing the upper threshold and is only stopped when the event score falls below the lower threshold. For C . crescentus imaging, the number of fast frames was further set to a minimum of three. Due to the fast imaging rates in the mitochondria imaging, the new sequence is calculated before the event server has calculated the relative probability map for the last frames, leading to a delay in the reaction of the EDA framework. This is overcome for the C . crescentus imaging by delaying the calculation of the new sequences by 10 seconds allowing for mode switching on the newest data available.
Data Analysis
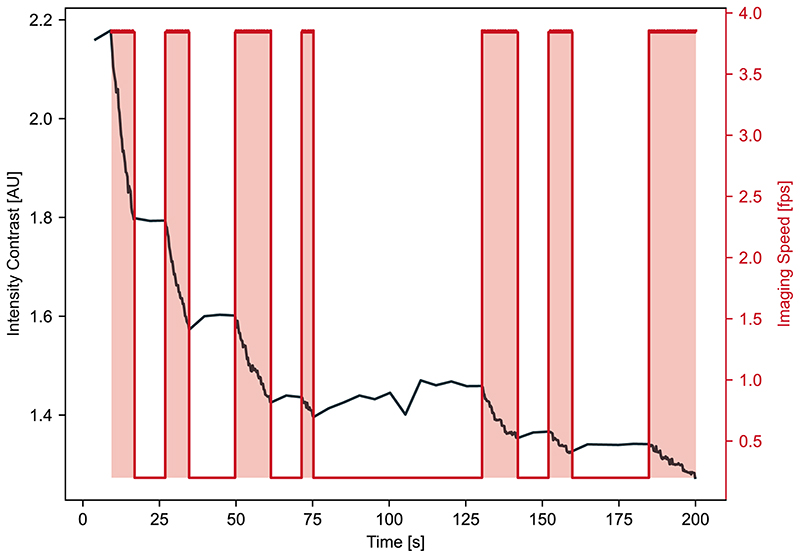
Statistical significance of differences in averages reported by asterisks was calculated using the the independent two-sample t-test for minimal constriction widths ( Figures 3 & 4 ) and the Welch’s t-test for event scores ( Suppl. Note 3 ) and number of events ( Figure 3 ). Equality of variances in the data sets to decide between the two was tested for by the Levene test. All implementations were used as provided by the scipy.stats Python package. Photobleaching Decay The different photobleaching kinetics of the modes were characterized by the intensity contrast of the samples. The channel of the structural feature (mitochondria and caulobacter outline) was segmented using a Otsu-thresholding method after a median and Gaussian filter were applied (kernel size of 5 px each). The intensity contrast was then calculated as the mean intensity in the segmented region divided by the mean intensity in the rest of the image. Variation in the starting contrast between series was accounted for by normalization of the starting intensity contrast values. The decay constant was then obtained by fitting an exponential decay function ( y = a exp (− bx ) + c ) to the intensity contrast over time data and extracting the b term. The reported imaging time ratios were calculated from the times from start of imaging to 90% of intensity contrast for each series. Cumulative Light Dose The cumulative light dose over time was taken to be proportional to the number of previously recorded frames. This is appropriate here, since the iSIM has a constant scan speed, and we did not modulate the laser intensity. Therefore, each sample received a fixed light dose per frame. Experiments were truncated after a user-defined minimum intensity contrast (SNR) was reached (1.1 for mitochondria and 1.02 for C . crescentus) .
EDA Event Evaluation
The number of frames per event was calculated by counting the number of frames recorded for a fixed time after EDA triggered fast imaging or would have triggered fast imaging in slow mode. Events of interest were defined by a minimum value of the neural network output of 80 (90 for C . crescentus ). Frames were analyzed until a maximal observation time of 20 seconds (1 hour for C . crescentus ) was reached. Constriction Width The slow and EDA imaging modes were compared by calculating the minimal width of constriction measured during an event as described above. The measurement method was similar to that described in 6 . The deconvolution of the images was performed using the Richardson Lucy algorithm as implemented by the flowdec Python package with 30 iterations 9 . Segmentation, skeletonization and spline fitting the resulting points led to a backbone of the mitochondrion in a frame of 20 x 20 pixels around the position of the detected event. 100 perpendicular lines were generated around the closest point of the backbone to the event position. The intensity profile along those lines was fitted using a Gaussian profile. The full width at half maximum (FWHM) of the Gaussian profile with the smallest σ was recorded as the measured width for the frame. The minimal width measured for an event was calculated as the minimal FWHM over the observation time times the pixel size of the iSIM setup (56nm).
Supplementary Material Extended Data Figure 2 Source Data Extended Data Figure 4 Source Data Extended Data Figure Captions Figure 2 Source Data Figure 3 Source Data Figure 4 Source Data Supplementary Information Supplementary Video 1.0 Supplementary Video 1.1 Supplementary Video 2.0 Supplementary Video 2.1 Supplementary Video 3.0 Supplementary Video 3.1 Supplementary Video 4.1 Supplementary Video 4.0
📊 Figures
Extended Data Fig. 1
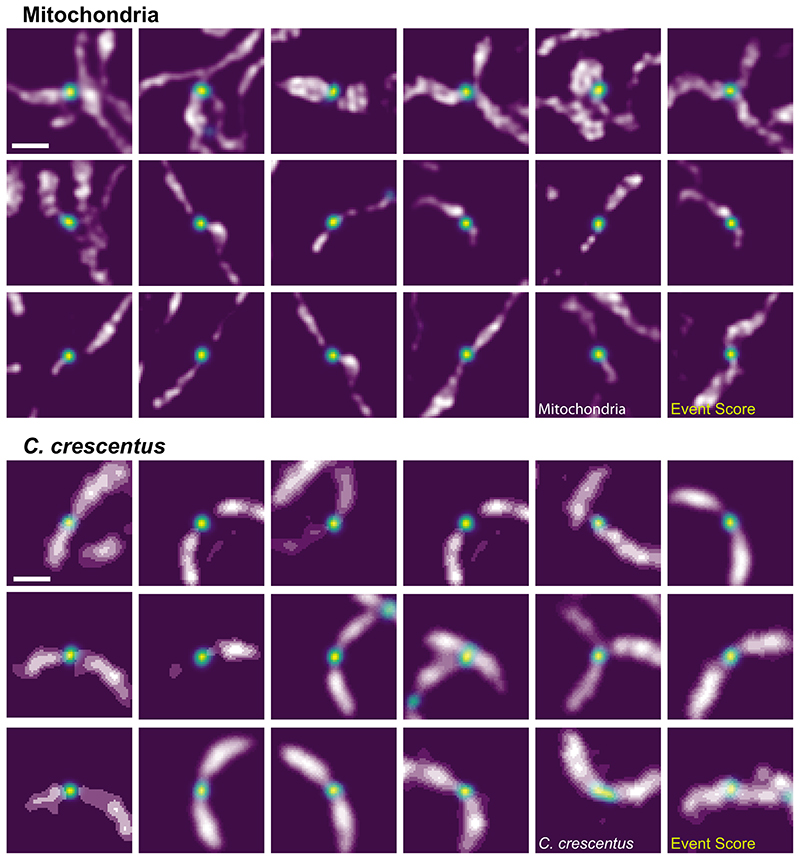
Example maximum event score regions which triggered EDA.
The event score output by the neural network can also be used to extract events of high interest from the datasets, after the acquisition is complete. Here, events that triggered EDA in different data...
Extended Data Fig. 2
Bleaching behavior of a mitochondria sample during EDA imaging.
The different modes of imaging can clearly be seen in the bleaching curve represented by the signal-to-noise ratio calculated from the intensity inside the mitochondria compared to the signal outside ...
Extended Data Fig. 3
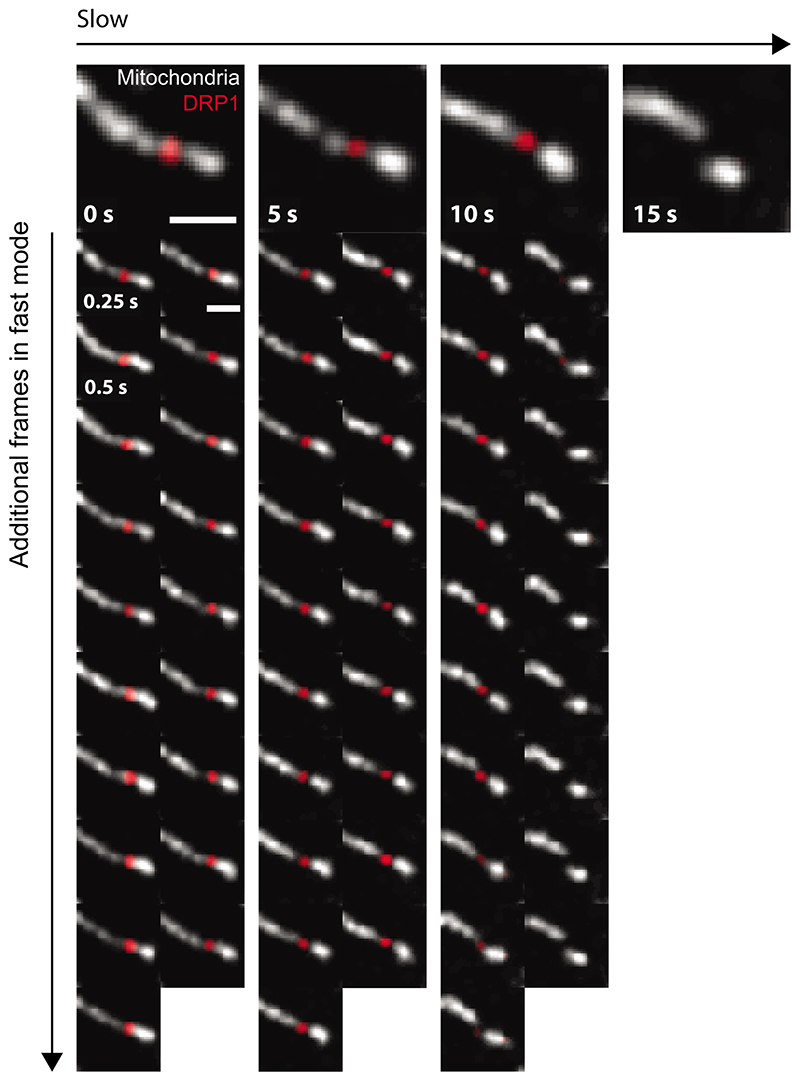
EDA delivers additional frames during events of interest.
Top row: mitochondrial division as it would have been recorded with the slow fixed imaging rate without EDA. Vertical frames: additional frames captured thanks to EDA switching to the fast imaging spe...
Extended Data Fig. 4
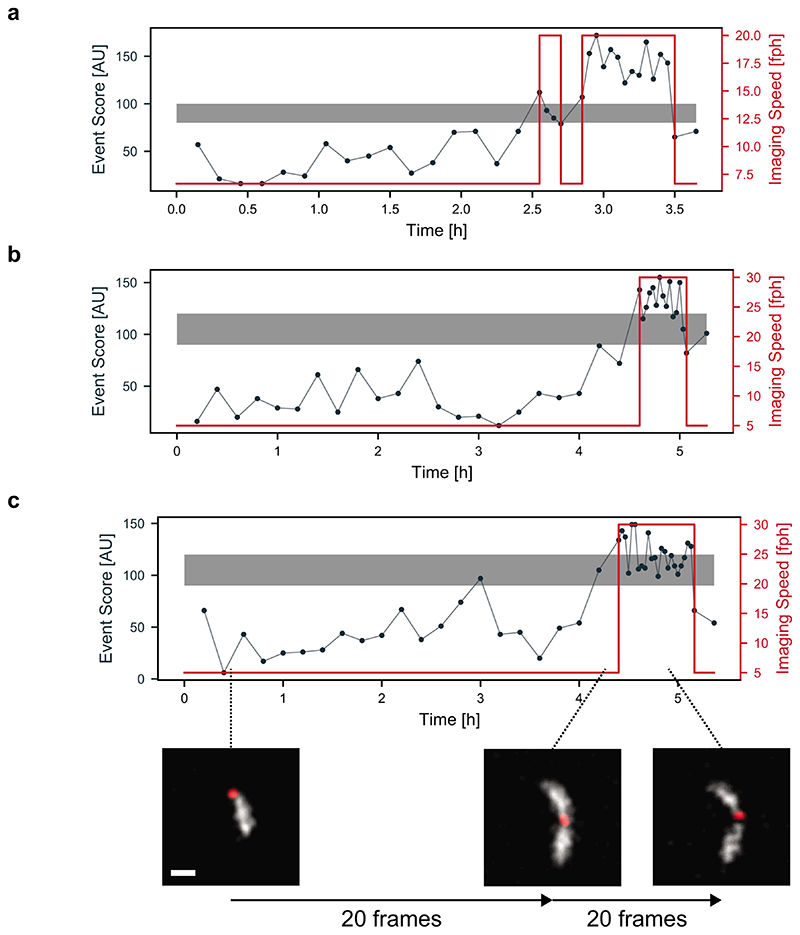
EDA imaging of synchronized bacteria populations.
C. crescentus , the strain used in this study, were synchronized via density centrifugation to obtain a population of cells that are all at the beginning of their cell cycle (G0, swarmer). This leads ...
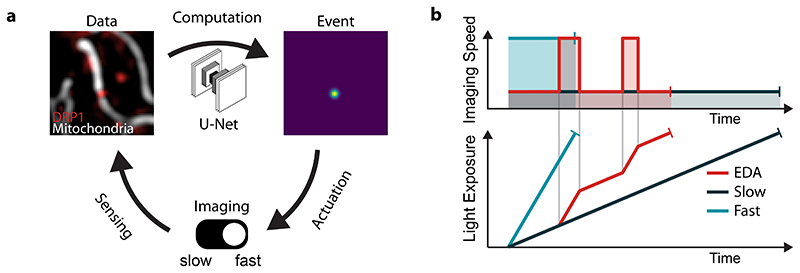
Figure 1
Event driven acquisition (EDA) concept.
a, The feedback control loop for EDA is composed of three main parts: 1) sensing by image capture to gather data, 2) computation by a neural network to detect events of interest and generate a heat ma...
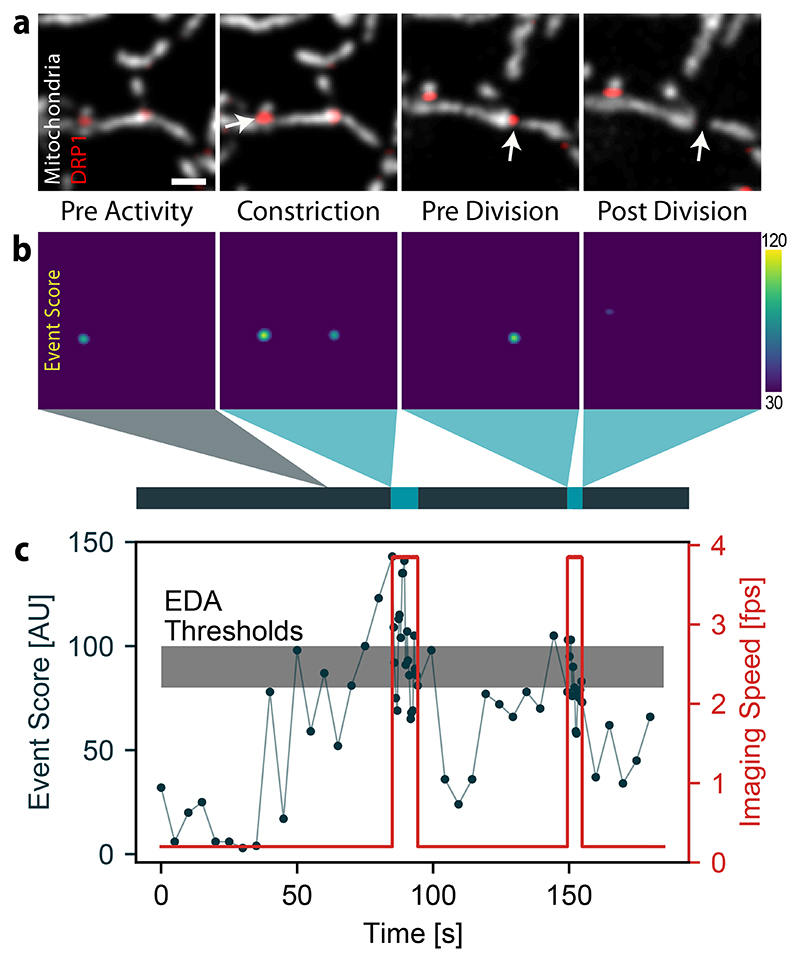
Figure 2
Event recognition of mitochondrial divisions during an iSIM acquisition.
a, Images of a COS-7 cell expressing mitochondrion-targeted Mito-TagRFP and Emerald-DRP1, including those containing events of interest (white arrow) that triggered a change in the imaging speed. (Sca...
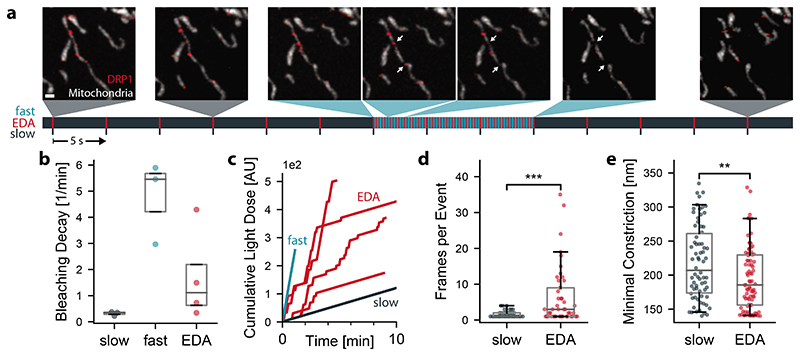
Figure 3
EDA versus fixed-rate imaging of mitochondrial divisions.
a, Mitochondrial dynamics (TagRFP-Mito, grey; Emerald-DRP1, red) captured by EDA (Scale bar: 1 u03bcm, time first frame to last frame: 114 s). Below, measurement timeline indicating the approximate ca...
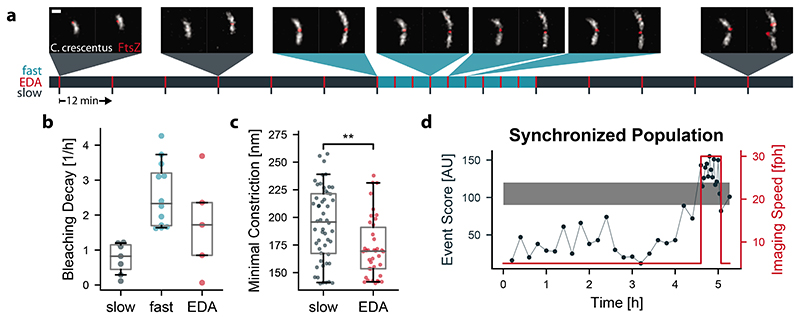
Figure 4
EDA versus fixed-rate imaging of bacterial divisions.
a, Representative images of C . crescentus (cytosolic mScarlet-I in grey and FtsZ-sfGFP in red) division events captured at different imaging speeds using an event-driven acquisition (Scale bar: 1 u03...
Figure images are served from the NIH/NLM PubMed Central Open Access Subset or Europe PMC; copyright remains with the publishers and authors.
💬 Discussion
0 commentsNo comments yet. Be the first to start a discussion!
Leave a Comment