Abstract
Exosomes are of increasing interest as alternative mode of cell-to-cell communication. We previously reported that exosomes secreted by human SOJ-6 pancreatic tumor cells induce (glyco)protein ligand-independent cell death and inhibit Notch-1 pathway, this latter being particularly active during carcinogenesis and in cancer stem cells. Therefore, we asked whether exosomal lipids were key-elements for cell death and hypothesized that cholesterol-rich membrane microdomains were privileged sites of exosome interactions with tumor cells. To address these questions and based on the lipid composition of exosomes from SOJ-6 cells (Ristorcelli et al. (2008) FASEB J. 22; 3358-3369) enriched in cholesterol and sphingomyelin (lipids forming liquid-ordered phase, Lo) and depleted in phospholipids (lipids forming liquid-disordered phase, Ld), we designed Synthetic Exosome-Like Nanoparticles (SELN) with ratios Lo/Ld from 3.0 to 6.0 framing that of SOJ-6 cell exosomes. SELN decreased tumor cell survival, the higher the Lo/Ld ratio, the lower the cell survival. This decreased survival was due to activation of cell death with inhibition of Notch pathway. FRET analyses indicated fusions/exchanges of SELN with cell membranes. Fluorescent SELN co-localized with the ganglioside GM1 then with Rab5A, markers of lipid microdomains and of early endosomes, respectively. These interactions occurred at lipid microdomains of plasma and/or endosome membranes where the Notch-1 pathway matures. We thus demonstrated a major role for lipids in interactions between SELN and tumor cells, and in the ensued cell death. To our knowledge this is the first report on such effects of lipidic nanoparticles on tumor cell behavior. This may have implications in tumor progression.
🔬 Techniques
🔭 Microscopes
💻 Software
✨ Fluorophores
🧪 Sample Preparation
🔬 Cell Lines
🏭 Microscope Brands
🧪 Reagent Suppliers
🔎 Objectives
💻 Software Details
🏛️ Research Organizations (ROR)
Affiliated research institutions:
📋 Methods
Materials Antibodies to Bax, peroxidase (POD)-labelled antibodies to rabbit immunoglobulins (IgG), antibodies to PTEN, to (Ser380)phospho-PTEN, to GSK-3β, to (Ser9)phospho GSK-3β, and antibodies to CHOP were from Cell Signaling (Beverly, MA). Antibodies to Hes-1 and ICN (activated intracytoplasmic Notch form) were from Abcam (Cambridge, UK). Antibodies to Rab5A and to Lamp-1 were kind gifts from Dr E. Ghigo (Urmite, Marseille, France). Antibody to Bcl-2 came from Dako (Glostrup, Denmark). Imipramine, desipramine, Sandoz-58035, calcium ionophore A23187, POD-labelled antibodies to mouse IgG, FITC-labelled antibodies to mouse IgM and antibodies to actin were from Sigma (St Louis, MO). Alexa-Fluor-labelled antibodies to mouse and to rabbit IgG were from Invitrogen (Illkirch, France). U18666A was from Calbiochem (La Jolla, CA). RPMI 1640, DMEM cell culture media, penicillin, streptomycin and trypsin-EDTA were from InVitrogen (Carlsbad, NM). Antibodies to Notch-1 extracellular domain used in confocal studies were from Neomarker (Fremont, CA). Caspase inhibitors were from Alexis (San Diego, CA). Antibodies to Notch-1 (extracellular domain), Notch-1 siRNA mix (sc-36095) and control (scramble) siRNA were from Santa Cruz Biotechnology (Santa Cruz, CA). Sphingosin-1-phosphate, sphingolipids and phospholipids were purchased from Avanti Polar Lipids Inc (Alabaster, AL) and all other lipids (pure grade) were from Sigma-Aldrich (St Quentin-Fallavier, France) unless stated otherwise. Cells lines (BxPc-3, MiaPaCa-2 and HEK 293T) used in this study came from the American Type Culture Collection (ATCC, Rockville, MD). SOJ-6 cells were a gift from Dr M-J. Escribano (INSERM UMR 911, Marseille, France) [46] . Cell Growth and Cell Survival Cell lines originating from human pancreatic (adeno)carcinoma were grown in either RPMI 1640 (SOJ-6 cells) or in DMEM (MiaPaCa-2 cells) medium with 10% fetal calf serum (FCS) at 8,000 cells/well unless otherwise stated were seeded in a 96-well culture plates. Cells were then deprived in FCS for 24 h and these quiescent cells were further treated with increasing amounts of effectors, in the absence of FCS. Cell survival was assessed by 3-(4,5-dimethythiazol-2-yl)-2,5-diphenyl (MTT) assay. All determinations were compared to those of cell controls without added effectors and taken as 100%. Results are given as mean ± SD. Gamma-secretase Inhibitor IC 50 Determination In order to obtain the concentration of γ-secretase inhibitor (GSI) necessary for 50% of inhibition of cell survival (IC 50 ), MiaPaCa-2 cells were grown in 96 wells plates (8 000 cells per well). Then cells were starved during 24 hours prior incubation with increased concentrations of GSI (0 up to 50 µM). Finally, 24 hours later MiaPaCa-2 cells were submitted to a MTT test. Synthetic Exosome-like Nanoparticles (SELN) Sphingomyelin (SM) solution constituted of 9 part of chicken egg SM and 1 part of bovine brain SM were saved in stock solution (1 mg/ml) in chloroform. Ceramide (Cer) was a mix of Cer 16∶0, Cer 24∶0 and Cer 24∶1 in chloroform (1∶1∶1 by weight, 1 mg/ml). All other lipids (1 mg/ml) were in chloroform solution. Lipid solutions were mixed to reach concentrations given in Table 1 . Mix were done to get ratio of total lipids forming ordered phase (Lo) over total lipids forming disordered phase, (Ld) from 3 to 6. [ 3 H]-cholesterol (Amersham, SA = 10 700 cpm/µg) was used as tracers to label SELN and to calibrate the used amounts of SELN with exosome quantities [11] , [12] . After mixing, the solvent (less than 300 µl) was dried overnight under air-stream and negative pressure. The lipid pellet was further dry under vacuum for at least 1 h to totally eliminate eventual trace of solvent. Lipids were then suspended in PBS (10 mM) pH 7.4 buffer, and sonicated (3 min, 20 W). After slow cooling to room temperature, SELN suspensions were filtered through out a 0.10 µm, 13 mm diameter filter (Durapore VVLP, Millipore, Molsheim, France) and immediately used. Fluorescent Labelling of SELN Fluorescent SELN were synthesized as above after incorporating 0.1–0.2% (total lipid weight) of fluorescent PE. Two probes were incorporated in SELN;1-oleoyl-2-(6-((7-nitro-2-1,3-benzoxadiazol-4-yl)amino(hexanoyl)-sn-glycero-3-phospho-ethanolamine ( N -NBD-PE) and 1,2-dioleoyl-sn-glycero-3-phosphoethanolamine-N-(lissamine-rhodamine sulfone) ( N -Rh-PE). Both fluorescent PE are from Avanti Polar Lipids (Alabaster, Al). The ratio N -NBD-PE/ N -Rh-PE of 5/1 to 5/2 allows fluorescence (or Föster) resonance energy transfer (FRET) and the monitoring of fusion/exchange of SELN with cell membrane. When SELN preparation containing both fluorescent probes is excited at 458 nm, emission at 530 and 585 nm are observed [22] . The latter peak characteristic of N -Rh-PE arises from fluorescence energy transfer after N -NBD-PE excitation at 458 nm. Fusion/exchange is accompanied by spectral changes that are a decrease in emission peak at 585 nm (Em585) and an increase in emission peak at 530 nm (Em530). Each change is indicative of a reduction in the efficiency of energy transfer between N -NBD-PE and N -Rh-PE consistent with fusion/exchange of fluorescent vesicles followed by lateral diffusion/exchange of fluorescent lipids in the plane of cell membrane. This process lowers the surface density of the energy acceptor N -Rh-PE and consequently decreases the efficiency of the energy transfer compared to starting fluorescent SELN. Under the used conditions when SELN are excited at 458 nm, essentially all the fluorescence at 530 nm comes from N -NBD-PE. Thus the % of efficiency energy transfer ( E(% )) which decreases upon fusion/exchange is defined by the relationship [22] E( %) = (1– (f/f 0 )) x100, where f is the fluorescence at 530 nm ( N -NBD-PE) and f 0 is the fluorescence at 530 nm in the presence of 1% Tween 20. This detergent destroys vesicle structure with the dilution of fluorochromes in a micellar system. Consequently energy transfer between fluorescent molecules is annihilated. Fluorescence spectra were recorded on a LS45 spectrofluorometer (Perkin Elmer, Courtaboeuf, France).
Show full methods section
Materials Antibodies to Bax, peroxidase (POD)-labelled antibodies to rabbit immunoglobulins (IgG), antibodies to PTEN, to (Ser380)phospho-PTEN, to GSK-3β, to (Ser9)phospho GSK-3β, and antibodies to CHOP were from Cell Signaling (Beverly, MA). Antibodies to Hes-1 and ICN (activated intracytoplasmic Notch form) were from Abcam (Cambridge, UK). Antibodies to Rab5A and to Lamp-1 were kind gifts from Dr E. Ghigo (Urmite, Marseille, France). Antibody to Bcl-2 came from Dako (Glostrup, Denmark). Imipramine, desipramine, Sandoz-58035, calcium ionophore A23187, POD-labelled antibodies to mouse IgG, FITC-labelled antibodies to mouse IgM and antibodies to actin were from Sigma (St Louis, MO). Alexa-Fluor-labelled antibodies to mouse and to rabbit IgG were from Invitrogen (Illkirch, France). U18666A was from Calbiochem (La Jolla, CA). RPMI 1640, DMEM cell culture media, penicillin, streptomycin and trypsin-EDTA were from InVitrogen (Carlsbad, NM). Antibodies to Notch-1 extracellular domain used in confocal studies were from Neomarker (Fremont, CA). Caspase inhibitors were from Alexis (San Diego, CA). Antibodies to Notch-1 (extracellular domain), Notch-1 siRNA mix (sc-36095) and control (scramble) siRNA were from Santa Cruz Biotechnology (Santa Cruz, CA). Sphingosin-1-phosphate, sphingolipids and phospholipids were purchased from Avanti Polar Lipids Inc (Alabaster, AL) and all other lipids (pure grade) were from Sigma-Aldrich (St Quentin-Fallavier, France) unless stated otherwise. Cells lines (BxPc-3, MiaPaCa-2 and HEK 293T) used in this study came from the American Type Culture Collection (ATCC, Rockville, MD). SOJ-6 cells were a gift from Dr M-J. Escribano (INSERM UMR 911, Marseille, France) [46] . Cell Growth and Cell Survival Cell lines originating from human pancreatic (adeno)carcinoma were grown in either RPMI 1640 (SOJ-6 cells) or in DMEM (MiaPaCa-2 cells) medium with 10% fetal calf serum (FCS) at 8,000 cells/well unless otherwise stated were seeded in a 96-well culture plates. Cells were then deprived in FCS for 24 h and these quiescent cells were further treated with increasing amounts of effectors, in the absence of FCS. Cell survival was assessed by 3-(4,5-dimethythiazol-2-yl)-2,5-diphenyl (MTT) assay. All determinations were compared to those of cell controls without added effectors and taken as 100%. Results are given as mean ± SD. Gamma-secretase Inhibitor IC 50 Determination In order to obtain the concentration of γ-secretase inhibitor (GSI) necessary for 50% of inhibition of cell survival (IC 50 ), MiaPaCa-2 cells were grown in 96 wells plates (8 000 cells per well). Then cells were starved during 24 hours prior incubation with increased concentrations of GSI (0 up to 50 µM). Finally, 24 hours later MiaPaCa-2 cells were submitted to a MTT test. Synthetic Exosome-like Nanoparticles (SELN) Sphingomyelin (SM) solution constituted of 9 part of chicken egg SM and 1 part of bovine brain SM were saved in stock solution (1 mg/ml) in chloroform. Ceramide (Cer) was a mix of Cer 16∶0, Cer 24∶0 and Cer 24∶1 in chloroform (1∶1∶1 by weight, 1 mg/ml). All other lipids (1 mg/ml) were in chloroform solution. Lipid solutions were mixed to reach concentrations given in Table 1 . Mix were done to get ratio of total lipids forming ordered phase (Lo) over total lipids forming disordered phase, (Ld) from 3 to 6. [ 3 H]-cholesterol (Amersham, SA = 10 700 cpm/µg) was used as tracers to label SELN and to calibrate the used amounts of SELN with exosome quantities [11] , [12] . After mixing, the solvent (less than 300 µl) was dried overnight under air-stream and negative pressure. The lipid pellet was further dry under vacuum for at least 1 h to totally eliminate eventual trace of solvent. Lipids were then suspended in PBS (10 mM) pH 7.4 buffer, and sonicated (3 min, 20 W). After slow cooling to room temperature, SELN suspensions were filtered through out a 0.10 µm, 13 mm diameter filter (Durapore VVLP, Millipore, Molsheim, France) and immediately used. Fluorescent Labelling of SELN Fluorescent SELN were synthesized as above after incorporating 0.1–0.2% (total lipid weight) of fluorescent PE. Two probes were incorporated in SELN;1-oleoyl-2-(6-((7-nitro-2-1,3-benzoxadiazol-4-yl)amino(hexanoyl)-sn-glycero-3-phospho-ethanolamine ( N -NBD-PE) and 1,2-dioleoyl-sn-glycero-3-phosphoethanolamine-N-(lissamine-rhodamine sulfone) ( N -Rh-PE). Both fluorescent PE are from Avanti Polar Lipids (Alabaster, Al). The ratio N -NBD-PE/ N -Rh-PE of 5/1 to 5/2 allows fluorescence (or Föster) resonance energy transfer (FRET) and the monitoring of fusion/exchange of SELN with cell membrane. When SELN preparation containing both fluorescent probes is excited at 458 nm, emission at 530 and 585 nm are observed [22] . The latter peak characteristic of N -Rh-PE arises from fluorescence energy transfer after N -NBD-PE excitation at 458 nm. Fusion/exchange is accompanied by spectral changes that are a decrease in emission peak at 585 nm (Em585) and an increase in emission peak at 530 nm (Em530). Each change is indicative of a reduction in the efficiency of energy transfer between N -NBD-PE and N -Rh-PE consistent with fusion/exchange of fluorescent vesicles followed by lateral diffusion/exchange of fluorescent lipids in the plane of cell membrane. This process lowers the surface density of the energy acceptor N -Rh-PE and consequently decreases the efficiency of the energy transfer compared to starting fluorescent SELN. Under the used conditions when SELN are excited at 458 nm, essentially all the fluorescence at 530 nm comes from N -NBD-PE. Thus the % of efficiency energy transfer ( E(% )) which decreases upon fusion/exchange is defined by the relationship [22] E( %) = (1– (f/f 0 )) x100, where f is the fluorescence at 530 nm ( N -NBD-PE) and f 0 is the fluorescence at 530 nm in the presence of 1% Tween 20. This detergent destroys vesicle structure with the dilution of fluorochromes in a micellar system. Consequently energy transfer between fluorescent molecules is annihilated. Fluorescence spectra were recorded on a LS45 spectrofluorometer (Perkin Elmer, Courtaboeuf, France).
Cell Transfection
Stable transfection of HEK (Human Embryonic Kidney) 293T cells at 60–80% confluence in DMEM (10% FCS) was performed with pEGFP-C1 and pEGFP-ICN plasmids expressing either fluorescent protein EGFP or EGFP and the active intracellular domain of Notch-1 (both plasmids are gifts from Dr. Freddy Radtke, Epalinges, Switzerland) using the JetPrime-mediated PolyPlus transfection kit according to the manufacturer’s instructions (Illkirch, France). HEK 293T cells were incubated with transfection medium at 37°C in 5% CO 2 for 6–12 h, then the medium was removed and cells were incubated in 10% FCS-DMEM. Cells were used after 24 h when transfection reaches its maximum as assessed by fluorescent EGFP. Cells were then seeded in 96-well culture plates as above and cultured for 24 h in 0.1% FCS DMEM medium. Quiescent HEK 293T cells were challenged with SELN and cell survival was finally assessed by MTT.
Notch-1 siRNA Transfection
MiaPaCa-2 cells were plated in 6-well tissue culture plates at a density of 3×10 5 cells/well. Prior transfection, the culture medium was removed and replaced with OPTI-MEM culture medium (Gibco, Carlsbad, CA). Cells were transfected either with the mix of Notch-1 siRNA or the control siRNA at a concentration of 100 nM, using Oligofectamin (Invitrogen) according to manufacturer’s instructions. After 6h of incubation, FCS was added to the media (10% final) and 24 hours after transfection 16 000 cells were seeded in 96-well culture plates, as soon as cells became adherent they were starved one night. Then, 48 hours after transfection, cells were challenged with SELN6.0 during 24 hours. Finally cell survival has been assessed through a MTT test (Notch-1 knock-down is observed at least during 72 hours after transfection).
Confocal Microscopy
Cells were seeded in appropriate medium on cover-slips in 12 well-plates (BD Falcon, Le Pont-de-Claix, France). Once adherent cells were starved for 24h and incubated at 37°C with N -Rh-PE-loaded SELN. Cells were fixed (paraformaldehyde, PFA, 2% in PBS, 37°C, 15 min) and saturated (bovine serum albumin, BSA, 1% in PBS, 30 min). The cells were then incubated successively with the mAb16D10 primary antibodies for 90 min to label cell plasma membrane [23] and then with secondary antibody to IgM coupled to FITC for 45 min. All the later stages were carried out at 4°C. Plasma membrane lipid microdomains were visualized via the binding of the cholera toxin subunit B (CT-B, Vybrant® lipid raft labeling kit, Molecular Probes, Eugene, OR) to raft ganglioside GM1. For this purpose SOJ-6 cells were grown in complete RPMI 1640 medium, incubated with SELN6.0- N -Rh-PE during 5 min (in RPMI 1640 depleted in FCS, 37°C) before washing twice with PBS. Then cells were fixed with PFA, washed and incubated according to the manufacturer with the CT-B (10 min, 4°C) before washed and incubated with Alexa-Fluor 488–conjugated antibodies against CT-B (15 min, 4°C). To detect the intracellular localization of the CT-B, cells were first incubated with the CT-B (see above), washed, and incubated with Alexa-Fluor 488–conjugated antibodies against CT-B, before incubation with SELN6.0- N -Rh-PE, during 5 or 30 min at 37°C. Finally they were fixed with PFA. For Rab5A, Lamp-1 and Notch-1 localization, cells were incubated with N -Rh-PE SELN6.0 for times as indicated then fixed with PFA (see above) permeabilized (0.1% saponin in PBS, 30 min, room temperature), saturated (BSA 1%, 30 min) and incubated with antibodies to the extracellular domain of Notch-1, to Rab5A and to Lamp-1 and detected with Alexa-Fluor 488-labelled secondary antibodies. In each experiment, the cell nuclei were labelled 10 min at 37°C with 1 µM Draq5, a far-red fluorescent DNA dye (Biostatut Limited, Shepshed, UK). For observations, Confocal Laser Scanning Microscopy experiments were performed using a Leica SP5 microscope coupled with a Leica scanning device (Leica Microsystems, Mannheim, Germany). The inverted microscope was equipped with a Plan-Apochromat 63× objective (NA = 1.4). Images were recorded with LAS AF Lite acquisition software and were calculated with the public-domain ImageJ software (NIH; http://rsb.info.nih.gov/nih-image/ ). Each image was represented with 1024×1024 pixels measuring 70×70 nm 2 each on average, and recorded with a frame mode to reduce background noise (average on three scanning images). Image acquisition was performed with the Confocal Laser Scanning Microscope (CLSM) spectral mode selecting specific domains of the emission spectrum, i.e. FITC was excited at 488 nm with an argon laser and its fluorescence emission was collected between 500 and 530 nm. Monitoring Caspase Activation SOJ-6 cells grown in 8-well plates (BD Falcon) were treated with SELN for 24 h prior to the addition of CaspACE FITC-VAD-fmk in situ marker (Promega, Charbonnière, France) at a final concentration of 10 µM in the culture medium according to manufacturer’s instructions. Then cells were washed in PBS, fixed (15 min, 37°C) in 2% paraformaldehyde, and washed once again. The number of fluorescent cells was determined in triplicate on collection of 10 fields randomly examined under a fluorescence microscope (Axiover, Carl Zeiss, Iena, Germany). When stated, cells were pre-incubated for 4 h with caspase inhibitors (4 µM) before treatment with SELN. Apoptosis Determination Apoptosis was determined using the Terminal Transferase dUTP Nick End Labeling (TUNEL) assay to detect DNA degradation in apoptotic cells. For this purpose ApopTag ® Red In Situ Apoptosis Detection Kit (Merck, Millipore) was used. Briefly, fragmented DNA was stained according to the protocol given with the kit. Nuclei were counterstained with diamidino-2-phenylindole (DAPI). Apoptotic cells were visualized under a Zeiss fluorescence microscope equipped with a digital camera. The ratio of apoptotic cells to total cells was counted in 5-to-10 random fields representing 600-to-800 cells of three independent experiments. Sucrose Density Gradient SELN loaded with trace amount of [ 3 H]-cholesterol were suspended in 0.5 ml of Hepes buffer (20 mM, pH = 7.4) supplemented with sucrose to reach a density of 2.5 g/ml. Twelve ml of a linear gradient of sucrose (0.25–1 M) density was layered on 1 ml of SELN suspension and ultracentrifuged [11] . Fractions (1 ml) were collected and radioactivity counted. The density of each fraction was determined by refractometry.
Electron Microscopy
Three µl of freshly prepared SELN was examined by electron microscopy to determine their size. SELN were disposed on top of Formvar-coated 300-mesh carbon grids and treated as described [11] . Nanoparticles on grids were examined and pictures were captured at 0, 24 and 48 h, using the built-in microscope (JEM 1400, Jeol, Croissy/Seine, France) software and treated with Image J software to measure SELN diameters. SDS-PAGE and Western Blottings After treatment, the cells were washed three times with ice-cold PBS, harvested and pelleted by centrifugation. Pellets were washed twice and lysed at 4°C in 0.5 ml of lysis buffer (10 mM Hepes pH 7.4, 200 mM NaCl, 1.5% Triton X-100, 5 mM EDTA, 2.5 mM MgCl 2 , and 2 mM CaCl 2 , protease inhibitors, (Complete TM, Roche Diagnostics, Meylan, France) and phosphatase inhibitors cocktail (Sigma). After lysis, homogenates were sonicated (10 sec, 40 W, 4°C) clarified by centrifugation at 10, 000×g for 15 min at 4°C. An aliquot was saved for protein determination using the bicinconinic acid (µBCA) assay (Pierce, Rockford, IL). Proteins in reducing SDS buffer were separated on 10% polyacrylamide gels and 0.1% SDS. After electrophoretic migration, proteins were transferred onto nitrocellulose membranes and processed for immunoblotting by using appropriate primary and POD-labelled secondary antibodies. After washes, membranes were developed with a chemoluminescent substrate [11] .
Lipid Analysis
Lipids were extracted in chloroform-methanol-water (1∶2∶0.9, v/v/v) in a Dounce homogenizer in the presence of standards and then analyzed by gas liquid chromatography for phosphatidylcholine and cholesterol mass content as already described [11] , [47] .
Statistical Analysis
Each experiment was done at least three times and results expressed as means ± SD. Difference between experimental groups were analyzed with the Student’s t -test or the Mann-Whitney test as specified in the legend of figures. Significance was set as (*) P ≤0.05; (**) P
📊 Figures
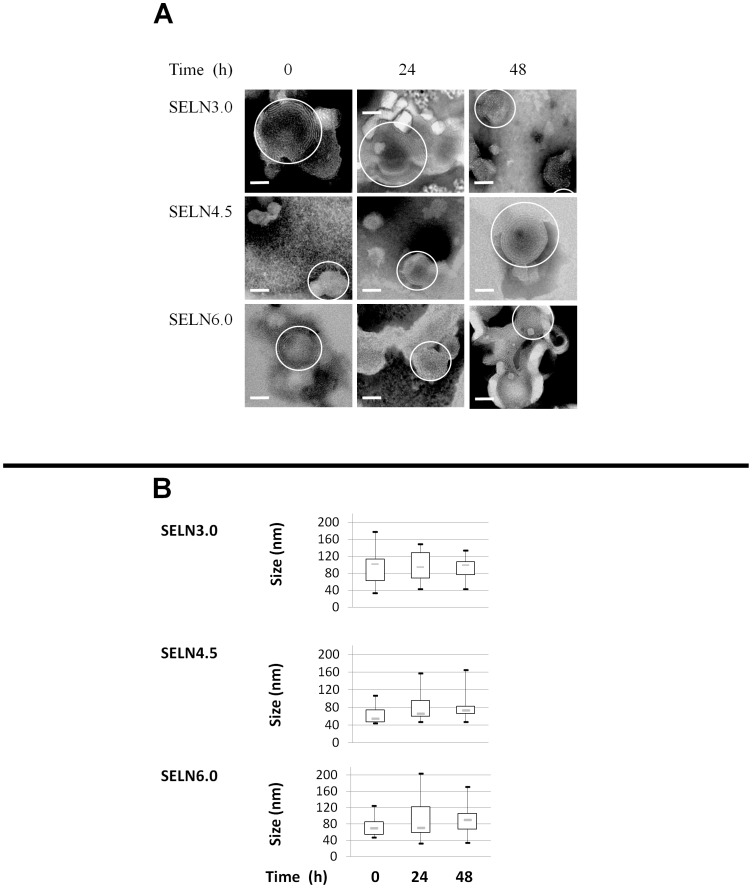
Figure 1
Synthetic exosome-like nanoparticles (SELN).
(A) Synthetic exosome-like nanoparticles (SELN) were examined by electron microscopy. SELN3.0, SELN4.5 and SELN6.0 preparations were incubated at room temperature, then 3 u00b5l were removed at 0, 24 ...
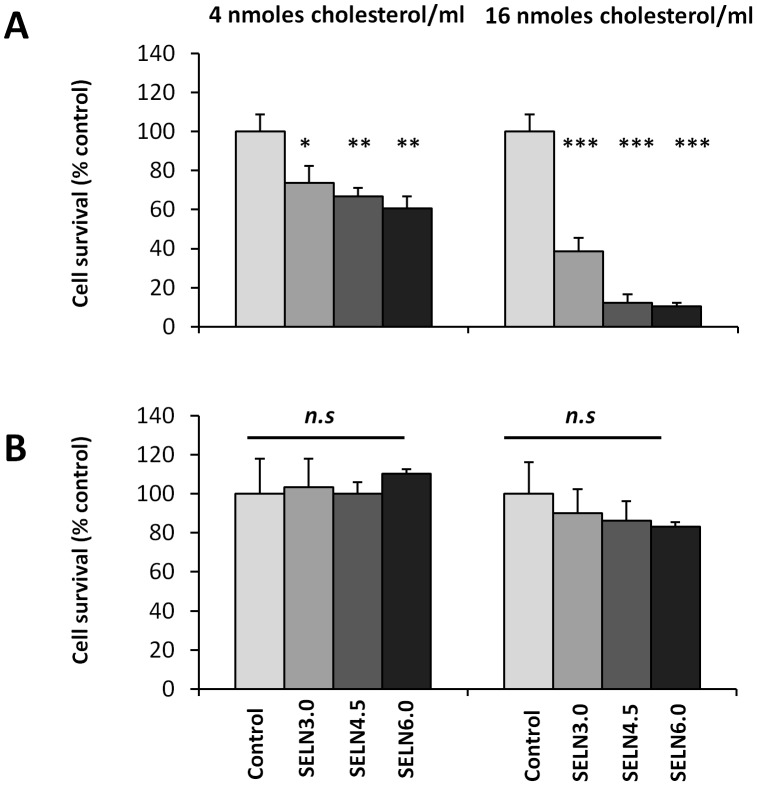
Figure 2
Survival of SOJ-6 and MiaPaCa-2 cells in the presence of SELN.
SOJ-6 (A) and MiaPaCa-2 (B) cells were starved and incubated for 24 h with SELN (left panel; 4 nmoles of cholesterol/ml, right panel; 16 nmoles of cholesterol/ml). Cell survival was determined by MTT ...
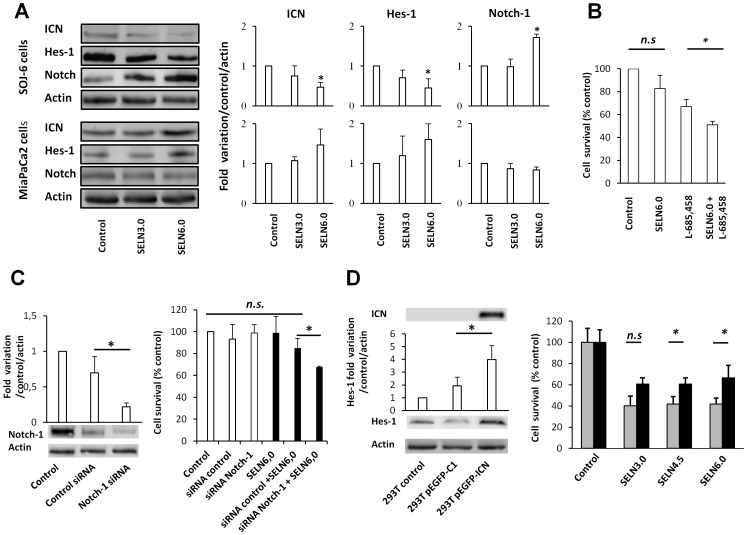
Figure 3
Effect of SELN on Notch pathway.
(A) SOJ-6 and MiaPaCa-2 cells were starved then treated for 24 h with SELN (16 nmoles cholesterol/ml) and lysed. Cell lysate proteins were separated on SDS-PAGE (80 u00b5g of proteins/lane) and electr...
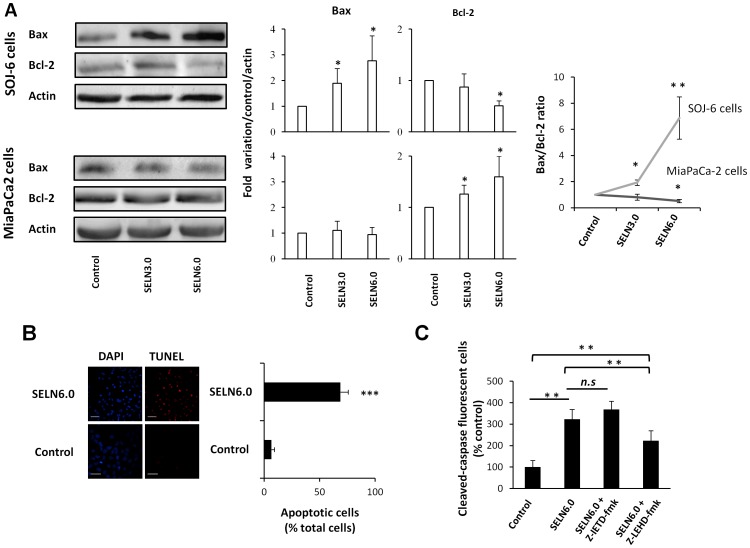
Figure 4
Effect of SELN on apoptosis.
(A) SOJ-6 and MiaPaCa-2 cells were starved then treated for 24h with SELN (16 nmoles cholesterol/ml) and lysed. Cell lysate proteins were separated on SDS-PAGE (80 u00b5g of proteins/lane) and electro...
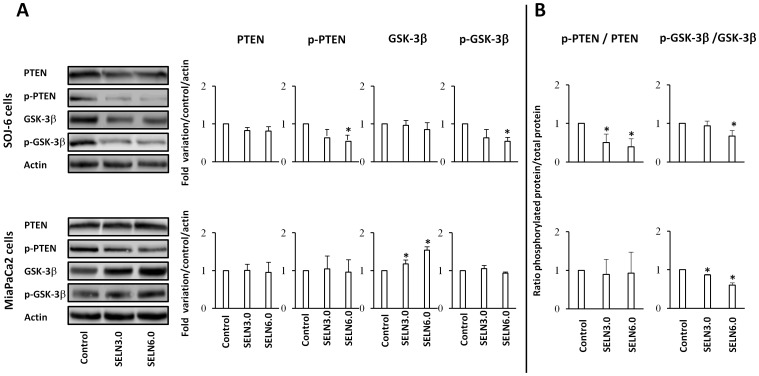
Figure 5
Effect of SELN on PTEN and GSK-3u03b2 phosphorylation.
(A) SOJ-6 and MiaPaCa-2 cells were starved then treated for 24h with SELN (16 nmoles cholesterol/ml) and lysed. Cell lysate proteins were separated on SDS-PAGE (80 u00b5g of proteins/lane) and electro...
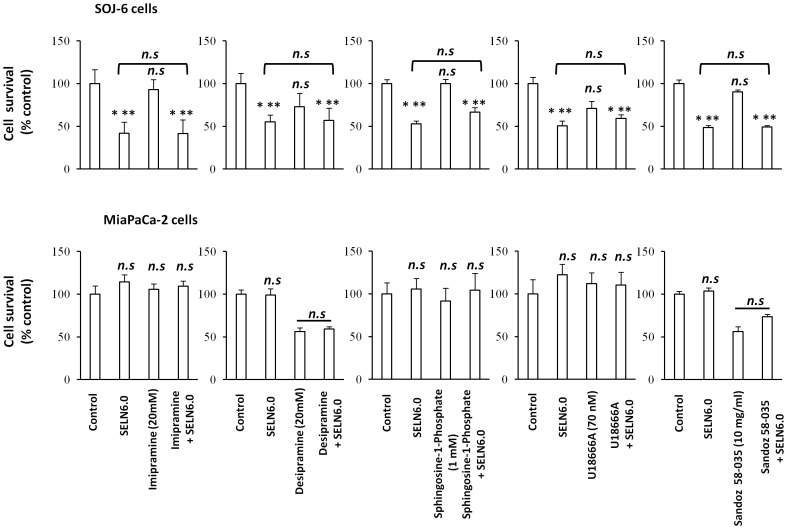
Figure 6
Proliferation of MiaPaCa-2 and SOJ-6 cells in the presence of drugs.
MiaPaCa-2 and SOJ-6 cells were incubated 1h with drugs affecting lipid metabolism at the indicated concentration then SELN6.0 (16 nmoles cholesterol/ml) were added for 24h in the presence or absence (...
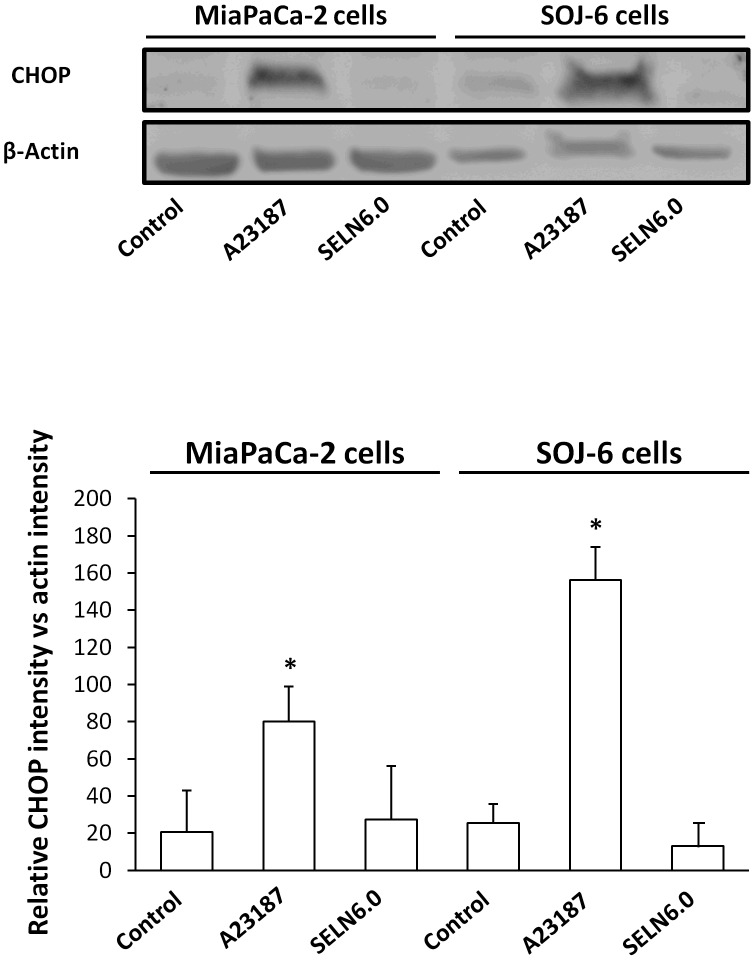
Figure 7
SELN cholesterol and UPR response.
MiaPaCa2 and SOJ-6 cells were starved then incubated for 24h in the presence of the UPR inducer calcium ionophore A23187 (2.5 u00b5g/ml), in the presence of SELN6.0 (16 nmoles cholesterol/ml) and in t...
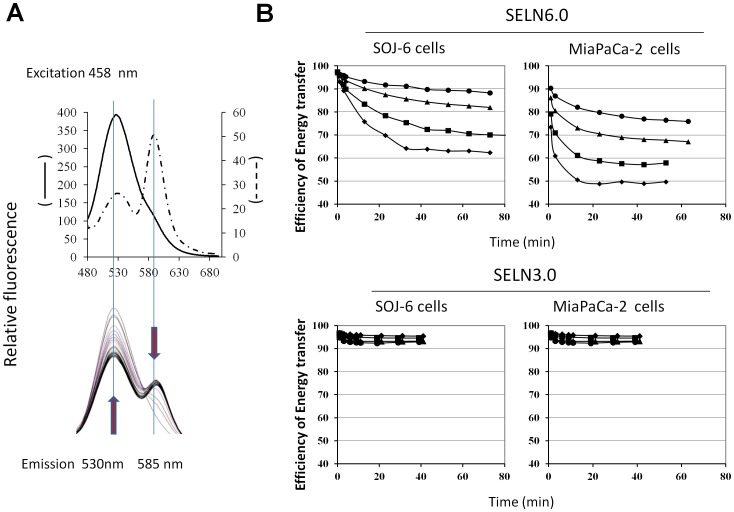
Figure 8
SELN interactions with SOJ-6 and with MiaPaCa-2 cells.
(A) Left spectrum depicts a typical FRET obtained with SELN6.0 labeled with N -NBD-PE and N -Rh-PE. Once excited at 458 nm, N -NBD-PE transfers energy to N -Rh-PE generating light emission at 585 nm (...
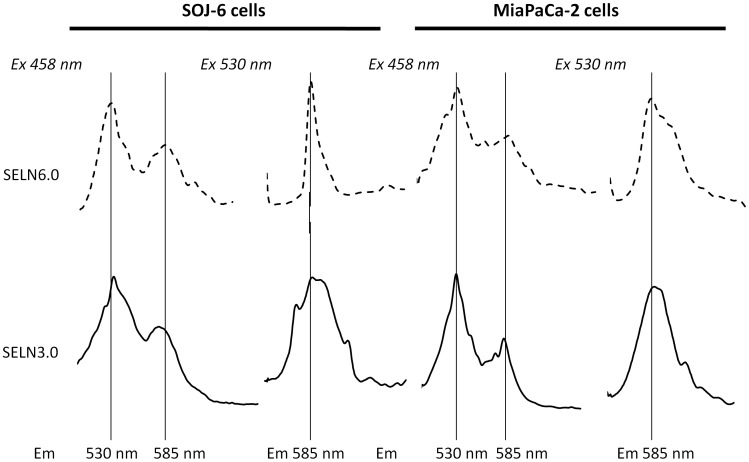
Figure 9
Cell fluorescence upon incubation with fluorescent SELN.
SOJ-6 and MiaPaCa-2 cells (0.5u00d710 6 cells) were suspended in 2 ml (final volume) of PBS and incubated for 90 min (25u00b0C) with 50 u00b5l SELN3.0 and SELN6.0 (4 nmoles cholesterol/ml). Cells were...
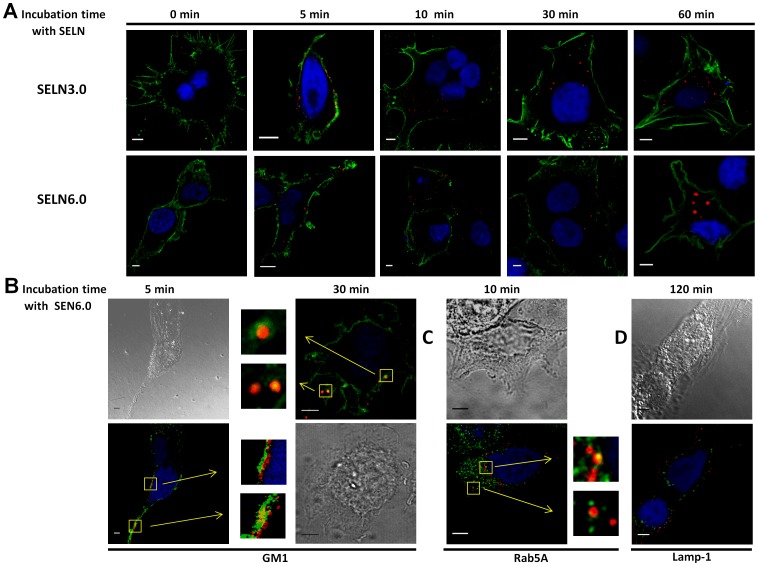
Figure 10
Fluorescent SELN incorporation.
(A) SOJ-6 cells were seeded on 1.4 cm-diameter cover slips in 12-wells plate, once adherent cells were starved for 24h before incubation with SELN3.0 or SELN6.0 (8 to 10 u00b5l of SELN solution corres...
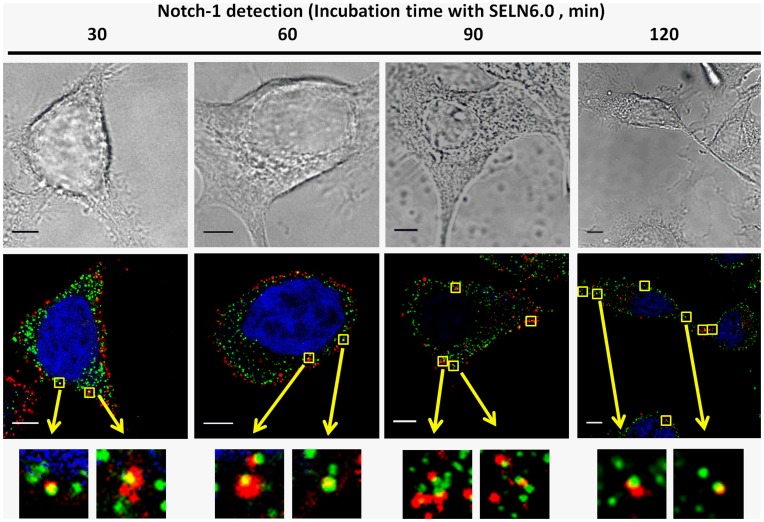
Figure 11
Co-localization of Fluorescent SELN6.0 with Notch-1 in SOJ6 cells.
SOJ-6 cells were treated as in Fig. 10 and incubated (for the indicated times) with N - Rh-PE-loaded SELN 6.0 (1.6 nmol cholesterol/100 u00b5l culture medium). Cells were fixed with PFA, permeabilized...
Figure images are served from the NIH/NLM PubMed Central Open Access Subset or Europe PMC; copyright remains with the publishers and authors.
💬 Discussion
0 commentsNo comments yet. Be the first to start a discussion!
Leave a Comment